Observe and monitor a semantic model and Lens
The Lens and its semantic model can be observed and monitored at the following three levels:
Metric monitoring of the Lens
Metric monitoring in Lens is done by Monitor and Pager Resource focuses on tracking the performance and health of the Lens Resources. It helps in measuring key indicators that define the state of the system. A Lens Resource can be monitored using Monitor and Pager Resources. Two types of Monitors can be applied to observe the state of the deployed Lens and the matrix of the semantic model.
Equation Monitor
Equation Monitor observes the Lens and it's semantic model's smetrics to generate the incidents when the condition meets.
1. Create Equation Monitor
Copy and make the necessary changes in the following equation monitor manifest file.
Runs every 2 mins to check if total_customers in the customer table (from the productaffinity semantic model) drops below 50 i.e. total_customers < 50. If true, it triggers an info-level incident: lens-customer-analysis.
# metrics monitor

name: monitor-lens-metric-testing
version: v1alpha
type: monitor
runAsUser: iamgroot
monitor:
  schedule: '*/2 * * * *'
  type: equation_monitor
  equation:
    leftExpression:
      queryCoefficient: 1
      queryConstant: 0
      query:
        type: lens
        lens:
          dataOsInstance:
            name: productaffinity
            workspace: public
            sslmode: 'disable'
        ql: SELECT total_customers FROM customer
        comparisonColumn: {
            name: total_customers,
            dataType: int64
        }
    rightExpression:
      queryCoefficient: 0
      queryConstant: 50
    operator: less_than
  incident:
    type: business-metric
    name: lens-customer-analysis
    category: equation
    severity: info
2. Deploy the Equation Monitor
Deploy the Equation Monitor using the following apply command.
Validate the creation of Equation monitor and check status using the get command:
4. Get the runtime of the Equation Monitor
Get the runtime of the Equation Monitor using the get runtime command:
Equation Pager
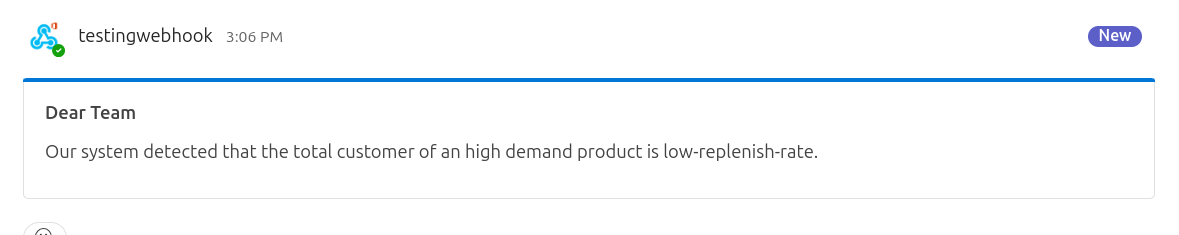
The following configuration defines a Pager Resource named lens-equation-monitoring-pager used for sending alerts to a Microsoft Teams channel when specific conditions related to a Lens Resource are met. The conditions are defined in the above Equation Monitor manifest file. The pager monitors the lens-customer-analysis incident, and when it is triggered, the configured alert is sent.
1. Create the Pager manifest file
name: lens-equation-monitoring-pager
version: v1alpha
type: pager
tags:
  - dataos:type:resource
  - service-failed-pager
description: This is for sending Alerts on Microsoft Teams Channel.
workspace: public
pager:
  conditions:
    - valueJqFilter: .properties.name
      operator: equals
      value: lens-customer-analysis

  output:
    webHook:
      url: "https://rubikdatasolutions.webhook.office.com/webhookb2/09239cd8-92a8-4d59-9621-9217305bf6ed@2e22bdde-3ec2-43f5-bf92-78e9f35a44fb/IncomingWebhook/0df05b99cc6300c898613/83e4eb41-6095-44d5-b0ba-8da9829e9cff/V2vWPDZYPw0zH-96mHWOn--hQyWI7h41"
      verb: post
      headers:
        'content-type': 'application/json'
      bodyTemplate: |
          {
            "@type": "MessageCard",
            "summary": "Total customers are low.",
            "themeColor": "0076D7",
            "sections": [
              {
                "activityTitle": "Dear Team",
                "activitySubtitle": "Our system detected that the total customer of a high demand product is low-replenish-rate."
              }
            ]
          }
2. Apply the Equation Pager
Deploy the Pager using the following apply command:
The above pager raised the incident as shown in the below image:
Report Monitor
The Report Monitor is designed to monitor and match string values, such as the status or runtime of a DataOS resource. It leverages the DataOS API to retrieve real-time data, providing visibility into the operational state and performance of resources. This tool is handy for tracking the ongoing status of resources and ensuring they operate as expected within the system.
The following section outlines the steps to create a Report Monitor Resource that triggers an incident when the state of a Lens changes from 'active' to 'deleted'. Before proceeding, ensure you have the necessary permissions to create a Monitor Resource.
1. Create a Report Monitor to observe the semantic model
Copy the template and replace the Lens name with the actual Lens name.
# Resource meta section
name: lens-status-monitor
version: v1alpha
type: monitor
tags:
  - dataos:type:resource
  - dataos:layer:user
description: Attention! Lens is deleted
layer: user
monitor:

# Monitor-specific section
  schedule: '*/2 * * * *'
  incident:
    name: lens
    severity: high
    incidentType: lens

  type: report_monitor
# Report Monitor specification
  report:
    source:
      dataOsInstance:
          path: /collated/api/v1/reports/resources/status?id=lens:v1alpha:<LENS_NAME>
    conditions:
      - valueComparison:
          observationType: state
          valueJqFilter: '.value'
          operator: equals
          value: deleted
Before applying the Monitor Resource file, it is recommended to verify the response of the API endpoint using an API testing application like Postman. Add the following URL with GET request to test.
https://<DATAOS-FQDN>/collated/api/v1/reports/resources/status?id=lens:v1alpha:<LENS_NAME>:<WORKSPACE_NAME>
Make sure to replace the <LENS_NAME> and <WORKSPACE_NAME> placeholders with the name of the workspace and Lens.
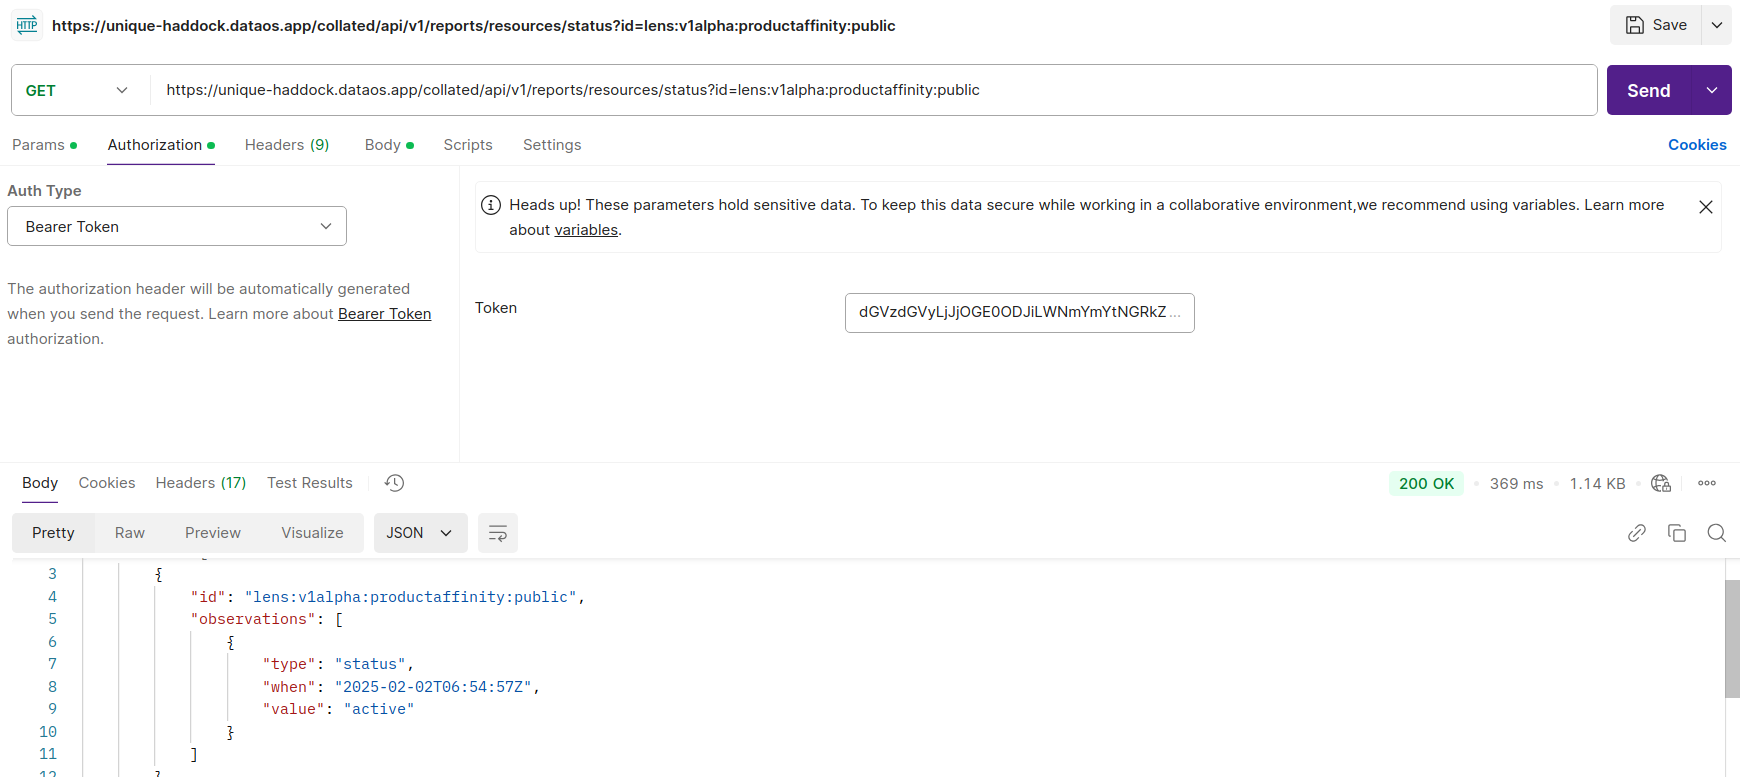
A status code of 200 indicates that you can proceed further.
3. Apply the Monitor manifest file
After validating the API endpoint, the next step is to apply the Monitor manifest file by executing the code below.
4. Validate the Monitor
Validate or check the runtime of the Monitor by executing the below command.
dataos-ctl get runtime -t monitor -w curriculum -n s-monitor1 -r
INFO[0000] 🔍 monitor...
INFO[0000] 🔍 monitor...complete

        NAME       | VERSION |  TYPE   | WORKSPACE |    OWNER
-------------------|---------|---------|-----------|--------------
  runtime-monitor1 | v1alpha | monitor | curriculum    | iamgroot

        NAME       | VERSION |  TYPE   | WORKSPACE |    OWNER
-------------------|---------|---------|-----------|--------------
  runtime-monitor1 | v1alpha | monitor | curriculum    | iamgroot


  STATUS |            RUNTIME
---------|---------------------------------
  active | next:2025-01-28T18:38:00+05:30


      RUN ID    |          STARTED          |         FINISHED          | RUN STATUS |                                                                     RESULT
---------------|---------------------------|---------------------------|------------|-------------------------------------------------------------------------------------------------------------------------------------------------
  ebctzh4krmro | 2025-01-28T18:30:00+05:30 | 2025-01-28T18:30:00+05:30 | completed  | 🟧 monitor condition not met for monitor: 'lens_monitor_curriculum'
---------------|---------------------------|---------------------------|------------|----------------------------------------------------------------------
  ebctt1wkmsxv | 2025-01-28T18:28:00+05:30 | 2025-01-28T18:28:00+05:30 | completed  | 🟧 monitor condition not met for monitor: 'lens_monitor_curriculum'  s
---------------|---------------------------|---------------------------|------------|----------------------------------------------------------------------
  ebctmmokhz42 | 2025-01-28T18:26:00+05:30 | 2025-01-28T18:26:00+05:30 | completed  | 🟧 monitor condition not met for monitor: 'lens_monitor_curriculum'
---------------|---------------------------|---------------------------|------------|----------------------------------------------------------------------
  ebcuiqs8omis | 2025-01-28T18:36:00+05:30 | 2025-01-28T18:36:00+05:30 | completed  | 🟩 monitor condition met for monitor: 'lens_monitor_curriculum', 'lens:v1:productaffinity', created incident id 'abuird1u680'
---------------|---------------------------|---------------------------|------------|-------------------------------------------------------------------------------------------------------------------------------------------------
Report Pager Resource
Create a Report Page Resource to get notified when the status of Lens changes from active to delete.
This section outlines the steps to create a Pager Resource. While we are using Microsoft Teams for notifications in this guide, you can configure other supported platforms based on your requirements.
1. Create a Pager manifest file
Replace the provided values with your actual values and modify the notification template as needed.
name: lensmonitoringpager
version: v1alpha
type: pager
tags:
  - dataos:type:resource
  - service-failed-pager
description: This is for sending Alerts on Microsoft Teams Channel.
workspace: public
pager:
  conditions:
    - valueJqFilter: .properties.name
      operator: equals
      value: lensmonitoring

  output:
    webHook:
      url: https://rubikdatasolutions.webhook.office.com/webhookb2/e6b48e18-bdb1-4ffc-98d5-cf4a3890lkh4@2e22bdde-3ec2-43f5-bf92-78e9f35a44fb/IncomingWebhook/d23792bec444445gg8bb7193145dfae985/631bd149-c89d-4d3b-8979-8e364f62b419/V2ZJfUrl5d8I5xPhM80JyeE9LqKHU53gPsJQX9H8I2fOs1
      verb: post
      headers:
        'content-type': 'application/json'
      bodyTemplate: |
          {
            "@type": "MessageCard",
            "summary": "Lens is active",
            "themeColor": "0076D7",
            "sections": [
              {
                "activityTitle": "Dear Team,",
                "activitySubtitle": "Lens is active",
                "activityImage": "https://adaptivecards.io/content/cats/3.png",
                "facts": [
                  {
                    "name": "Following Lens is active",
                    "value": "{{ index (splitn ":" 4 .ReportContext.ResourceId) "_2" }}"
                  },
                  {
                    "name": "Failure Time:",
                    "value": "{{ .CreateTime }}"
                  },
                  {
                    "name": "Severity:",
                    "value": "{{ .Properties.severity }}"
                  },
                  {
                    "name": "Run Details:",
                    "value": "<a href=\"https://${dataos-fqdn}/operations/user-space/resources/resource-runtime?name={{ index (splitn ":" 4 .ReportContext.ResourceId) "_2" }}&type=lens&workspace=public\Operation</a>"
                  },
                  {
                    "name": "Logs:",
                    "value": "<a href=\"https://${dataos-fqdn}/metis/resources/lens/dataos.public.{{ index (splitn ":" 4 .ReportContext.ResourceId) "_2" }}/run_history\Metis</a>"
                  }
                ]
              },
              {
                "title": "Disclaimer",
                "text": "{{ .Monitor.Description }}"
              }
            ]
          }
2. Apply the manifest file
Apply the manifest file for Pager Resource using following command in your terminal:
Operational monitoring of the Lens
Operational monitoring of the Lens and its semantic model can be done through the Operations App and CLI, providing visibility into the state and behavior of Lens Resources, enabling workload performance tracking, historical runtime analysis, and troubleshooting.
When Lens Resource status is pending, it’s essential to check the services running behind it, such as the API or worker services. These services typically show as successful when the resource is in a running:1 state. However, if the resource is stuck in a pending state, you can easily troubleshoot by clicking on the specific service to view its error logs. This enables quick identification of any issues preventing the resource from transitioning into a running state.
To observe and monitor the Lens error logs using the Operations app follow the below steps:
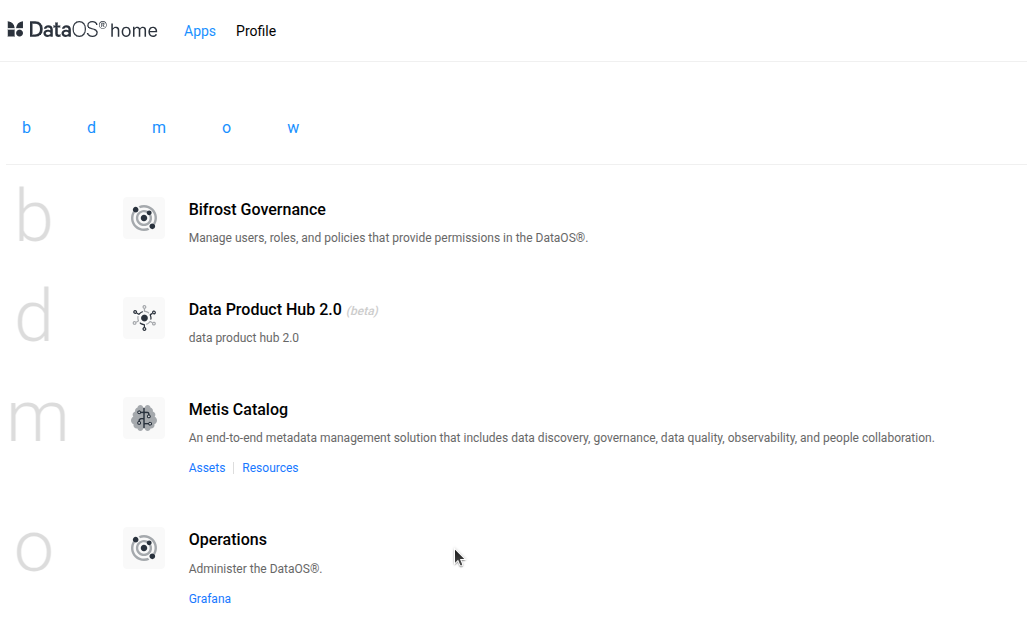
Step 1: Navigate to DataOS
Go to DataOS Home Page > 'Operations.
Step 2: Search Lens
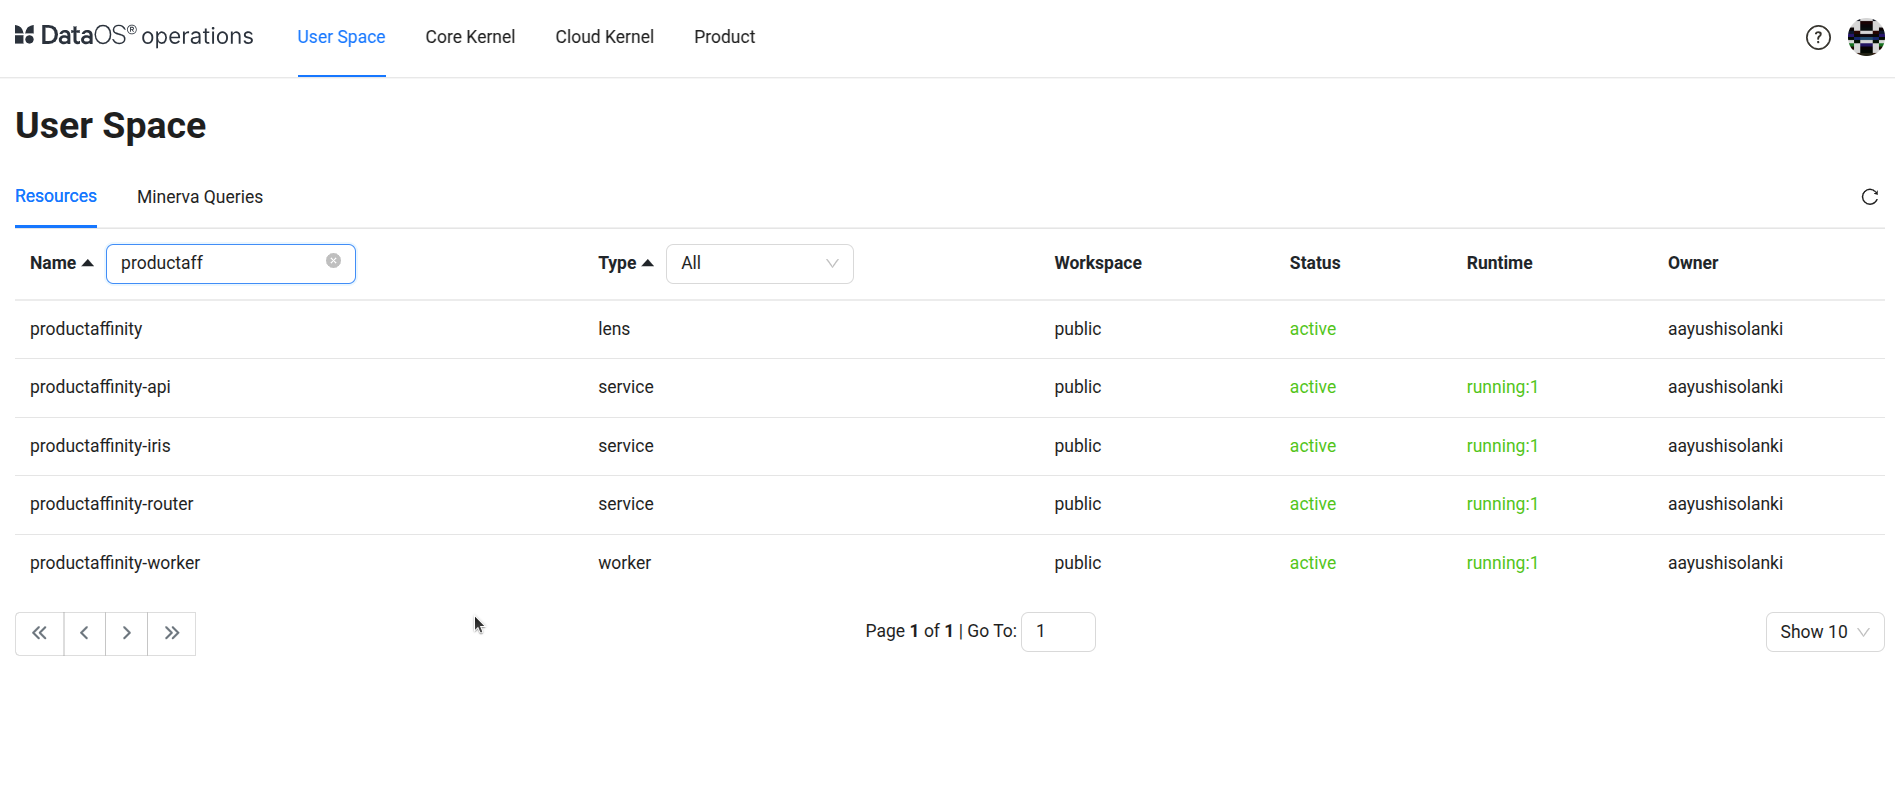
When you click on the Operations app, it launches with the User Space displayed by default. The Resources tab in the User Space contains the log level information of the resources that DataOS users can create and manage within the platform.
Here, search the name of your Lens the search result will have Lens Resource and it's behind the scenes running services. For instance, the name.
Step 3: Click on the Lens services such as API, Worker, Router etc.
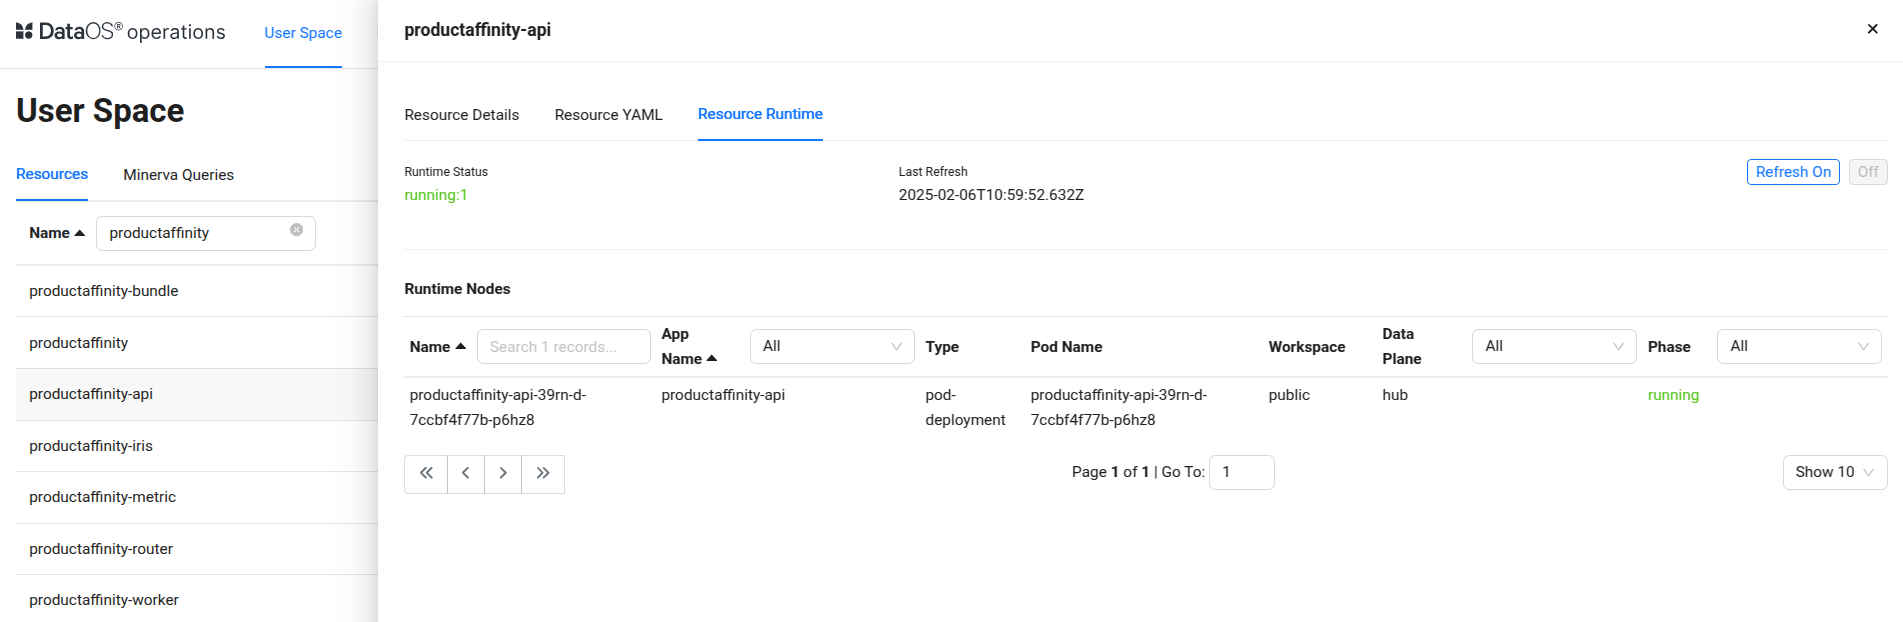
Click on any of the Service with 'pending' state to troubleshoot it. For instance, here we click on the 'productaffinity-api' Service to troubleshoot it. As clicked on the productaffinity-api Service a dialog box appears as shown below
Here one can observe the status, runtime status, building stage etc. From here click on the Resource Runtime tab.
Step 4: Navigate to the 'Resource Runtime' tab
In the productaffinity-api dialog box navigate to the 'Resource Runtime' tab. On Resource Runtime tab click on the productaffinity-api node in the Runtime Node section of the page.
Step 5: Navigate to the Runtime Node Logs tab
As you navigate to the productaffinity-api runtime node the runtime node dialog box opens. It gives the details on the following:
-
Runtime Node Details: Under Runtime Nodes, click on a node to get the runtime YAML, Logs, and Runtime Node Usage. Here you will get the container details, their state, and pod lifecycle conditions(Ready, PodScheduled…) with a status (True, False or Unknown) that make up the ‘computed state’ of a pod at any time.
-
Runtime Node Logs:Runtime Node Logs provide a near real-time view. These logs provide insights into the current health of the node environment and can be helpful for debugging issues.
-
Runtime Node YAML: Inspect the
productaffinity-apiYAML. -
Runtime Node Usage Check how much memory and CPU is utilized by a Node.
Observe and Monitor Query Statistics across data sources
To observe and monitor the source query statistics and to find out which tables in the database are most heavily used, i.e. the number of users queried the table, the number of times it was queried, etc., Navigate to the respective query monitoring tools for each source. These tools provide insights into query execution, performance metrics, and resource utilization, enabling efficient analysis and optimization. For Minerva and Themis Clusters, this can be managed directly within the Operations App.
Check Query Stats for Minerva
To check the query statistics, please follow the steps below:
Step 1: Go to Operations app → 'Minerva Queries' tab
Set the following filters:
-
Source:
lens2 -
Dialect:
trino_sql
Optionally, refine your results by filtering based on Cluster, Username, or other available criteria as needed.
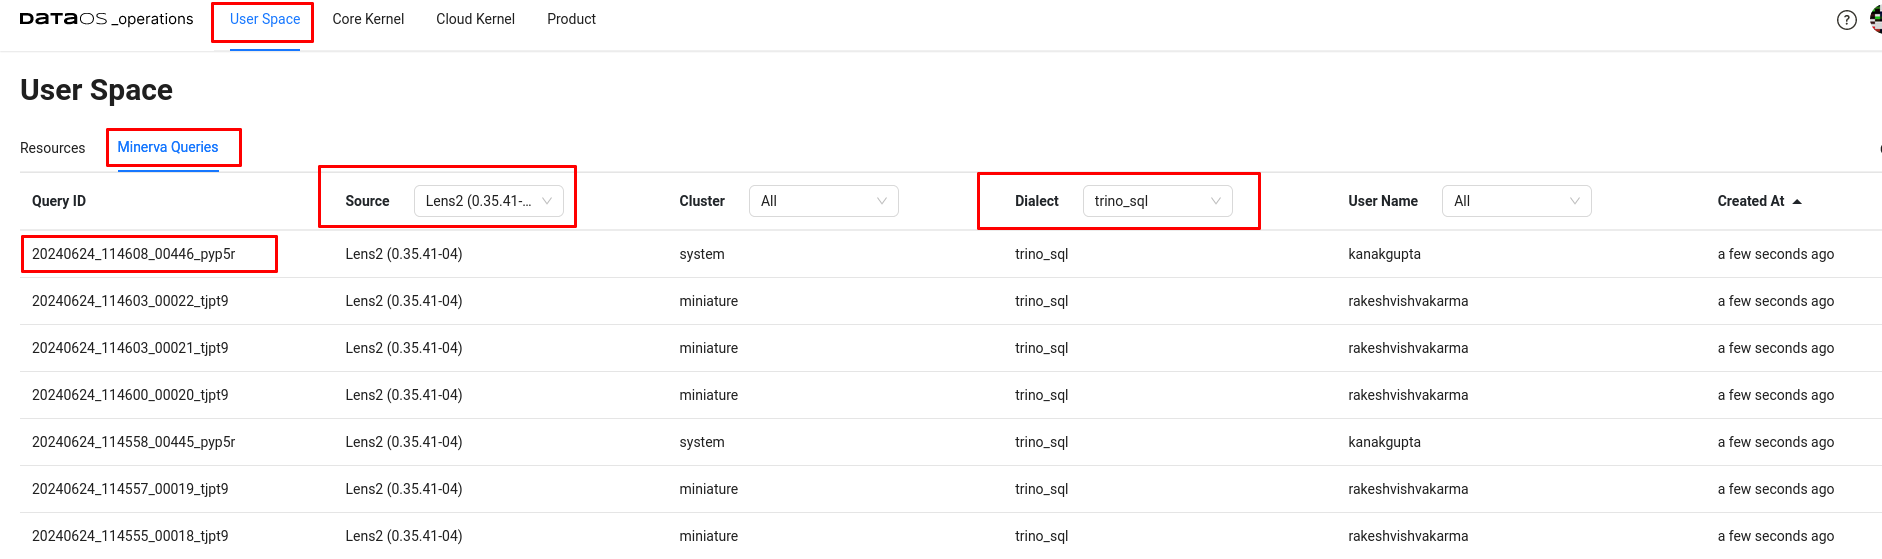
Step 2: Select a Query ID
Pick a Query ID to view stats like performance, execution time, and resource usage.
Check query statistics for AWSRedshift
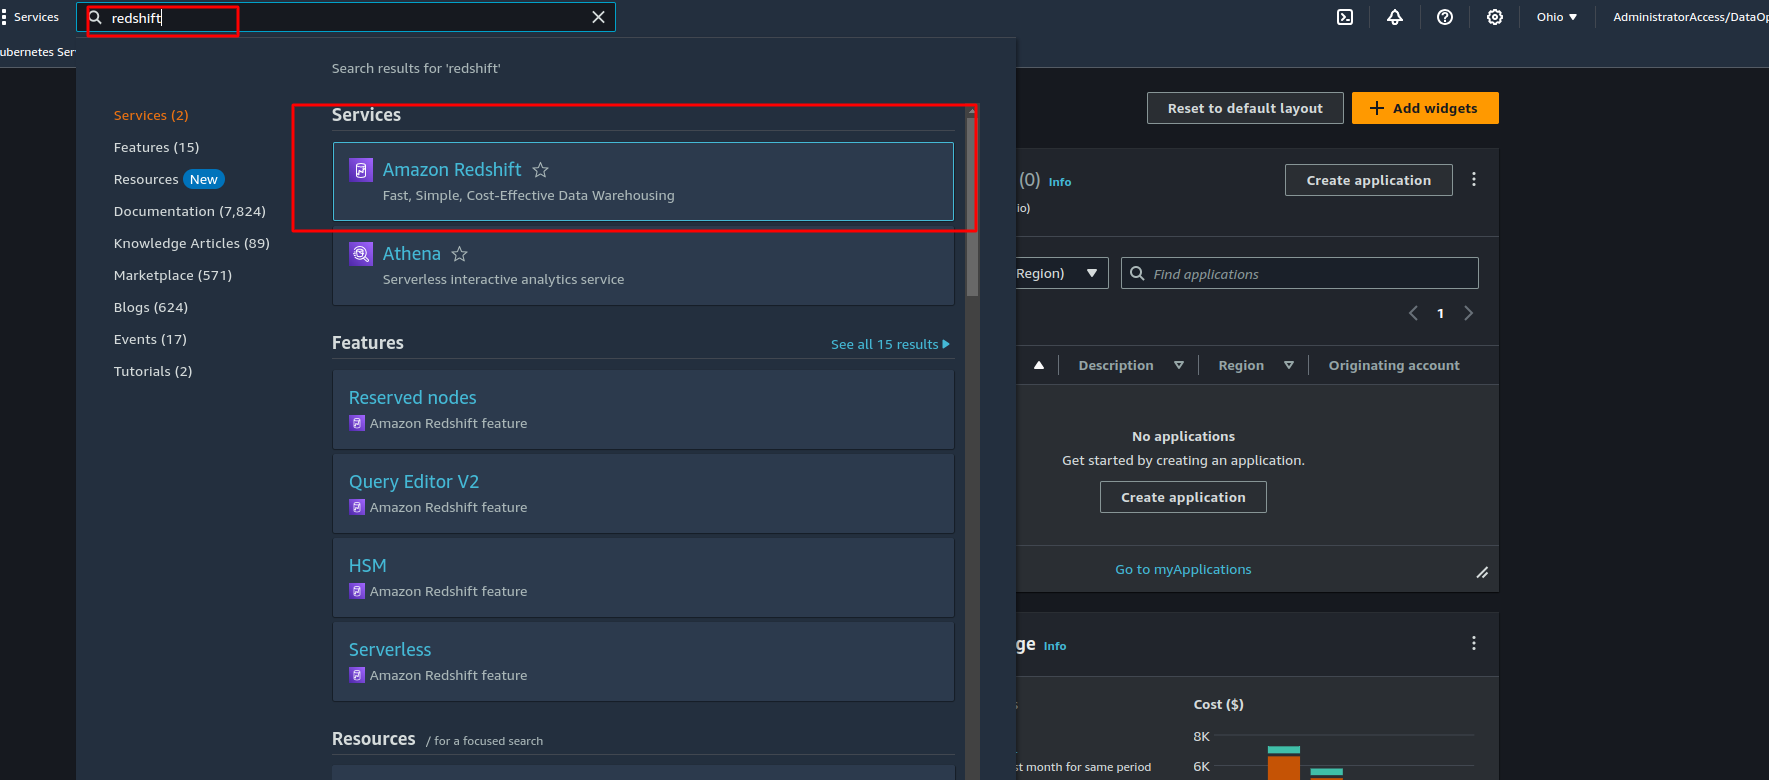
Step 1:Log in to AWS Console
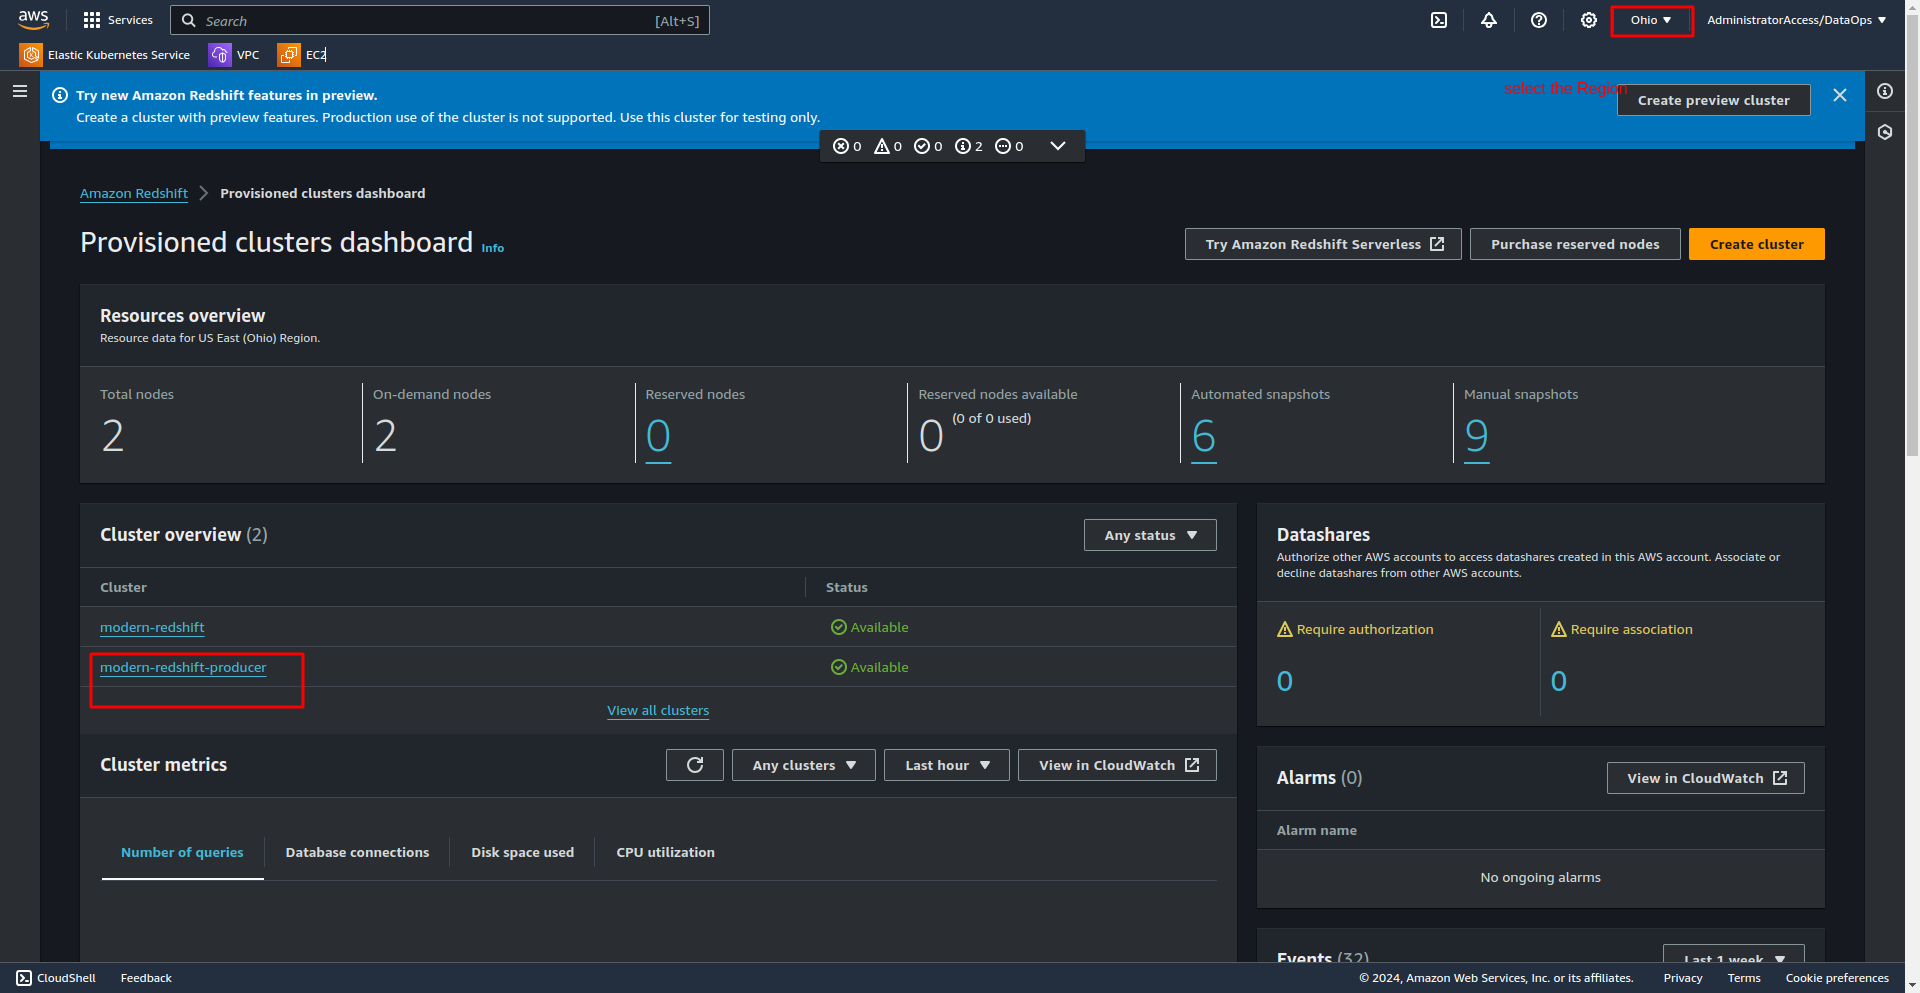
Login to the AWS Console and search for ‘Redshift’ in the AWS Console search bar to access the Redshift.
Step 2: Select Redshift Cluster
Navigate to the Amazon Redshift service from the search results. The Redshift dashboard will be displayed. Select the appropriate region and choose the desired cluster from the available list.s
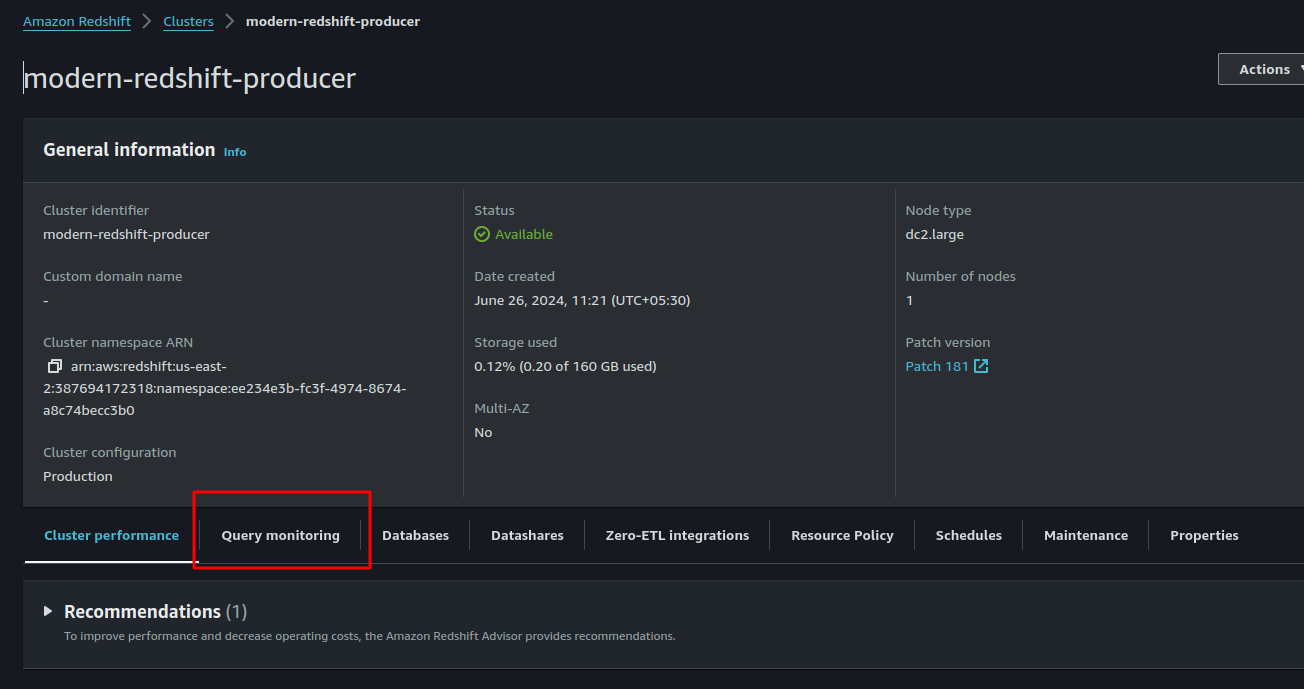
Step 3: Access Query Monitoring
Select the desired cluster to monitor. Navigate to the 'Query monitoring' tab to view query statistics.
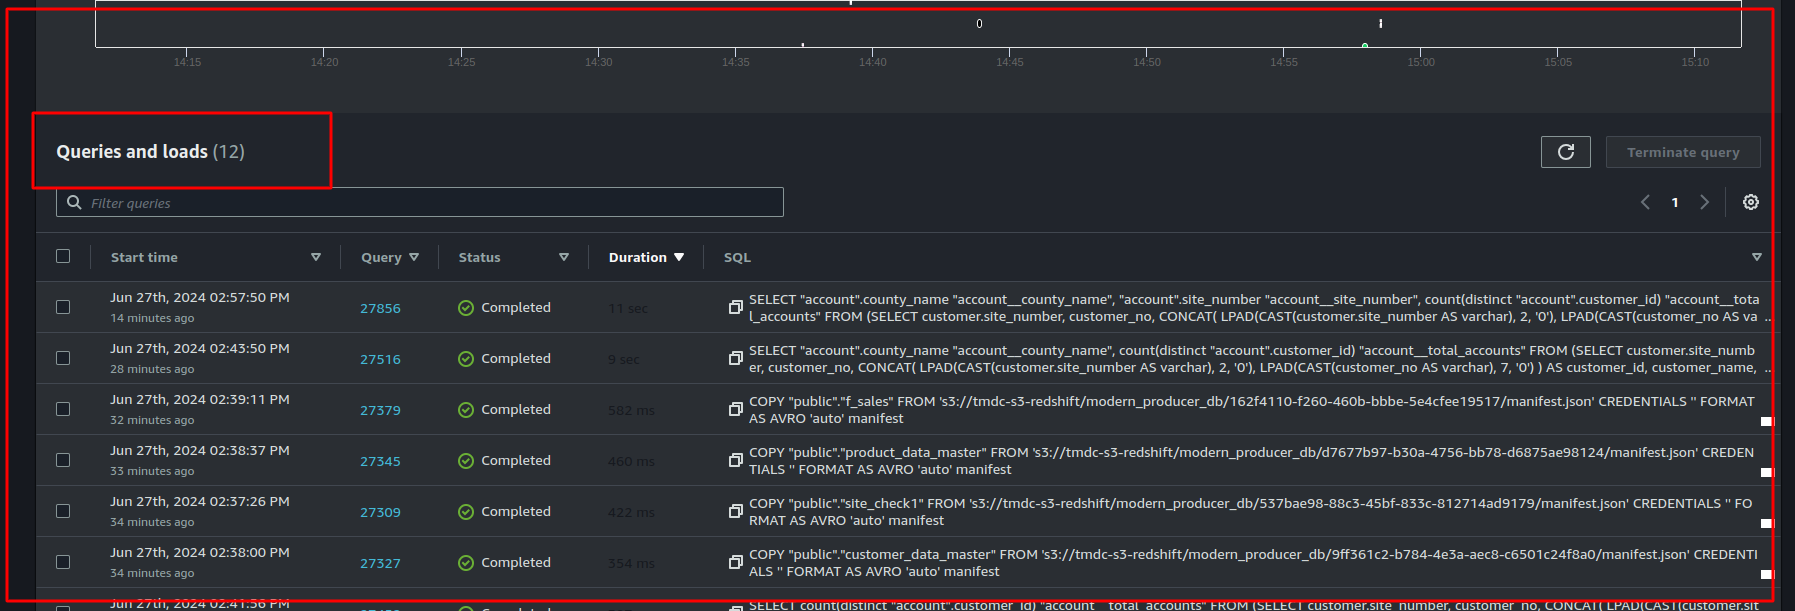
Step 4: View running and completed queries
Under the 'Query monitoring' tab, a list of running and completed queries will be displayed.
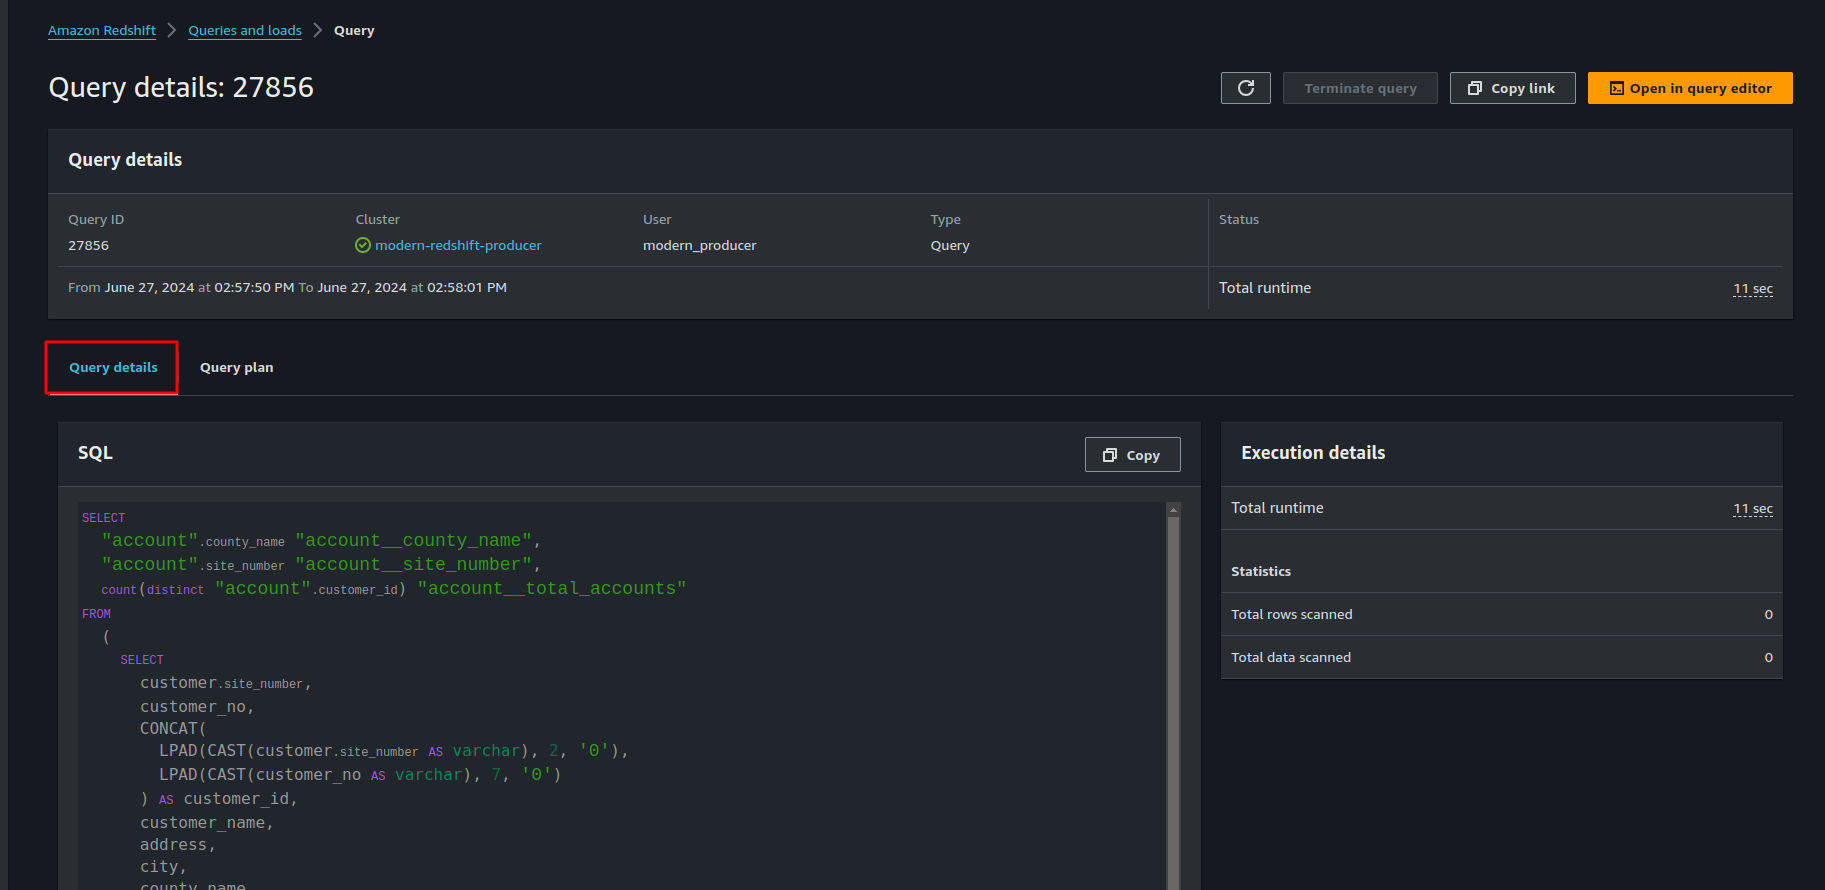
Step 5: Monitor specific query
Select the query of interest to monitor. The query statistics will be displayed, as shown in the example below.
Check Query Stats for Themis
To check the query statistics, please follow the steps below:
Step 1: Access the Themis Cluster:
Navigate to the Themis cluster. You should see a screen similar to the image below:
.png)
Step 2: Select the Running Driver: Choose the running driver. This driver will always be the same, regardless of the user, as queries will be directed to the creator of the Themis cluster.
Step 3: View the Spark UI: Go to the terminal and use the following command to view the Spark UI:
dataos-ctl -t cluster -w public -n themislens --node themis-themislens-iamgroot-default-a650032d-ad6b-4668-b2d2-cd372579020a-driver view sparkui

dataos-ctl -t cluster -w public -n themis_cluster_name --node driver_name view sparkui
The following interface will be displayed:
.png)
Infrastructure monitoring of the Lens Service using Grafana
Grafana offers robust capabilities to monitor and visualize critical Lens service performance metrics such as CPU usage, memory consumption, network traffic, and more. These monitoring capabilities are especially useful for services that require constant oversight to ensure optimal performance, such as Lens services and Flash service deployments.
In a Lens deployment, three core services are typically running: API, Worker, and Router. If Flash is used as a data source, a fourth service is included. This gives a total of four services to monitor, each of which can be tracked for performance metrics like CPU usage and memory consumption.
For instance, suppose the Flash Service is scheduled to run at 12:00 PM every day. Using Grafana, a dashboard can be configured to monitor its CPU usage and memory consumption over time, providing detailed insights into resource utilization and allowing for effective monitoring.
1. Defining Resource requests and limits
When deploying the Flash service, resource requests and limits are defined in the YAML configuration file. These settings control the amount of CPU and memory allocated to the service, ensuring it operates within specified boundaries.
Here’s a simplified example of the YAML configuration:
resources:
    requests:  #Requests define the minimum resources required to run the service.
        CPU: 1000m
        memory: 2Gi

    limits: #Limits specify the maximum resources that the service can consume, ensuring it does not exceed resource thresholds.
        CPU: 48000m
        memory: 450Gi
2. Create dashboard and monitor usage
After the Flash service is deployed, a Grafana dashboard should be created to monitor key metrics such as CPU usage and memory consumption. This dashboard will provide real-time data about how resources are being utilized over time.
After monitoring the Flash Service for a period of time, the actual resource usage can be observed on the Grafana dashboard. For example:
- CPU usage: The dashboard might show a peak of 380m CPU usage, well below the maximum limit of 48000m.
- Memory usage: The memory usage might peak between 254GB to 500GB, which is lower than the maximum limit of 450Gi.
Based on this observed data, resource requests and limits can be adjusted to optimize usage:
- CPU adjustment: If actual CPU usage peaks at
380m, you can reduce the requested CPU from 1000m to something more appropriate, such as500m. - Memory adjustment: If memory usage does not exceed
350Giregularly, you can reduce the limit from450Gito350Gi. -
Set up alerts for usage limit exceedance Grafana allows you to set up alerts that notify you when the service exceeds predefined resource thresholds. For example:
-
CPU Alert: Set an alert to trigger if CPU usage exceeds 90% for 5 minutes.
- Memory Alert: Set an alert to notify when memory usage exceeds 90% of the requested limit.
These alerts can be sent via various channels like email, MS Teams, or other messaging systems to ensure immediate action can be taken if resource usage crosses critical limits.
To create dashboard using Grafana follow the below steps:
Navigate to the DataOS Home Page > Grafana.
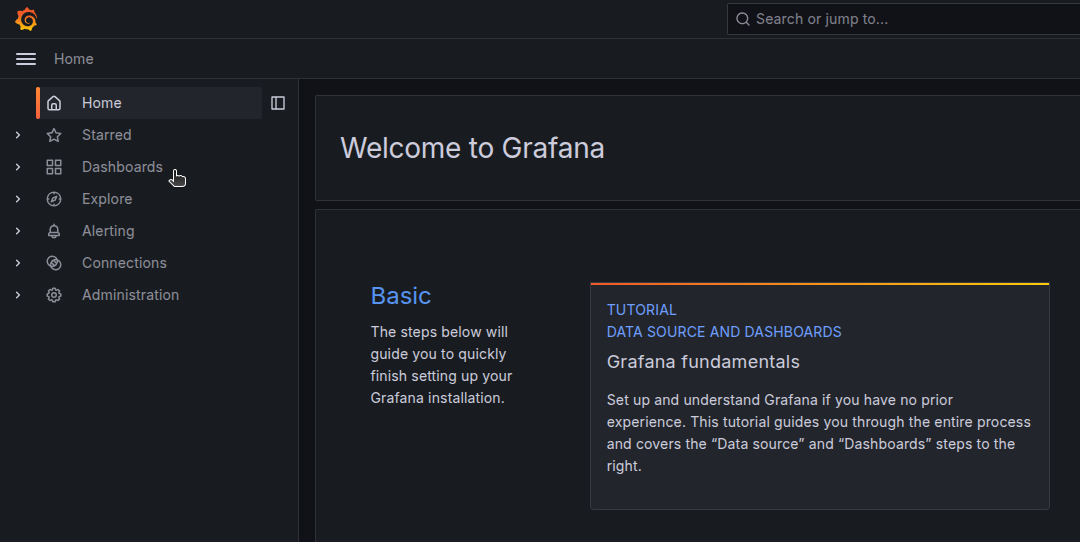
On Grafana Home page click on the 'Dashboards' button in the side panel tab.
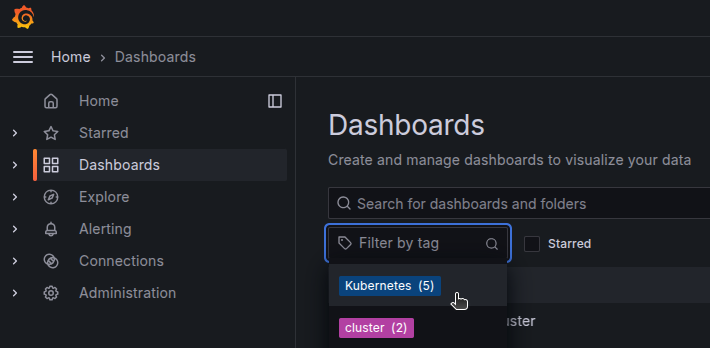
In the 'Dashboards' page click on the 'Filter by tag' and click on the 'Kubernetes' tag.
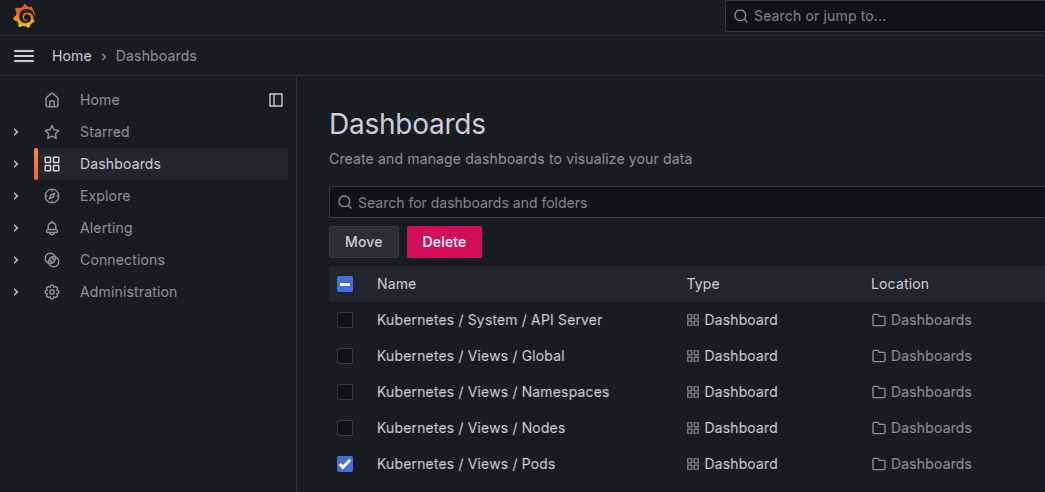
A list of Kubernetes dashboards will appear. To view the pod service of the Lens, check the 'Kubernetes/Views/Pods' checkbox.
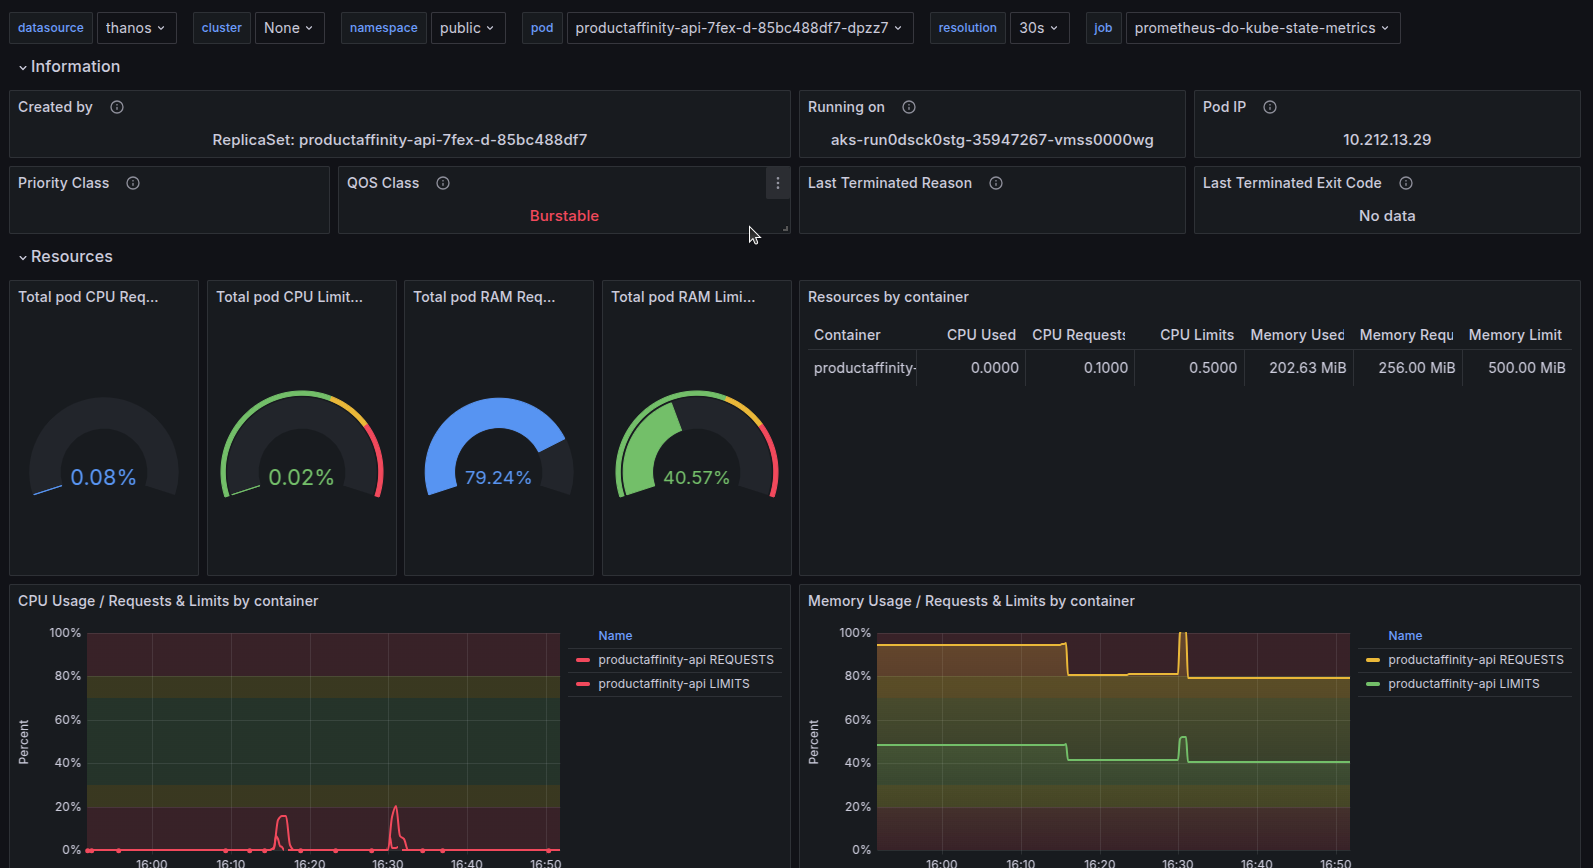
After checking the Pods checkbox, the dashboard page will load. Configure the Kubernetes source and namespace settings to monitor the desired pod. The configuration should be as follows:
- Datasource: thanos
- Cluster: None
- Namespace: Enter the name of the workspace where the Lens is deployed (e.g.,
public,curriculum,sandbox). - Pod: Search for the name of the Lens pod. Pod names start with the Lens name itself. For example, if the Lens name is
productaffinity, the pod name will also begin with productaffinity. The Lens deployment includes services such as api, router, and worker. For example, to monitor the api service of the Lensproductaffinity, selectproductaffinity-apifrom the pod name search box.
With the above configuration, the setup will look like this:

After completing the configuration, the monitoring dashboard will appear as follows: