Monitor
The Monitor Resource is an integral part of DataOS Observability system, designed to trigger incidents based on specific events or metrics. By leveraging the Monitor Resource alongside the Pager Resource for sending alerts, DataOS users can achieve comprehensive observability and proactive incident management, ensuring high system reliability and performance. To understand the key concepts associated with a Monitor, refer to the following link: Core Concepts.
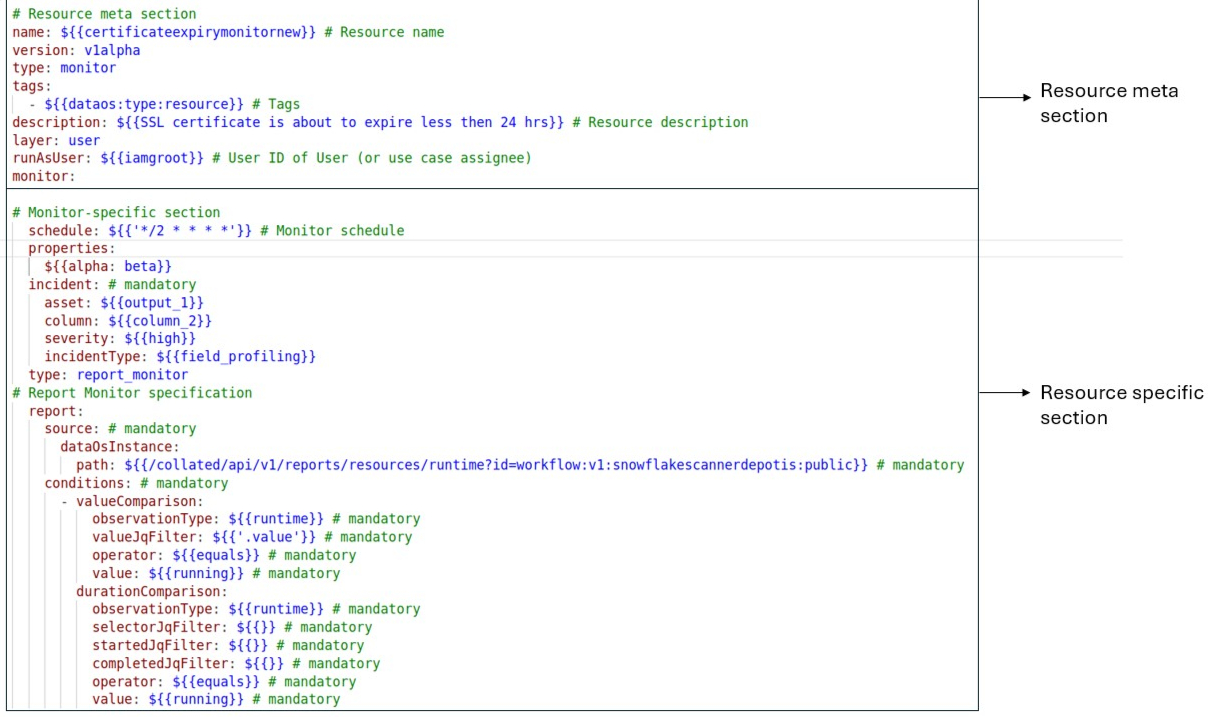
Structure of Monitor manifest
To know more about the attributes of Monitor manifest Configuration, refer to the link: Attributes of Monitor manifest.
Steps to create a Monitor
To create a Monitor Resource in DataOS, you need to define a manifest file that specifies the Monitor's configuration, including its name, version, type, and specific monitoring parameters. The manifest file should follow the structure outlined above. Once the manifest is ready, you can apply it using the DataOS CLI. Follow the links given in the below sections to create a specific type of Monitor Resource.
Report Monitor
A Report Monitor in DataOS is a type of Monitor Resource that evaluates report data at scheduled intervals and automatically generates incidents when specified conditions are met. It is used to track the status and runtime of Workflows, Services, Workers or other Resources, enabling automated alerting and incident management based on report outcomes. To create a Report Monitor, please refer to this link.
Equation Monitor
An Equation Monitor in DataOS is a Monitor Resource that lets you define and evaluate logical expressions over data sources at scheduled intervals. It is used when you need to monitor complex conditions, such as comparing metrics, checking thresholds, or combining multiple data points beyond simple value checks. When the specified equation's condition is met, the Equation Monitor automatically generates an incident, enabling proactive alerting and response. To create an Equation Monitor, please refer to this link.
Configurations
Monitors can be configured to autoscale and match varying workload demands, reference pre-defined Secrets and Volumes, and more. The specific configurations may vary depending on the use case. For a detailed breakdown of the configuration options and attributes, please refer to the documentation: Attributes of Monitor manifest.
Recipes
This section provides practical examples for creating and configuring different types of Monitor Resources in DataOS. These recipes are designed to help you quickly implement common monitoring scenarios. Follow the below links:
- Add context columns to Monitors
- Create an Equation Monitor on Lens
- Create an Equation Monitor on Postgres
- Generate incidents for certificate expiration
Use case
This section outlines real-world scenario where Monitor Resources can be effectively applied within DataOS. Please refer to this link for the use case.
Best Practices
When creating a Monitor, it is essential to follow best practices to ensure effective monitoring and incident management. Please refer to this link for best practices.
FAQs
1. What happens if the metric I want to monitor doesn’t exist in Prometheus?
The Monitor will fail to evaluate the condition. Always confirm the metric exists and the query returns results before applying the monitor.
2. What happens if my Monitor logic is correct but the condition is not met at the moment of validation?
The condition will show as yellow during validation, indicating it’s valid but not currently true. This is expected for conditions triggered only during anomalies.
3. What happens if I point the Monitor to a topic or endpoint that is not producing data?
The Monitor will continue polling or waiting for messages but will not trigger any incidents until data arrives. Ensure that your source is active and producing the expected event structure.