How to observe a Lakesearch Service?
A user can observe the health status, operational metrics, runtime, and status of a Lakesearch Service.
Operational metrics
To get the details of operational metrics of a Lakesearch Service execute the below curl command using DataOS CLI. A user can create a bearer token in the profile section of the DataOS home page.
Expected output
# HELP batch_document_processed_count Number of documents created in a batch
# TYPE batch_document_processed_count gauge
batch_document_processed_count{app_name="lakesearch",index="city",job="service:v1:testingls:public",service="public:testingls"} 0
# HELP batch_processing_time_seconds Time taken to complete a batch in seconds
# TYPE batch_processing_time_seconds histogram
batch_processing_time_seconds_bucket{app_name="lakesearch",index="city",job="service:v1:testingls:public",service="public:testingls",le="0.1"} 0
batch_processing_time_seconds_bucket{app_name="lakesearch",index="city",job="service:v1:testingls:public",service="public:testingls",le="0.2"} 0
batch_processing_time_seconds_bucket{app_name="lakesearch",index="city",job="service:v1:testingls:public",service="public:testingls",le="0.4"} 0
batch_processing_time_seconds_bucket{app_name="lakesearch",index="city",job="service:v1:testingls:public",service="public:testingls",le="0.8"} 7
batch_processing_time_seconds_bucket{app_name="lakesearch",index="city",job="service:v1:testingls:public",service="public:testingls",le="1.6"} 7
batch_processing_time_seconds_bucket{app_name="lakesearch",index="city",job="service:v1:testingls:public",service="public:testingls",le="3.2"} 7
batch_processing_time_seconds_bucket{app_name="lakesearch",index="city",job="service:v1:testingls:public",service="public:testingls",le="6.4"} 7
batch_processing_time_seconds_bucket{app_name="lakesearch",index="city",job="service:v1:testingls:public",service="public:testingls",le="12.8"} 7
batch_processing_time_seconds_bucket{app_name="lakesearch",index="city",job="service:v1:testingls:public",service="public:testingls",le="25.6"} 7
batch_processing_time_seconds_bucket{app_name="lakesearch",index="city",job="service:v1:testingls:public",service="public:testingls",le="51.2"} 7
batch_processing_time_seconds_bucket{app_name="lakesearch",index="city",job="service:v1:testingls:public",service="public:testingls",le="+Inf"} 7
batch_processing_time_seconds_sum{app_name="lakesearch",index="city",job="service:v1:testingls:public",service="public:testingls"} 3.212332902
batch_processing_time_seconds_count{app_name="lakesearch",index="city",job="service:v1:testingls:public",service="public:testingls"} 7
# HELP disk_memory_occupied Total Disk Memory in bytes occupied by Index
# TYPE disk_memory_occupied gauge
disk_memory_occupied{app_name="lakesearch",index="city",job="service:v1:testingls:public",service="public:testingls"} 5.544787e+06
# HELP document_index_count Total number of documents indexed for every index
# TYPE document_index_count gauge
document_index_count{app_name="lakesearch",index="city",job="service:v1:testingls:public",service="public:testingls"} 39012
# HELP go_gc_duration_seconds A summary of the pause duration of garbage collection cycles.
# TYPE go_gc_duration_seconds summary
go_gc_duration_seconds{quantile="0"} 4.4822e-05
go_gc_duration_seconds{quantile="0.25"} 6.6362e-05
go_gc_duration_seconds{quantile="0.5"} 9.6813e-05
go_gc_duration_seconds{quantile="0.75"} 0.000109362
go_gc_duration_seconds{quantile="1"} 0.000128173
go_gc_duration_seconds_sum 0.000536894
go_gc_duration_seconds_count 6
# HELP go_goroutines Number of goroutines that currently exist.
# TYPE go_goroutines gauge
go_goroutines 49
# HELP go_info Information about the Go environment.
# TYPE go_info gauge
go_info{version="go1.23.5"} 1
# HELP go_memstats_alloc_bytes Number of bytes allocated and still in use.
# TYPE go_memstats_alloc_bytes gauge
go_memstats_alloc_bytes 7.784688e+06
# HELP go_memstats_alloc_bytes_total Total number of bytes allocated, even if freed.
# TYPE go_memstats_alloc_bytes_total counter
go_memstats_alloc_bytes_total 1.795444e+07
# HELP go_memstats_buck_hash_sys_bytes Number of bytes used by the profiling bucket hash table.
# TYPE go_memstats_buck_hash_sys_bytes gauge
go_memstats_buck_hash_sys_bytes 1.451413e+06
# HELP go_memstats_frees_total Total number of frees.
# TYPE go_memstats_frees_total counter
go_memstats_frees_total 64392
# HELP go_memstats_gc_sys_bytes Number of bytes used for garbage collection system metadata.
# TYPE go_memstats_gc_sys_bytes gauge
go_memstats_gc_sys_bytes 3.340048e+06
# HELP go_memstats_heap_alloc_bytes Number of heap bytes allocated and still in use.
# TYPE go_memstats_heap_alloc_bytes gauge
go_memstats_heap_alloc_bytes 7.784688e+06
# HELP go_memstats_heap_idle_bytes Number of heap bytes waiting to be used.
# TYPE go_memstats_heap_idle_bytes gauge
go_memstats_heap_idle_bytes 4.83328e+06
# HELP go_memstats_heap_inuse_bytes Number of heap bytes that are in use.
# TYPE go_memstats_heap_inuse_bytes gauge
go_memstats_heap_inuse_bytes 1.0862592e+07
# HELP go_memstats_heap_objects Number of allocated objects.
# TYPE go_memstats_heap_objects gauge
go_memstats_heap_objects 16987
# HELP go_memstats_heap_released_bytes Number of heap bytes released to OS.
# TYPE go_memstats_heap_released_bytes gauge
go_memstats_heap_released_bytes 2.392064e+06
# HELP go_memstats_heap_sys_bytes Number of heap bytes obtained from system.
# TYPE go_memstats_heap_sys_bytes gauge
go_memstats_heap_sys_bytes 1.5695872e+07
# HELP go_memstats_last_gc_time_seconds Number of seconds since 1970 of last garbage collection.
# TYPE go_memstats_last_gc_time_seconds gauge
go_memstats_last_gc_time_seconds 1.7400587200703754e+09
# HELP go_memstats_lookups_total Total number of pointer lookups.
# TYPE go_memstats_lookups_total counter
go_memstats_lookups_total 0
# HELP go_memstats_mallocs_total Total number of mallocs.
# TYPE go_memstats_mallocs_total counter
go_memstats_mallocs_total 81379
# HELP go_memstats_mcache_inuse_bytes Number of bytes in use by mcache structures.
# TYPE go_memstats_mcache_inuse_bytes gauge
go_memstats_mcache_inuse_bytes 9600
# HELP go_memstats_mcache_sys_bytes Number of bytes used for mcache structures obtained from system.
# TYPE go_memstats_mcache_sys_bytes gauge
go_memstats_mcache_sys_bytes 15600
# HELP go_memstats_mspan_inuse_bytes Number of bytes in use by mspan structures.
# TYPE go_memstats_mspan_inuse_bytes gauge
go_memstats_mspan_inuse_bytes 169600
# HELP go_memstats_mspan_sys_bytes Number of bytes used for mspan structures obtained from system.
# TYPE go_memstats_mspan_sys_bytes gauge
go_memstats_mspan_sys_bytes 195840
# HELP go_memstats_next_gc_bytes Number of heap bytes when next garbage collection will take place.
# TYPE go_memstats_next_gc_bytes gauge
go_memstats_next_gc_bytes 1.3605928e+07
# HELP go_memstats_other_sys_bytes Number of bytes used for other system allocations.
# TYPE go_memstats_other_sys_bytes gauge
go_memstats_other_sys_bytes 1.965683e+06
# HELP go_memstats_stack_inuse_bytes Number of bytes in use by the stack allocator.
# TYPE go_memstats_stack_inuse_bytes gauge
go_memstats_stack_inuse_bytes 1.015808e+06
# HELP go_memstats_stack_sys_bytes Number of bytes obtained from system for stack allocator.
# TYPE go_memstats_stack_sys_bytes gauge
go_memstats_stack_sys_bytes 1.015808e+06
# HELP go_memstats_sys_bytes Number of bytes obtained from system.
# TYPE go_memstats_sys_bytes gauge
go_memstats_sys_bytes 2.3680264e+07
# HELP go_threads Number of OS threads created.
# TYPE go_threads gauge
go_threads 15
# HELP lakesearch_request_duration_seconds The HTTP request latencies in seconds.
# TYPE lakesearch_request_duration_seconds histogram
lakesearch_request_duration_seconds_bucket{code="200",method="GET",url="/lakesearch/public:testingls/api/v2/index/city/suggestions",le="0.005"} 0
lakesearch_request_duration_seconds_bucket{code="200",method="GET",url="/lakesearch/public:testingls/api/v2/index/city/suggestions",le="0.01"} 0
lakesearch_request_duration_seconds_bucket{code="200",method="GET",url="/lakesearch/public:testingls/api/v2/index/city/suggestions",le="0.025"} 0
lakesearch_request_duration_seconds_bucket{code="200",method="GET",url="/lakesearch/public:testingls/api/v2/index/city/suggestions",le="0.05"} 1
lakesearch_request_duration_seconds_bucket{code="200",method="GET",url="/lakesearch/public:testingls/api/v2/index/city/suggestions",le="0.1"} 1
lakesearch_request_duration_seconds_bucket{code="200",method="GET",url="/lakesearch/public:testingls/api/v2/index/city/suggestions",le="0.25"} 1
lakesearch_request_duration_seconds_bucket{code="200",method="GET",url="/lakesearch/public:testingls/api/v2/index/city/suggestions",le="0.5"} 1
lakesearch_request_duration_seconds_bucket{code="200",method="GET",url="/lakesearch/public:testingls/api/v2/index/city/suggestions",le="1"} 1
lakesearch_request_duration_seconds_bucket{code="200",method="GET",url="/lakesearch/public:testingls/api/v2/index/city/suggestions",le="2.5"} 1
lakesearch_request_duration_seconds_bucket{code="200",method="GET",url="/lakesearch/public:testingls/api/v2/index/city/suggestions",le="5"} 1
lakesearch_request_duration_seconds_bucket{code="200",method="GET",url="/lakesearch/public:testingls/api/v2/index/city/suggestions",le="10"} 1
lakesearch_request_duration_seconds_bucket{code="200",method="GET",url="/lakesearch/public:testingls/api/v2/index/city/suggestions",le="+Inf"} 1
lakesearch_request_duration_seconds_sum{code="200",method="GET",url="/lakesearch/public:testingls/api/v2/index/city/suggestions"} 0.04214034
lakesearch_request_duration_seconds_count{code="200",method="GET",url="/lakesearch/public:testingls/api/v2/index/city/suggestions"} 1
# HELP lakesearch_request_size_bytes The HTTP request sizes in bytes.
# TYPE lakesearch_request_size_bytes summary
lakesearch_request_size_bytes_sum 914
lakesearch_request_size_bytes_count 1
# HELP lakesearch_requests_total How many HTTP requests processed, partitioned by status code and HTTP method.
# TYPE lakesearch_requests_total counter
lakesearch_requests_total{code="200",handler="bitbucket.org/rubik_/lakesearch/pkg/handlers.Suggestions",host="unique-haddock.dataos.app",method="GET",url="/lakesearch/public:testingls/api/v2/index/city/suggestions"} 1
# HELP lakesearch_response_size_bytes The HTTP response sizes in bytes.
# TYPE lakesearch_response_size_bytes summary
lakesearch_response_size_bytes_sum 113
lakesearch_response_size_bytes_count 1
# HELP process_cpu_seconds_total Total user and system CPU time spent in seconds.
# TYPE process_cpu_seconds_total counter
process_cpu_seconds_total 1.62
# HELP process_max_fds Maximum number of open file descriptors.
# TYPE process_max_fds gauge
process_max_fds 1.048576e+06
# HELP process_open_fds Number of open file descriptors.
# TYPE process_open_fds gauge
process_open_fds 20
# HELP process_resident_memory_bytes Resident memory size in bytes.
# TYPE process_resident_memory_bytes gauge
process_resident_memory_bytes 1.20680448e+08
# HELP process_start_time_seconds Start time of the process since unix epoch in seconds.
# TYPE process_start_time_seconds gauge
process_start_time_seconds 1.74005863362e+09
# HELP process_virtual_memory_bytes Virtual memory size in bytes.
# TYPE process_virtual_memory_bytes gauge
process_virtual_memory_bytes 3.116212224e+09
# HELP process_virtual_memory_max_bytes Maximum amount of virtual memory available in bytes.
# TYPE process_virtual_memory_max_bytes gauge
process_virtual_memory_max_bytes 1.8446744073709552e+19
# HELP promhttp_metric_handler_requests_in_flight Current number of scrapes being served.
# TYPE promhttp_metric_handler_requests_in_flight gauge
promhttp_metric_handler_requests_in_flight 1
# HELP promhttp_metric_handler_requests_total Total number of scrapes by HTTP status code.
# TYPE promhttp_metric_handler_requests_total counter
promhttp_metric_handler_requests_total{code="200"} 9
promhttp_metric_handler_requests_total{code="500"} 0
promhttp_metric_handler_requests_total{code="503"} 0
# HELP ram_memory_occupied Total Ram Memory in bytes occupied by Index
# TYPE ram_memory_occupied gauge
ram_memory_occupied{app_name="lakesearch",index="city",job="service:v1:testingls:public",service="public:testingls"} 6.465189e+06
# HELP suggestion_search_duration_seconds Histogram of suggestion search durations in seconds
# TYPE suggestion_search_duration_seconds histogram
suggestion_search_duration_seconds_bucket{app_name="lakesearch",index="city",job="service:v1:testingls:public",service="public:testingls",user="shraddhaade",le="0.005"} 1
suggestion_search_duration_seconds_bucket{app_name="lakesearch",index="city",job="service:v1:testingls:public",service="public:testingls",user="shraddhaade",le="0.01"} 1
suggestion_search_duration_seconds_bucket{app_name="lakesearch",index="city",job="service:v1:testingls:public",service="public:testingls",user="shraddhaade",le="0.025"} 1
suggestion_search_duration_seconds_bucket{app_name="lakesearch",index="city",job="service:v1:testingls:public",service="public:testingls",user="shraddhaade",le="0.05"} 1
suggestion_search_duration_seconds_bucket{app_name="lakesearch",index="city",job="service:v1:testingls:public",service="public:testingls",user="shraddhaade",le="0.1"} 1
suggestion_search_duration_seconds_bucket{app_name="lakesearch",index="city",job="service:v1:testingls:public",service="public:testingls",user="shraddhaade",le="0.25"} 1
suggestion_search_duration_seconds_bucket{app_name="lakesearch",index="city",job="service:v1:testingls:public",service="public:testingls",user="shraddhaade",le="0.5"} 1
suggestion_search_duration_seconds_bucket{app_name="lakesearch",index="city",job="service:v1:testingls:public",service="public:testingls",user="shraddhaade",le="1"} 1
suggestion_search_duration_seconds_bucket{app_name="lakesearch",index="city",job="service:v1:testingls:public",service="public:testingls",user="shraddhaade",le="2.5"} 1
suggestion_search_duration_seconds_bucket{app_name="lakesearch",index="city",job="service:v1:testingls:public",service="public:testingls",user="shraddhaade",le="5"} 1
suggestion_search_duration_seconds_bucket{app_name="lakesearch",index="city",job="service:v1:testingls:public",service="public:testingls",user="shraddhaade",le="10"} 1
suggestion_search_duration_seconds_bucket{app_name="lakesearch",index="city",job="service:v1:testingls:public",service="public:testingls",user="shraddhaade",le="+Inf"} 1
suggestion_search_duration_seconds_sum{app_name="lakesearch",index="city",job="service:v1:testingls:public",service="public:testingls",user="shraddhaade"} 0.000772099
suggestion_search_duration_seconds_count{app_name="lakesearch",index="city",job="service:v1:testingls:public",service="public:testingls",user="shraddhaade"} 1
Users can access relevant data points at the /metrics endpoint to calculate all the metrics listed below. These metrics are also available in Grafana.
| Metric | What? | Persona | Why? |
|---|---|---|---|
| Indexing Throughput (Documents Indexed per Second) | Number of documents indexed per second, tracked over time and per batch. | Developer | Helps estimate the time required to index large datasets and identify potential bottlenecks in the Indexer pipeline. |
| Indexing Latency (Time per Batch) | Average and maximum time taken to index each batch, broken down by batch size and type. | Developer | Identifies slowdowns in specific batches, helping to address issues such as data complexity or resource contention. |
| Query Throughput (Queries per Second) | Number of queries processed over a time period (eg. last 5 mins), with peaks and trends over time, including average response time for the last 100, 500, and 1000 requests. | Developer, Consumer | Indicates the Searcher's capacity to handle user requests, helping maintain performance during peak usage and identify bottlenecks. Also provides insights into usage patterns and peak load times. |
| Storage Usage | Total storage used per index, tracked over time, with breakdowns by individual indices and alerts for thresholds nearing capacity limits. | Developer, Operator | Ensures adequate storage for indexed data, helps plan capacity and resource scaling, and prevents disruptions due to storage exhaustion. |
| Resource Utilization (CPU, Memory, Disk I/O) | CPU, memory, and disk I/O usage for both Indexer and Searcher, with alerts for thresholds approaching critical levels. | Developer, Operator | Ensures optimal resource usage to maintain service performance, helping to avoid slow indexing or query processing times due to resource overutilization. |
Health status
Users can observe the health status of a Lakesearch Service by executing the below curl command using the /healthz endpoint.
curl -X GET "https://unique-haddock.dataos.app/lakesearch/public:testingls/healthz" \
-H "Authorization: Bearer dG9rZW5fZGlzdG3RseV9tYWlubHlfdXBfcmF5LjU1ZmE1ZWQyLWUwNDgtNGI3Yi1hNGQ2LWNlNjA1YTAzZTE4YQ=="
Expected output:
If the Service is healthy, the response returns { "status": "ok" }, indicating that the system is functioning as expected.
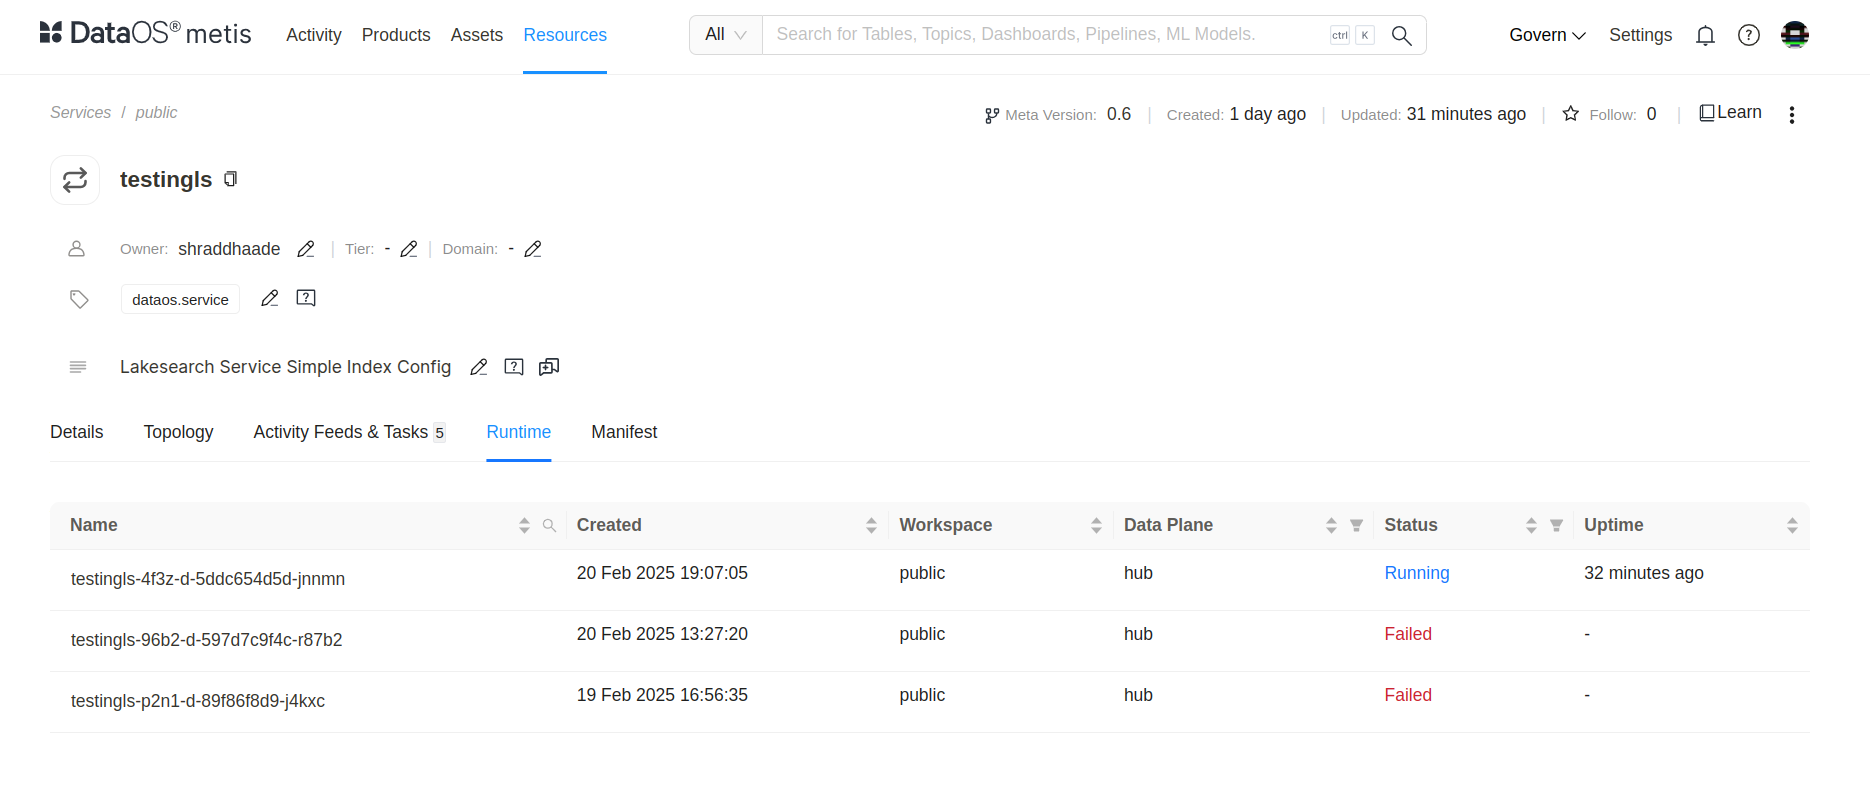
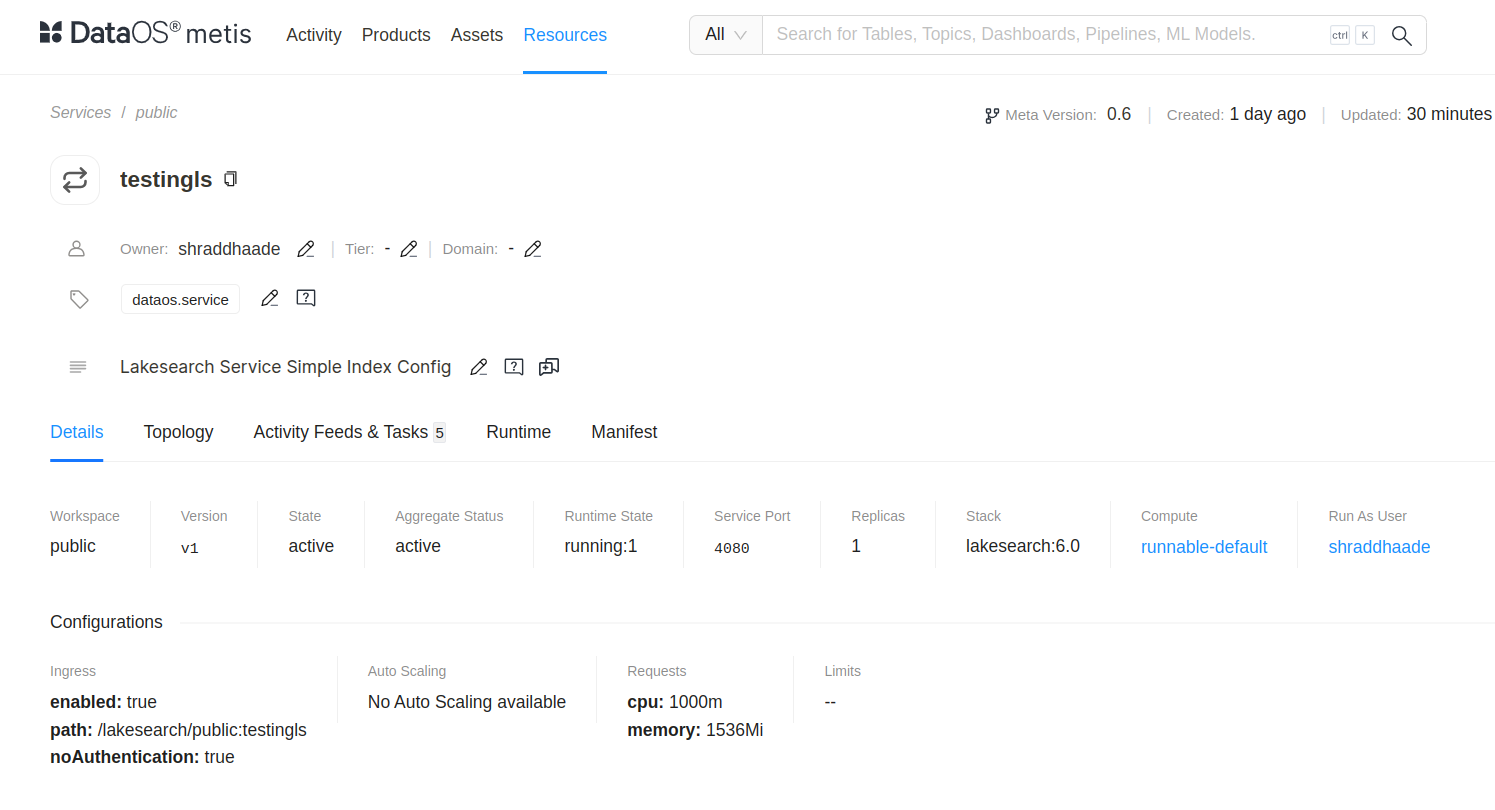
Runtime and status
Users can observe the runtime and status of a Lakesearch Service either by DataOS CLI or by Metis UI.
-
To check the runtime and status of a Lakesearch Service execute the below command in CLI.
Expected output:
-
To check the runtime and status through Metis UI, simply navigate to
Metis UI -> Resources -> Service -> Lakesearch -> service-nameor simply search Lakesearch Service by name on the search bar and click on the Service that needs to be observed.
Get alerts!
The Monitor Resource allows users to define conditions for receiving alerts, such as when a Service runtime enters a pending or failed state, or when a Service is deleted without the creator's prior knowledge. The Pager Resource enables users to configure alert destinations, such as a Teams channel webhook URL or email, and define the structure of the alert message that will be sent.
Get alerts when runtime enters the pending state
Follow the below steps to create a Monitor Resource.
-
Create a manifest file for Monitor Resource.
To get to know more about the Monitor Resource, please refer to this link.name: lsruntime version: v1alpha type: monitor tags: - dataos:type:resource - dataos:layer:user description: Attention! instance secret is active layer: user monitor: # Monitor-specific section schedule: '*/2 * * * *' incident: name: lsruntime severity: high incidentType: lsruntime type: report_monitor # Report Monitor specification report: source: dataOsInstance: path: /collated/api/v1/reports/resources/runtime?id=service:v1:testingls:public conditions: - valueComparison: observationType: runtime valueJqFilter: '.value' operator: equals value: pending:0/1 -
Apply the Monitor Resource manifest file by executing the below command.
Expected output:
-
Verify the Monitor
Expected output:
INFO[0000] 🔍 get... INFO[0000] 🔍 get...complete NAME | VERSION | TYPE | WORKSPACE | STATUS | RUNTIME | OWNER ------------|---------|---------|-----------|--------|--------------------------------|-------------- lsruntime | v1alpha | monitor | public | active | next:2025-02-21T13:26:00+05:30 | iamgroot -
Get the Runtime status of the Monitor by executing the below command.
Expected output when the condition met:
INFO[0000] 🔍 monitor...
INFO[0000] 🔍 monitor...complete

    NAME    | VERSION |  TYPE   | WORKSPACE |    OWNER
------------|---------|---------|-----------|--------------
  lsruntime | v1alpha | monitor | public    | iamgroot

  STATUS |            RUNTIME
---------|---------------------------------
  active | next:2025-02-21T13:34:00+05:30

     RUN ID    |          STARTED          |         FINISHED          | RUN STATUS |                                                           RESULT
---------------|---------------------------|---------------------------|------------|------------------------------------------------------------------------------------------------------------------------------
  edpqcadgewhs | 2025-02-21T13:32:00+05:30 | 2025-02-21T13:32:00+05:30 | completed  | 🟩 monitor condition met for monitor: 'lsruntime_public', 'service:v1:testingls:public', created incident id 'edpqcavhoidc'
---------------|---------------------------|---------------------------|------------|------------------------------------------------------------------------------------------------------------------------------
Expected output when the condition does not met:
INFO[0000] 🔍 monitor... INFO[0000] 🔍 monitor...complete NAME | VERSION | TYPE | WORKSPACE | OWNER ------------|---------|---------|-----------|-------------- lsruntime | v1alpha | monitor | public | iamgroot STATUS | RUNTIME ---------|--------------------------------- active | next:2025-02-21T13:42:00+05:30 RUN ID | STARTED | FINISHED | RUN STATUS | RESULT ---------------|---------------------------|---------------------------|------------|--------------------------------------------------------------- edpr1ynou39g | 2025-02-21T13:40:00+05:30 | 2025-02-21T13:40:00+05:30 | completed | 🟧 monitor condition not met for monitor: 'lsruntime_public' ---------------|---------------------------|---------------------------|------------|--------------------------------------------------------------- -
Create a manifest file for Pager Resource.
name: lspager version: v1alpha type: pager tags: - dataos:type:resource - workflow-failed-pager description: This is for sending Alerts on Microsoft Teams Channel. workspace: public pager: conditions: - valueJqFilter: .properties.name operator: equals value: lsstatus output: webHook: url: https://rubikdatasolutions.webhook.office.com/webhookb2/c61e1080-682a-42c7-a101-d6beffddf3a0@2e22bdde-3ec2-43f5-bf92-78e9f35a44fb/IncomingWebhook/51c946a746194eb4bc6fbf2a3b8c596f/631bd149-c89d-4d3b-8979-8e364f62b419/V2xdnn_SUVifx59MMXbx8IIIwTtial5HdBE3Szv-Zjyuw1 verb: post headers: 'content-type': 'application/json' bodyTemplate: | { "@type": "MessageCard", "summary": "Lakesearch Service is pending", "themeColor": "0076D7", "sections": [ { "activityTitle": "Dear Team,", "activitySubtitle": "Our system detected that your Service's runtime changed to pending state.", "facts": [ { "name": "The following Lakesearch Service is deleted:", "value": "{{ index (splitn ":" 4 .ReportContext.ResourceId) "_2" }}" }, { "name": "Failure Time:", "value": "{{ .CreateTime }}" }, { "name": "Severity:", "value": "{{ .Properties.severity }}" }, { "name": "Run Details:", "value": "<a href=\"https://${dataos-fqdn}/operations/user-space/resources/resource-runtime?name={{ index (splitn ":" 4 .ReportContext.ResourceId) "_2" }}&type=service\">Operation</a>" } ] }, { "title": "Disclaimer", "text": "{{ .Monitor.Description }}" } ] } -
Apply the Pager Resource manifest file by executing the below command.
Expected output:
-
Validate the Pager.
Expected output:
-
Check the Teams channel for an alert.
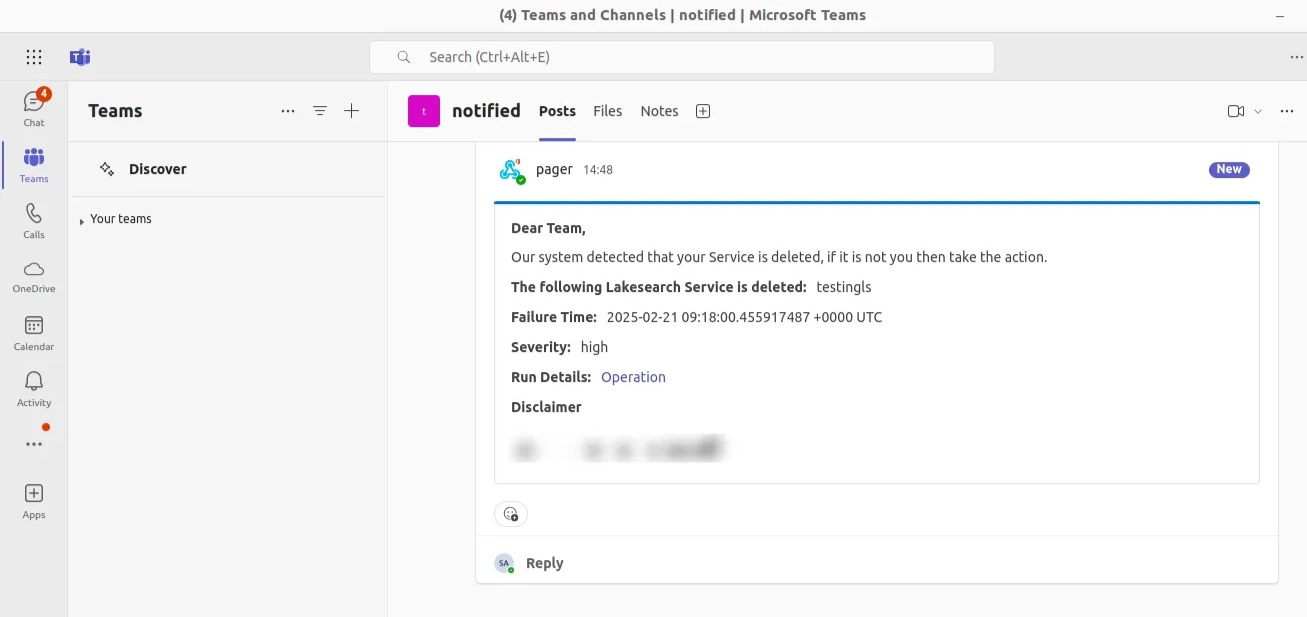
Get alerts when Service status enters the deleted state
Follow the below steps to create a Monitor Resource.
-
Create a manifest file for Monitor Resource.
name: lsmonitor version: v1alpha type: monitor tags: - dataos:type:resource - dataos:layer:user description: Attention! instance secret is active layer: user monitor: # Monitor-specific section schedule: '*/2 * * * *' incident: name: lsstatus severity: high incidentType: lsstatus type: report_monitor # Report Monitor specification report: source: dataOsInstance: path: /collated/api/v1/reports/resources/status?id=service:v1:testingls:public conditions: - valueComparison: observationType: status valueJqFilter: '.value' operator: equals value: deleted -
Apply the Monitor Resource manifest file by executing the below command.
Expected output:
-
Verify the Monitor
Expected output:
INFO[0000] 🔍 get... INFO[0000] 🔍 get...complete NAME | VERSION | TYPE | WORKSPACE | STATUS | RUNTIME | OWNER ------------|---------|---------|-----------|--------|--------------------------------|-------------- lsmonitor | v1alpha | monitor | public | active | next:2025-02-21T13:26:00+05:30 | iamgroot -
Get the runtime status of the Monitor by executing the below command.
Expected output when the condition met:
INFO[0000] 🔍 monitor...
INFO[0000] 🔍 monitor...complete

    NAME    | VERSION |  TYPE   | WORKSPACE |    OWNER
------------|---------|---------|-----------|--------------
  lsmonitor | v1alpha | monitor | public    | iamgroot

  STATUS |            RUNTIME
---------|---------------------------------
  active | next:2025-02-21T13:34:00+05:30

     RUN ID    |          STARTED          |         FINISHED          | RUN STATUS |                                                           RESULT
---------------|---------------------------|---------------------------|------------|------------------------------------------------------------------------------------------------------------------------------
  edpqcadgewhs | 2025-02-21T13:32:00+05:30 | 2025-02-21T13:32:00+05:30 | completed  | 🟩 monitor condition met for monitor: 'lsmonitor_public', 'service:v1:testingls:public', created incident id 'edpqcavhoidc'
---------------|---------------------------|---------------------------|------------|------------------------------------------------------------------------------------------------------------------------------
Expected output when the condition does not met:
INFO[0000] 🔍 monitor... INFO[0000] 🔍 monitor...complete NAME | VERSION | TYPE | WORKSPACE | OWNER ------------|---------|---------|-----------|-------------- lsmonitor | v1alpha | monitor | public | iamgroot STATUS | RUNTIME ---------|--------------------------------- active | next:2025-02-21T13:42:00+05:30 RUN ID | STARTED | FINISHED | RUN STATUS | RESULT ---------------|---------------------------|---------------------------|------------|--------------------------------------------------------------- edpr1ynou39g | 2025-02-21T13:40:00+05:30 | 2025-02-21T13:40:00+05:30 | completed | 🟧 monitor condition not met for monitor: 'lsmonitor_public' ---------------|---------------------------|---------------------------|------------|--------------------------------------------------------------- -
Create a manifest file for Pager Resource.
name: lspager version: v1alpha type: pager tags: - dataos:type:resource - workflow-failed-pager description: This is for sending Alerts on Microsoft Teams Channel. workspace: public pager: conditions: - valueJqFilter: .properties.name operator: equals value: lsstatus output: webHook: url: https://rubikdatasolutions.webhook.office.com/webhookb2/c61e1080-682a-42c7-a101-d6beffddf3a0@2e22bdde-3ec2-43f5-bf92-78e9f35a44fb/IncomingWebhook/51c946a746194eb4bc6fbf2a3b8c596f/631bd149-c89d-4d3b-8979-8e364f62b419/V2xdnn_SUVifx59MMXbx8IIIwTtiaq8HdBE3Szv-Zjyuw1 verb: post headers: 'content-type': 'application/json' bodyTemplate: | { "@type": "MessageCard", "summary": "Lakesearch Service is deleted", "themeColor": "0076D7", "sections": [ { "activityTitle": "Dear Team,", "activitySubtitle": "Our system detected that your Service is deleted, if it is not you then take the action.", "facts": [ { "name": "The following Lakesearch Service is deleted:", "value": "{{ index (splitn ":" 4 .ReportContext.ResourceId) "_2" }}" }, { "name": "Failure Time:", "value": "{{ .CreateTime }}" }, { "name": "Severity:", "value": "{{ .Properties.severity }}" }, { "name": "Run Details:", "value": "<a href=\"https://${dataos-fqdn}/operations/user-space/resources/resource-runtime?name={{ index (splitn ":" 4 .ReportContext.ResourceId) "_2" }}&type=service\">Operation</a>" } ] }, { "title": "Disclaimer", "text": "{{ .Monitor.Description }}" } ] } -
Apply the Pager Resource manifest file by executing the below command.
Expected output:
-
Validate the Pager.
Expected output:
-
Check the Teams channel for an alert.