Using Lens (Lens 1.0)
Information
Lens is a powerful tool within DataOS that allows you to explore and analyze your data with ease. Follow this comprehensive guide to learn how to make the most out of Lens.
Let's consider an example in the context of a retail company to analyze customer data to optimize its product offerings and marketing strategies.
We will use one example Lens Sportsdata for the scenario to gain insights into the most frequent orders for a specific brand, understand the product category share order by year and conduct date-wise order analysis. We also want to analyze customer dissatisfaction and issues with product quality and services, so we will need records of purchased item returns.
Before you start exploring Lens to find answers to your queries, let us quickly understand the key data elements used throughout this guide.
Entities: Fundamental business concepts analyzed in data, such as Retailer, Order, and Product. They are the subjects or actors in the data.
Fields: Data elements within entities, like retailer_id or product_id, providing specific information. They are columns that uniquely identify an entity.
Dimensions: Categorical attributes contextualizing measures, like order_date or product_category, for varied analysis.
Measures: Quantitative values for analysis, such as total_sales or average_customer_age, derived from fields and dimensions.
Relationships: Connections between entities, simplifying queries across multiple data sets through defined associations.
To learn more about these data elements, refer to the following link: Building Lens - All things DataOS
Let's start with Lens. By following these steps, you can effectively utilize Lens to explore and analyze your data, gaining valuable insights for informed decision-making.
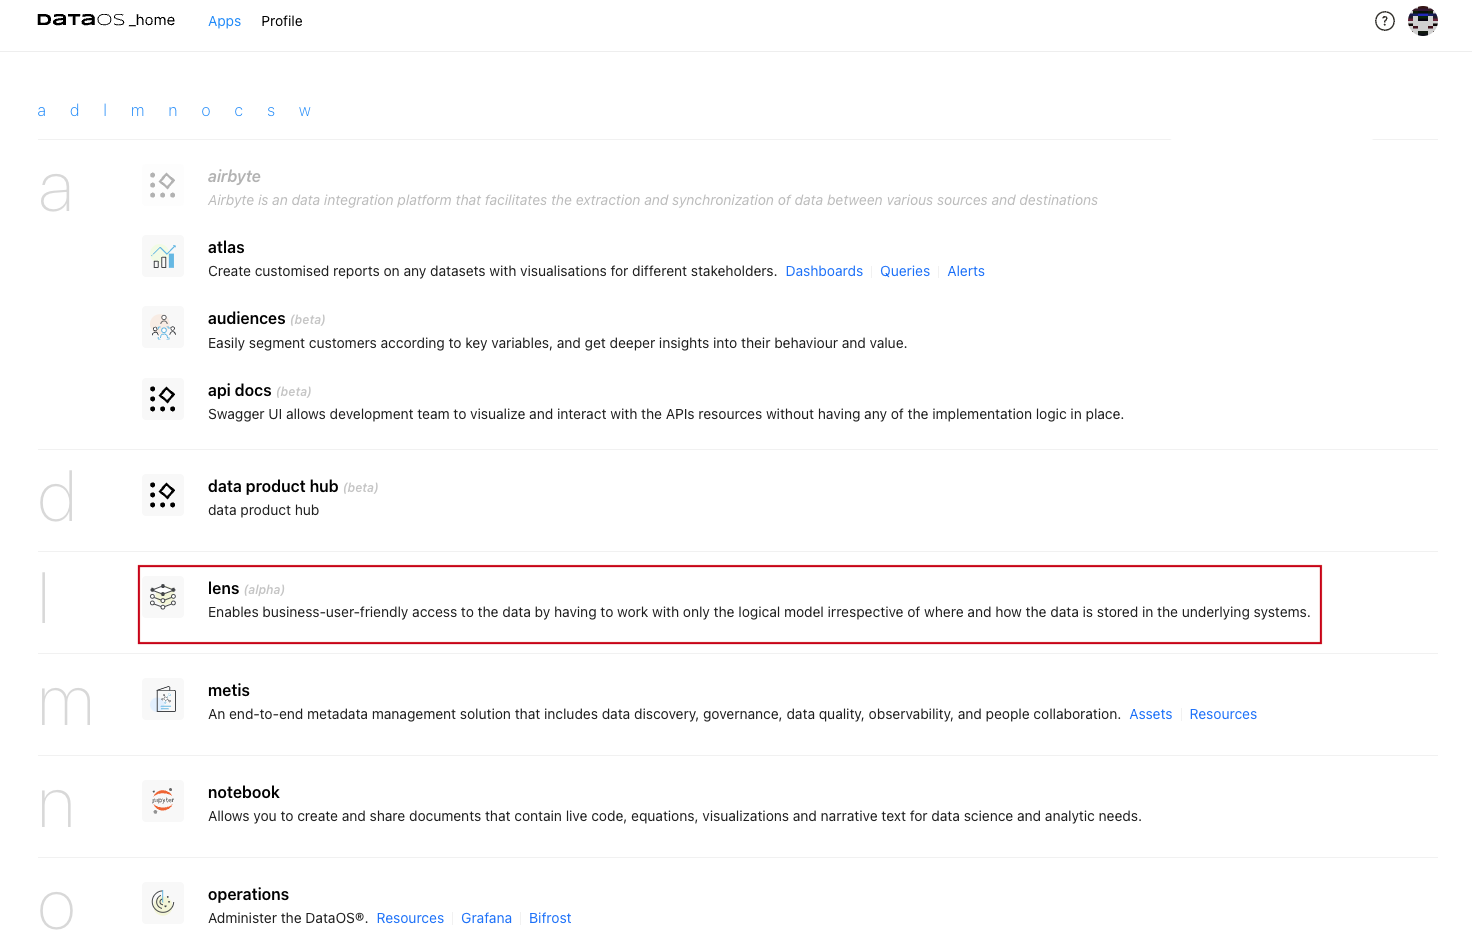
Locating and Selecting Lens
- Access the Lens application within DataOS.
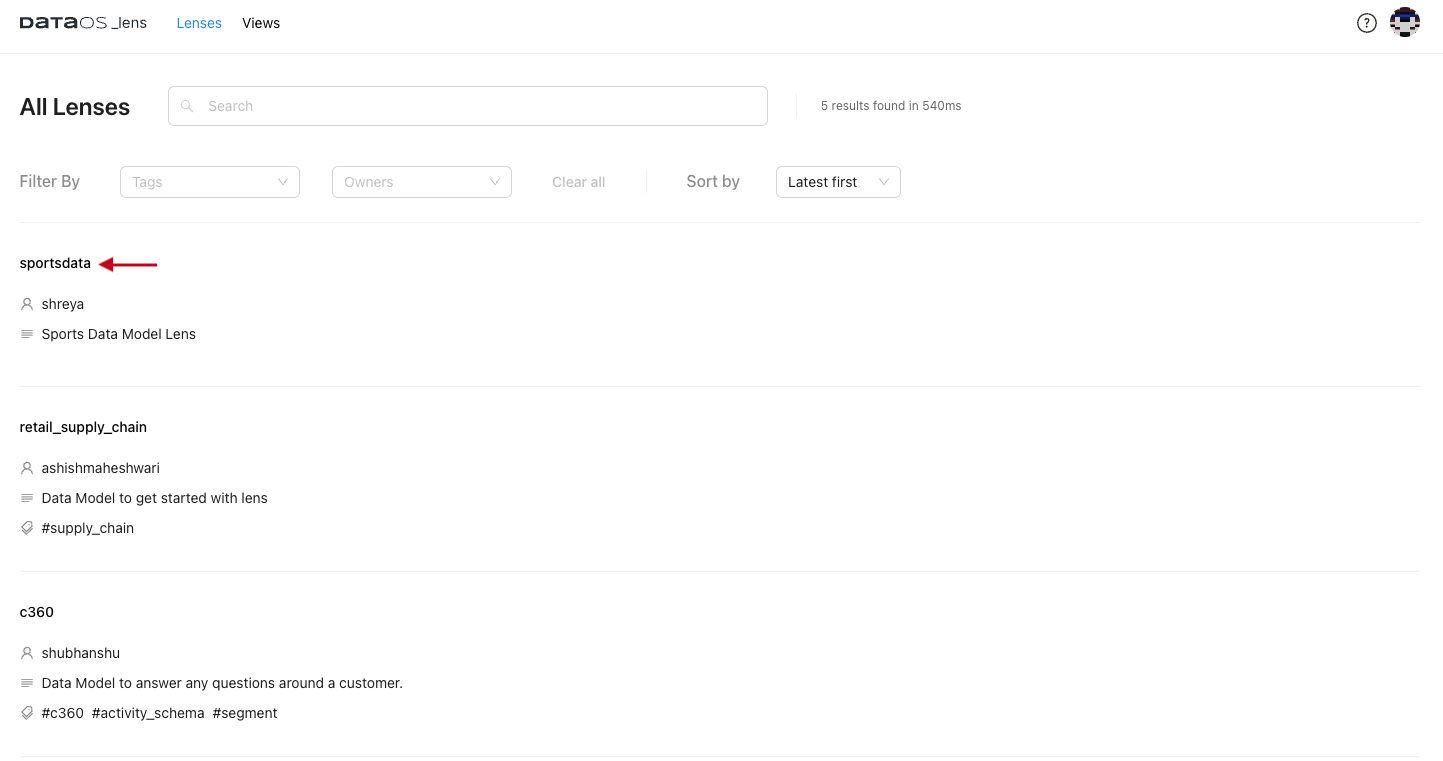
-
Select the appropriate Lens (Sportsdata )created for the customer order data.
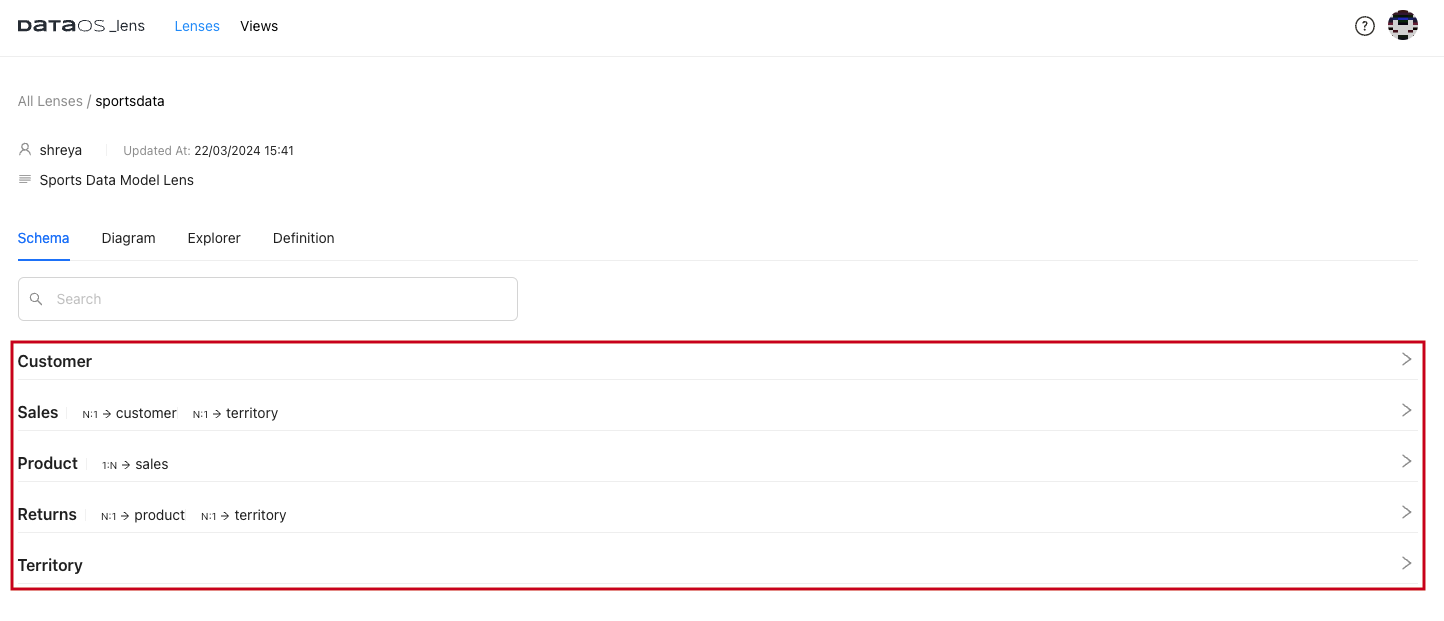
-
You can examine the schema. In the context of this use case, primary entities are Sales, Product, Returns, Territory. Expand to see their properties.
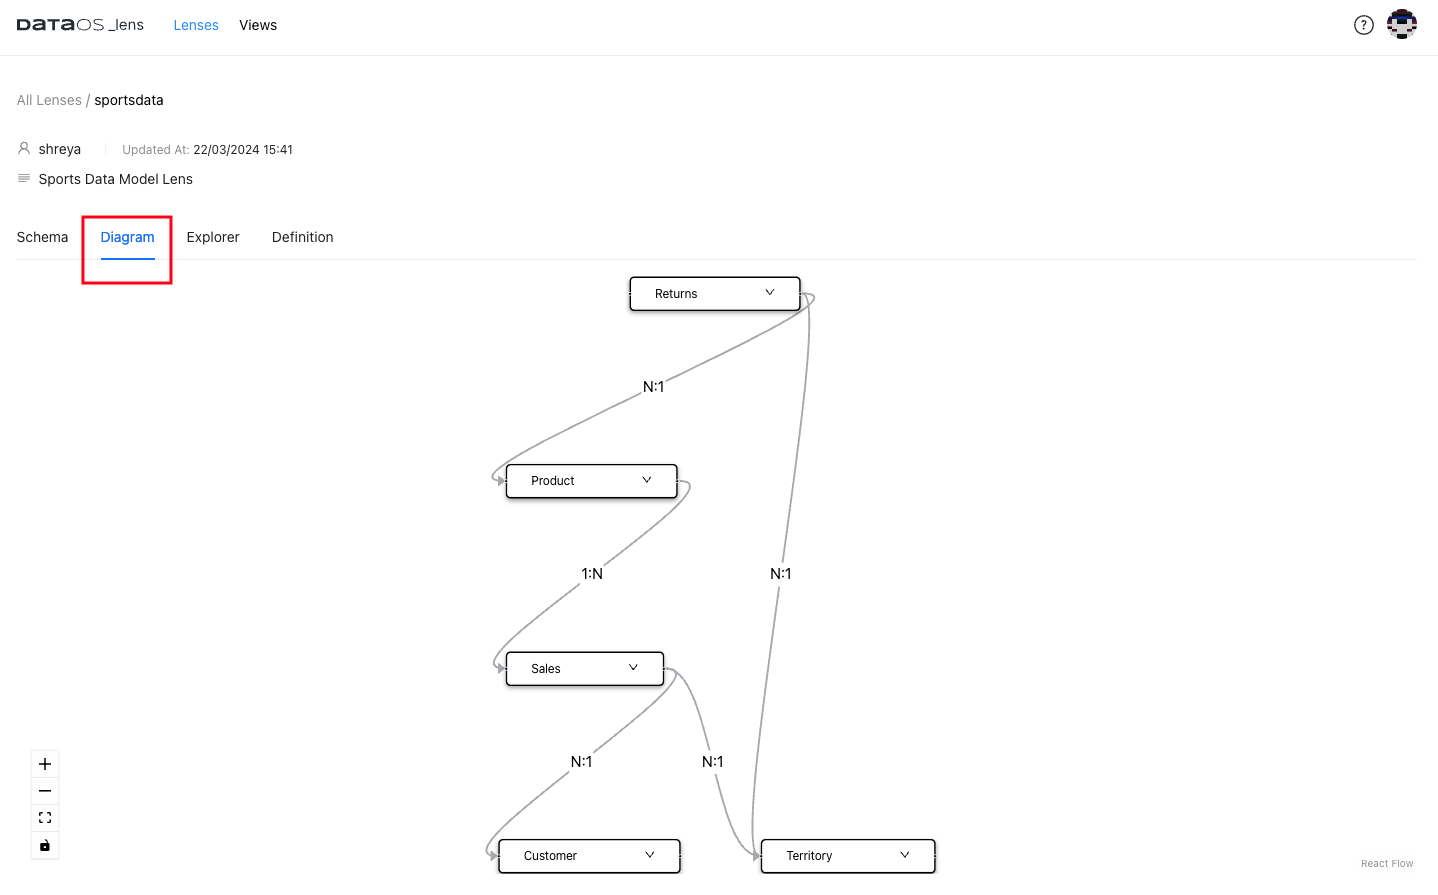
-
Click on Diagram to learn more about the relationships among the entities. We can see how entities are connected, enabling cross-entity analysis. For instance, you can analyze customer transactions, product sales, and returns by territory by defining relationships for the Customer, Product, Returns, and Territory entities in the use case.
Sports Retail Industry Use Case: Entities and their relationships
Here is the summary of attributes.
| Entity | Fields and Dimensions | Derived Dimensions | Measure | Related To | Relationship |
|---|---|---|---|---|---|
| Customer | first_name, last_name, birth_date, marital_status, gender, email_address, annual_income, total_children, education_level, occupation, home_owner, dob | full_name, customer_lifespan_in_year, customer_lifespan_in_month, average_order_value, average_purchase_frequency_rate, customer_lifetime_value, home_owner_bool_value | total_customer, average_annual_income, count_home_owner | ||
| Sales | order_number, customer_key, order_date, inline_item_number, product_key, territory_key, order_quantities, order_line_item, category_name | total_revenue, number_of_orders, number_of_customer, first_order, last_order, lifespan_in_year, lifespan_in_month, avg_order_value, avg_purchase_freq_rate, month1_revenue, month2_revenue, product_category_share_orders, date_wise_orders | Customer, Territory | N:1, N:1 | |
| Product | product_key, product_subcategory_key, product_name, product_description, product_sku, product_color, product_size, product_style, product_cost, product_price | profit | Sales | 1:N | |
| Returns | return_date, product_key, territory_id, return_quantity | Product, Territory | N:1, N:1 | ||
| Territory | sales_territory_key, region, country |
Building Query for Analysis
Next, let's dive into the analysis of date-wise orders.
Open Lens Explorer, where you will find a list of entities along with their fields, dimensions, and measures.
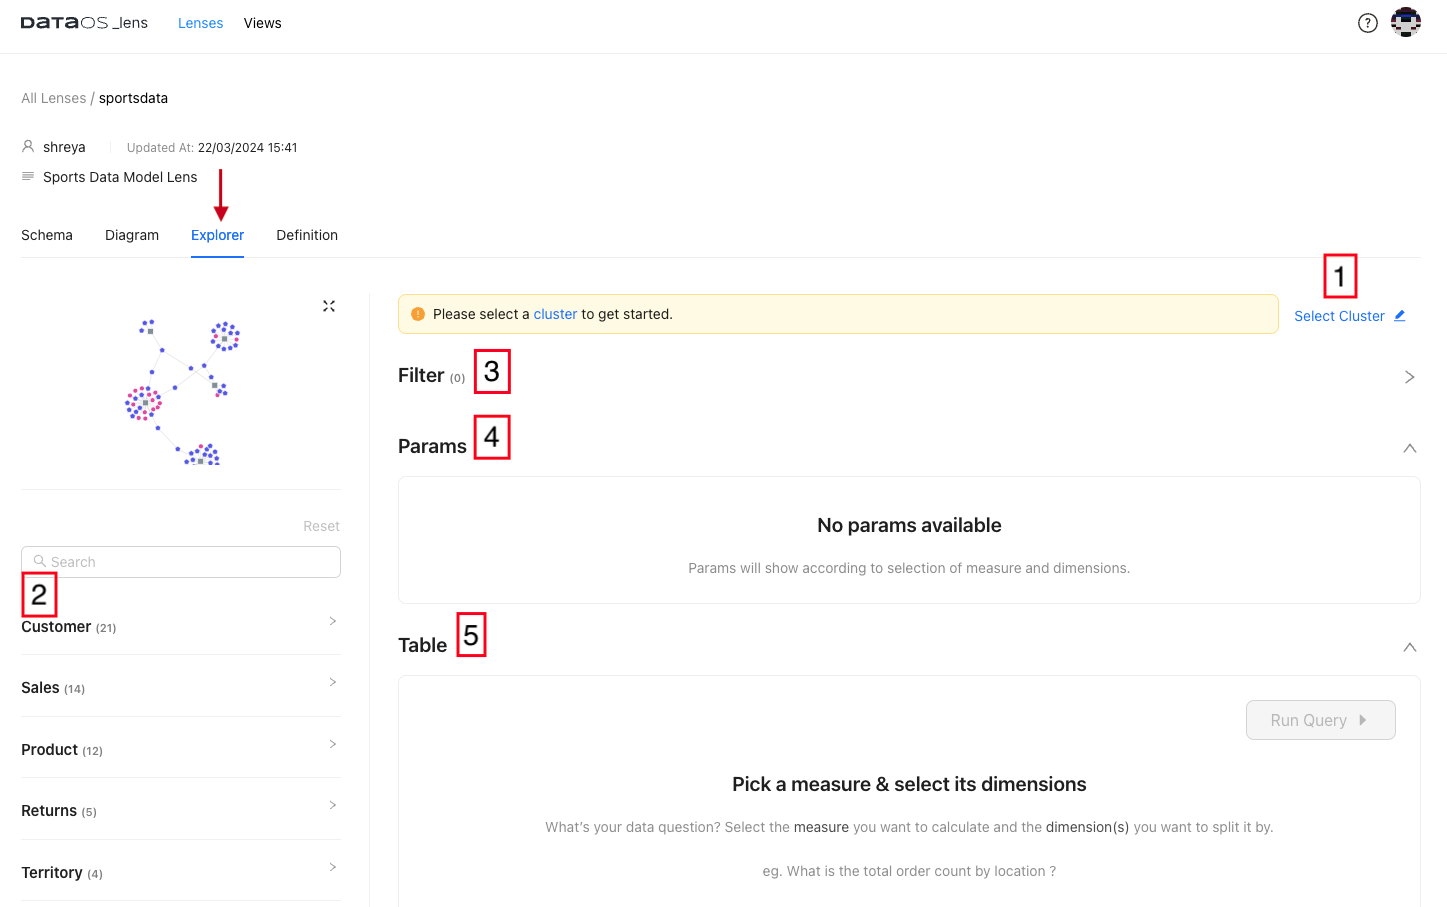
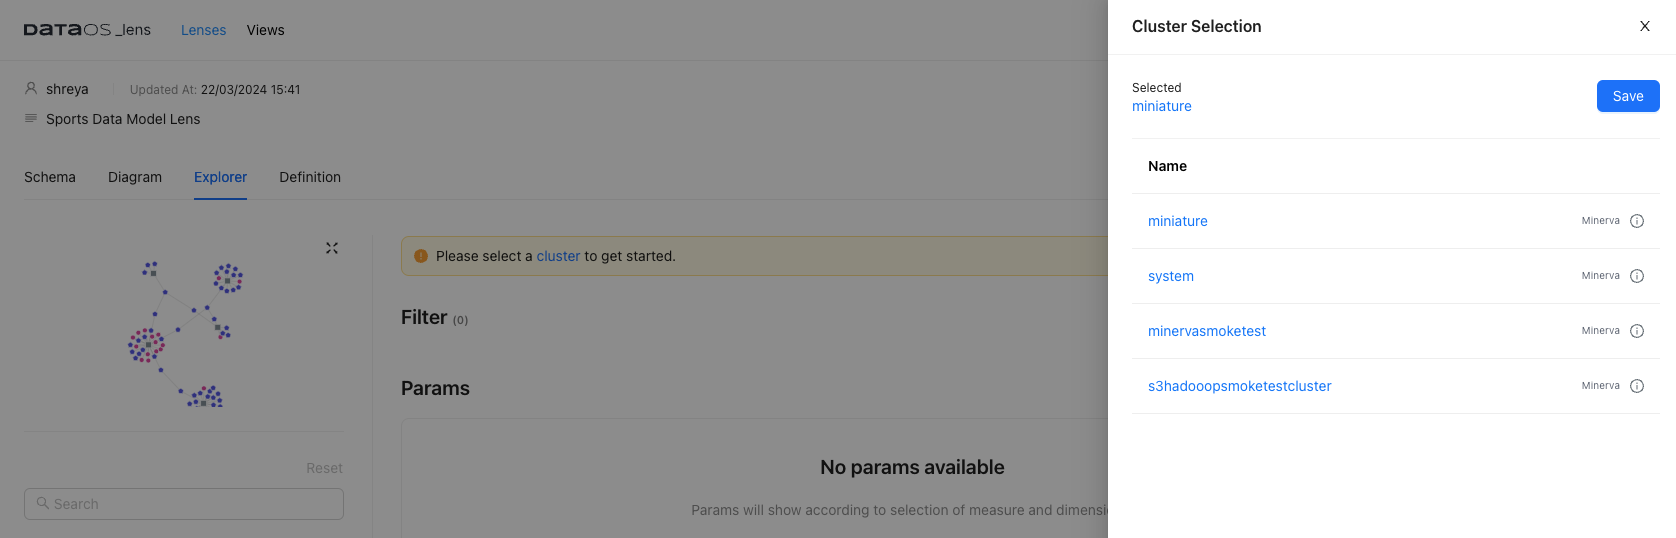
Step 1: Select a Cluster
-
If a cluster is not selected, choose the appropriate cluster to start querying Lens.
Step 2: Choose Fields, Dimensions, and Measures
- Explore entities to understand available fields, dimensions, and measures.
-
Choose the required fields for your analysis based on your use case.
For the most frequent order analysis, we will select customer_key(from the Customer entity) and number of orders (from Sales entity). Once you have found the required field, click on the field name. Once selected, the field name will become highlighted in grey. This will automatically populate the field as a column in the table.
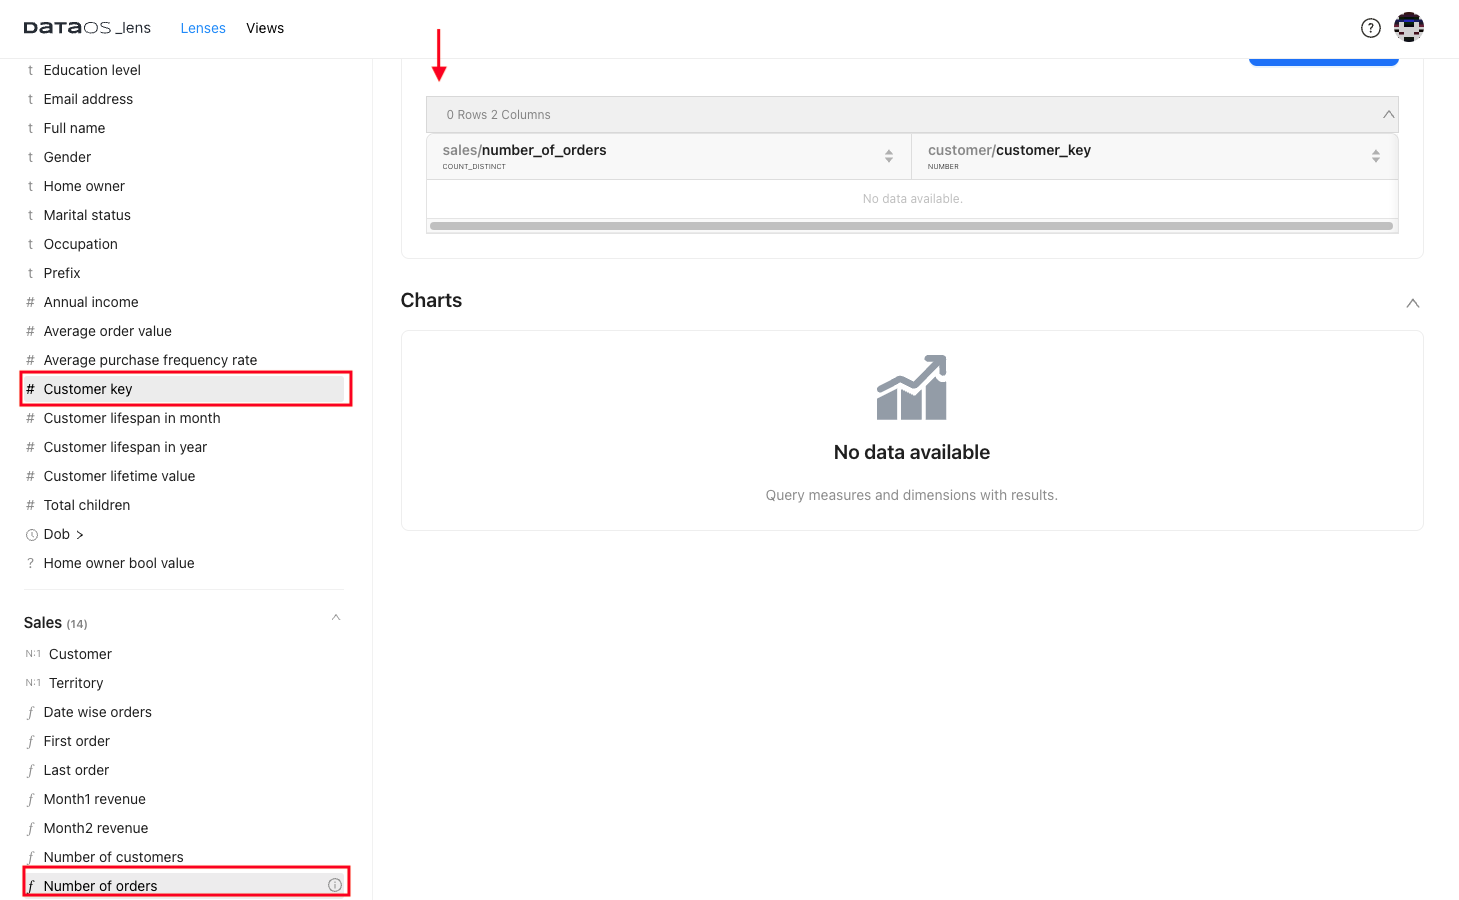
-
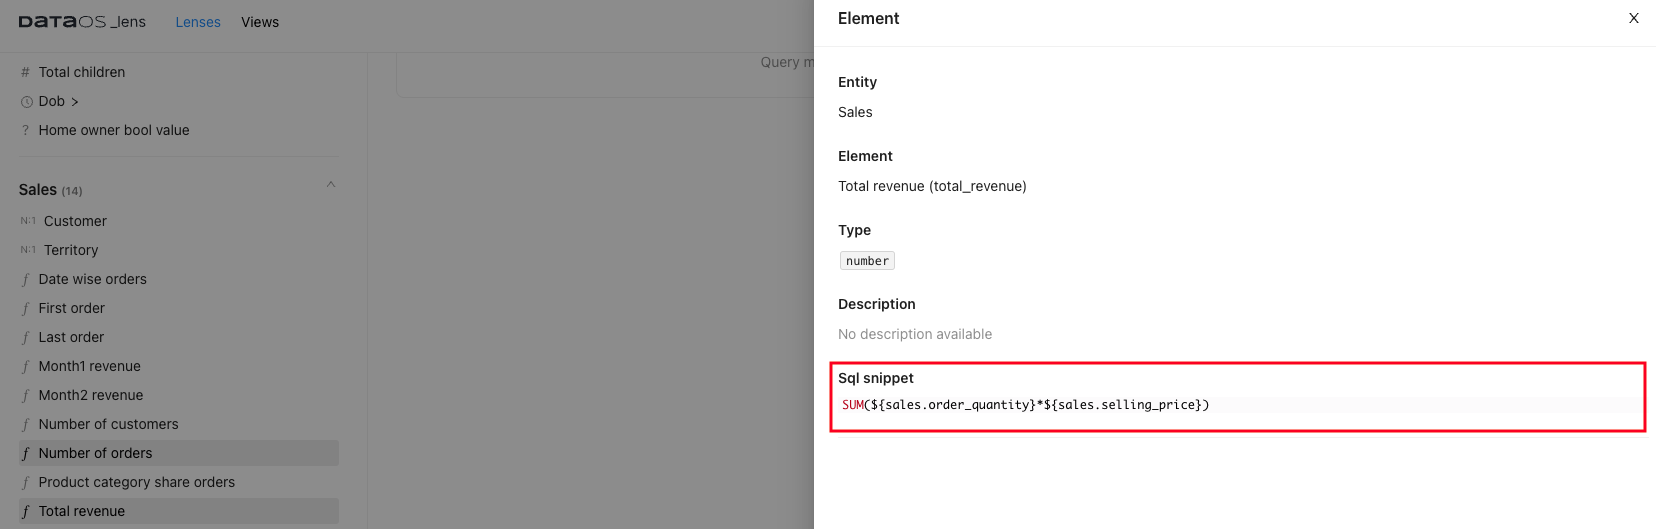
Click on the information icon for detailed descriptions and logic behind calculated fields if applicable.
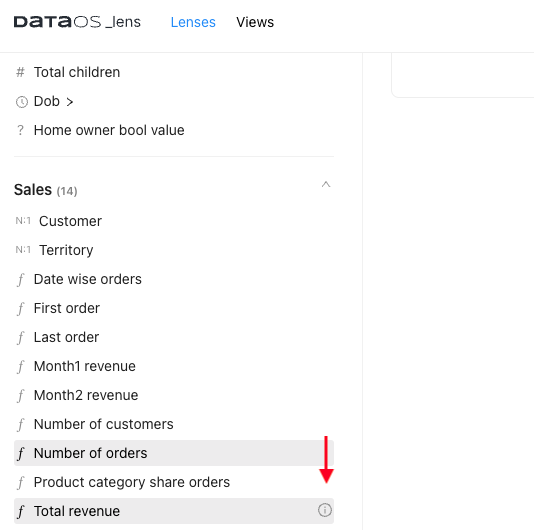
You can see the snippet for derived dimensions and measures. The actual logic behind the calculations for total_revenue is shown here .
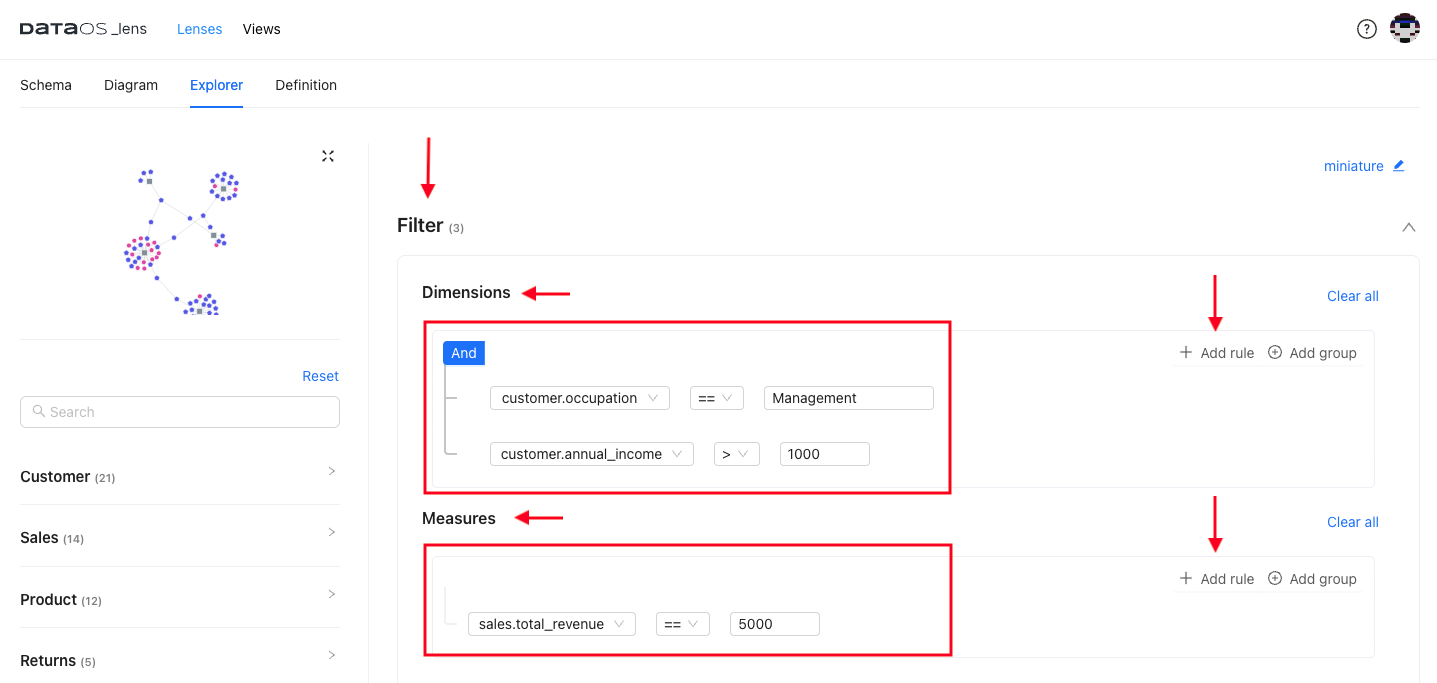
Step 3: Apply Filter Conditions
Add filter rules to narrow down the dataset based on specific conditions.
- Click on the "Filter" option to open the filter panel.
- Identify the field you want to filter by. It could be any dimension or measure within your Lens.
- Click on the “Add rule”.
- Select the field.
- Once the field is added to the filter panel, you'll be prompted to define the condition.
- Choose the appropriate operator (e.g., equals, greater than, less than) based on your filtering requirement.
- Enter the value or range for the condition.
-
You can add more rules with AND , OR operators.
Here, we aim to analyze customers based on their occupation and income group.
-
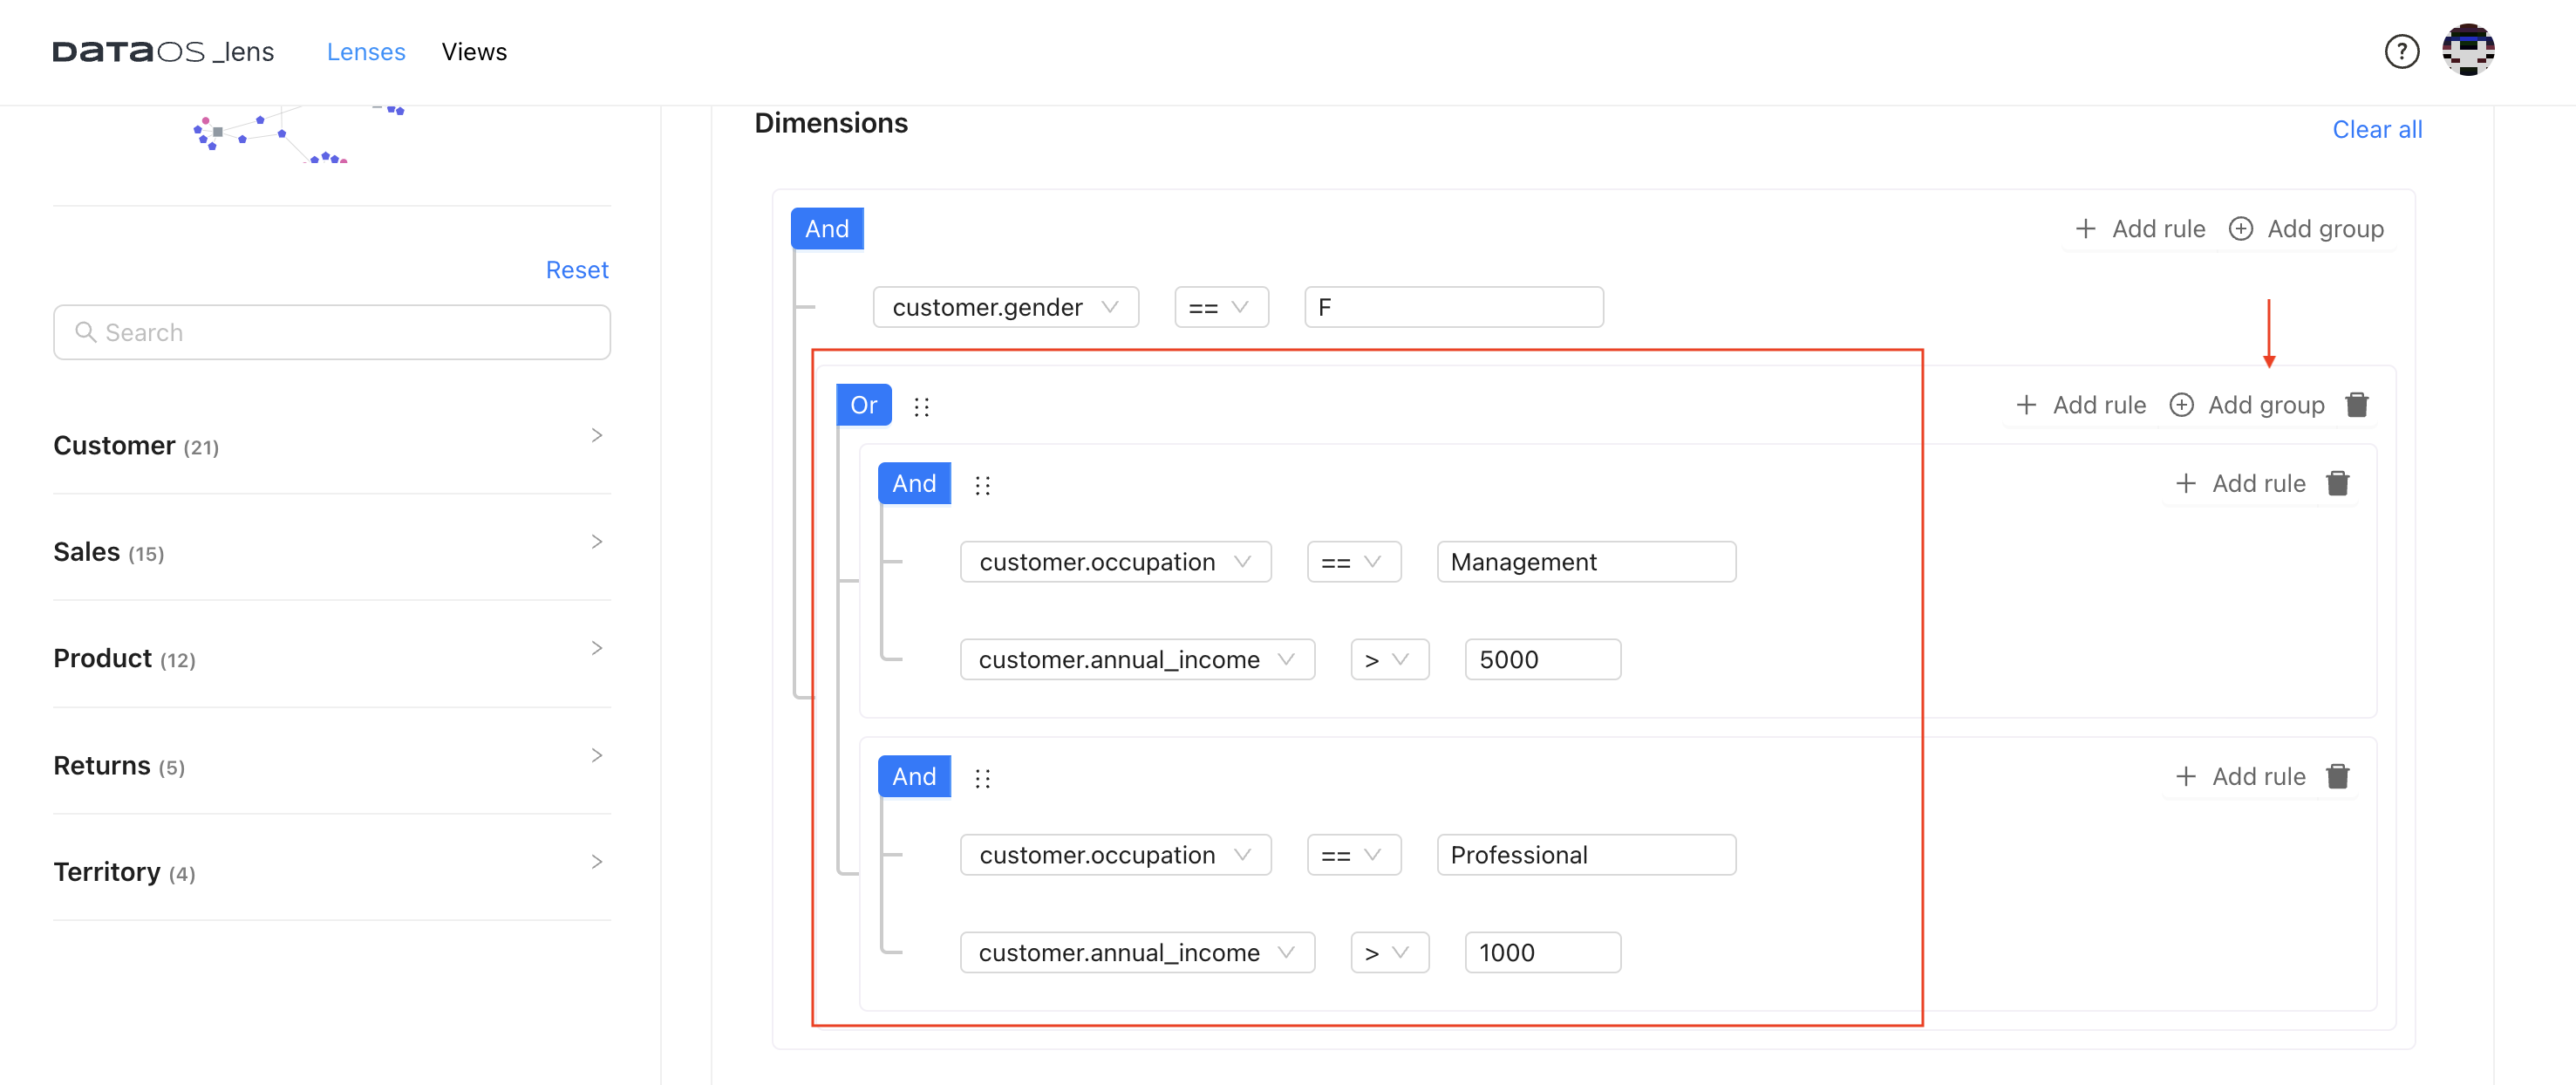
We can create Group conditions for complex filtering requirements.
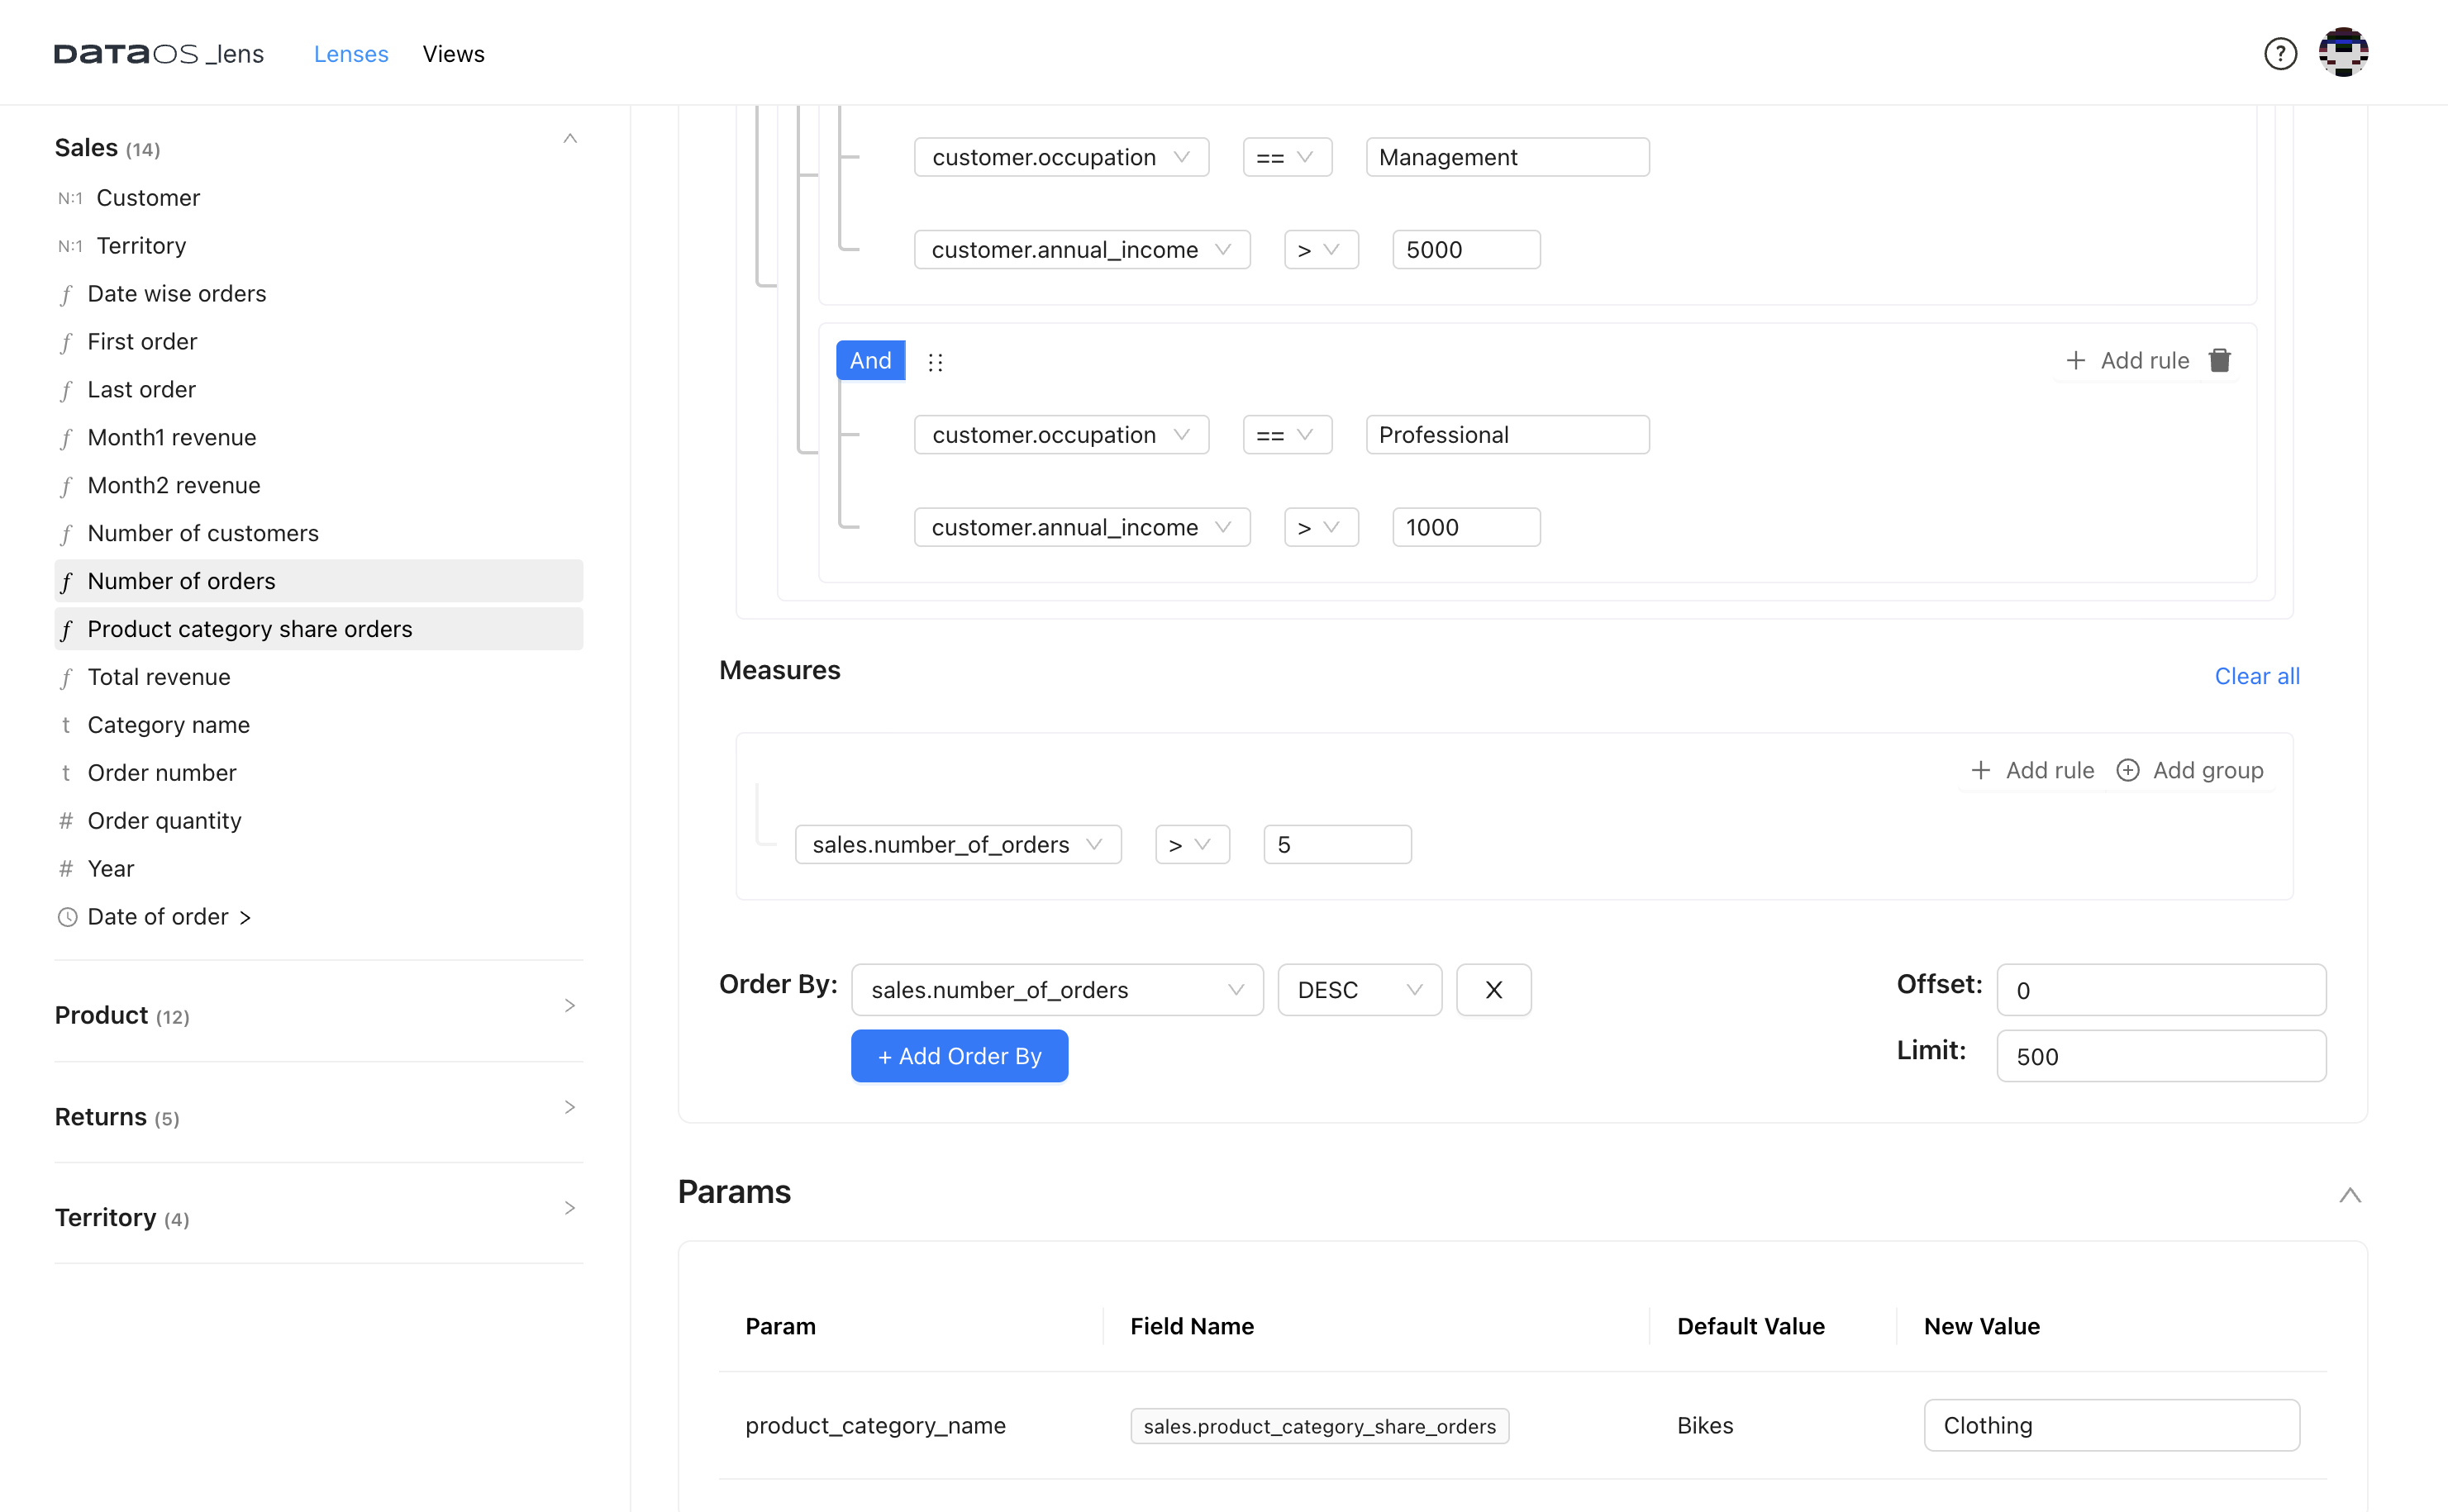
Example 1: If you're looking to compile a list of female customers who either hold managerial positions with an income exceeding 5000 or are professionals with an annual income surpassing 1000, we can filter the dataset accordingly.
In this situation, you will use Add groups while adding rules.
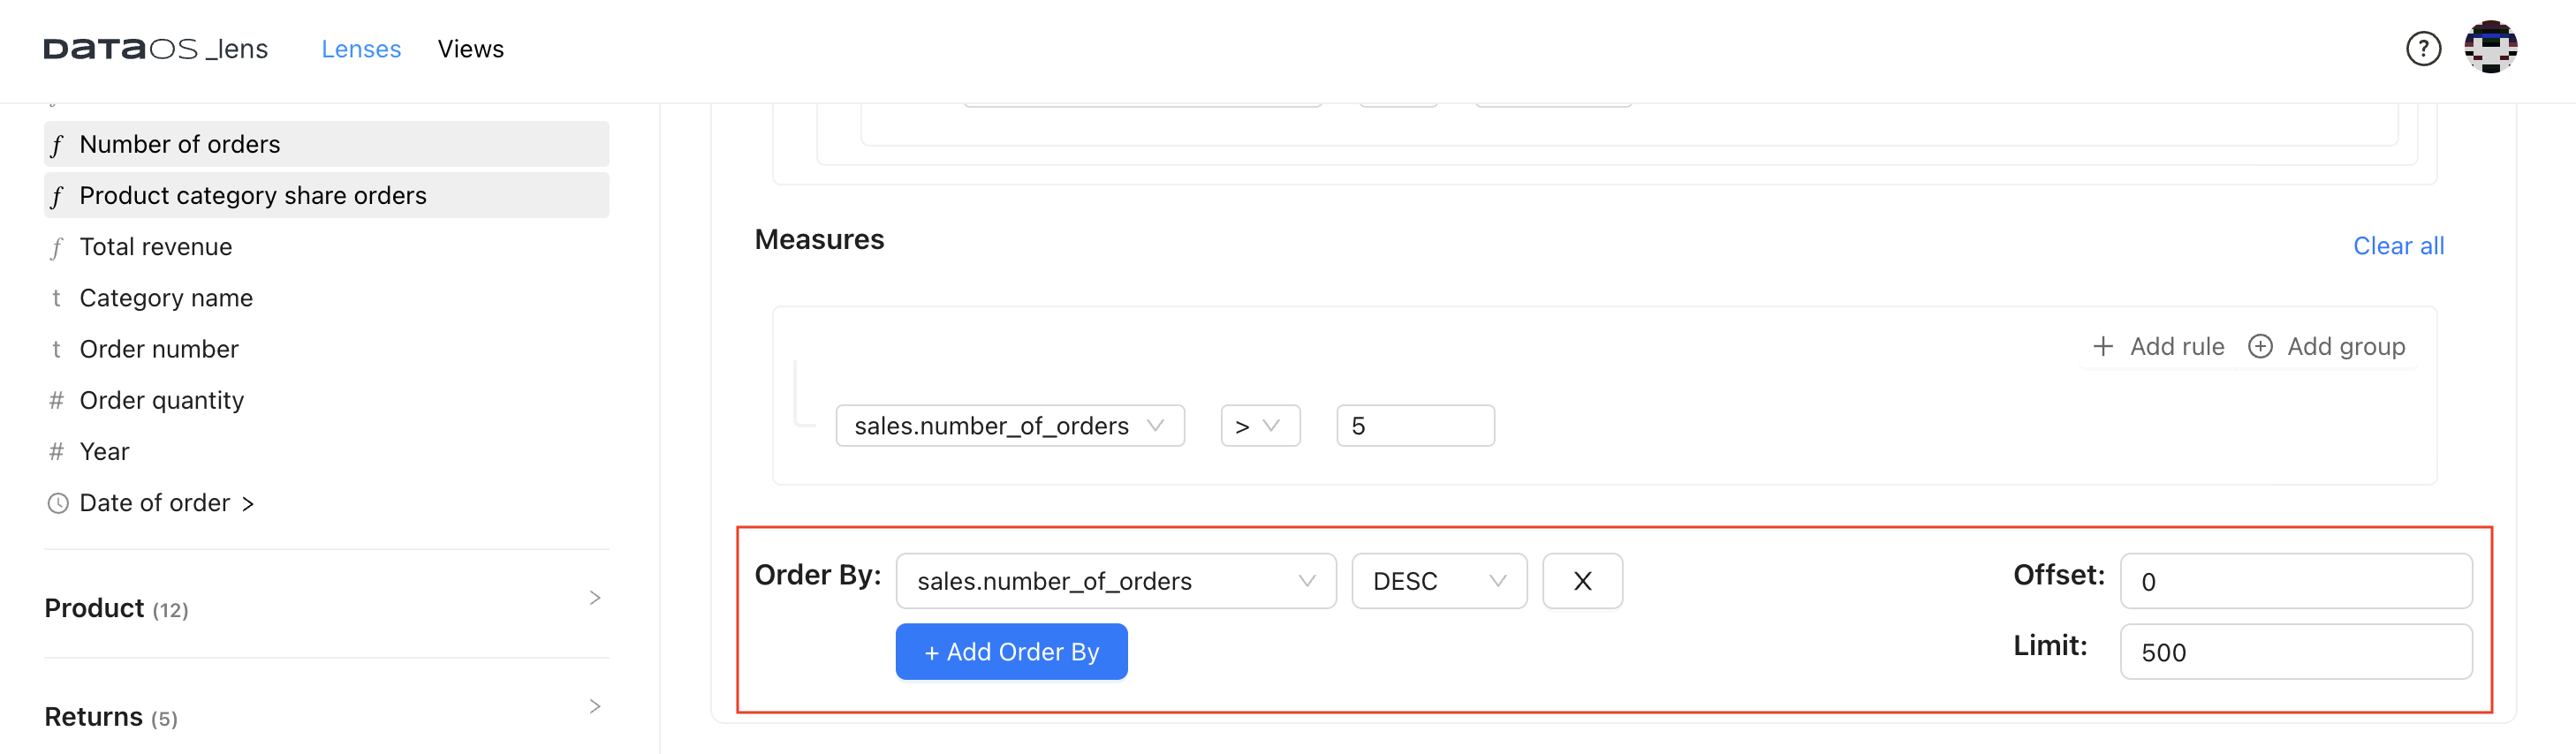
-
Set sorting order and limit the number of records as required.
You can choose the sorting order and limit the number of records in the user interface.
Step 4: Apply Params
Parameters allow input values during analysis so that we can customize the queries and refine data analysis as needed. If you do not provide new values, default values will be considered for the query execution. In this use case, we want to know about the customer’s preference for the specific brand.
Filters Vs. Params: Filters are used to narrow down the dataset based on specific conditions, while parameters allow users to input values during analysis, customizing, and refining queries as needed.
Step 5: Run the Query
With fields, dimensions, and measures readily available, utilizing Lens to address data questions is straightforward. You can swiftly find answers by selecting data elements on the Lens Explorer UI.
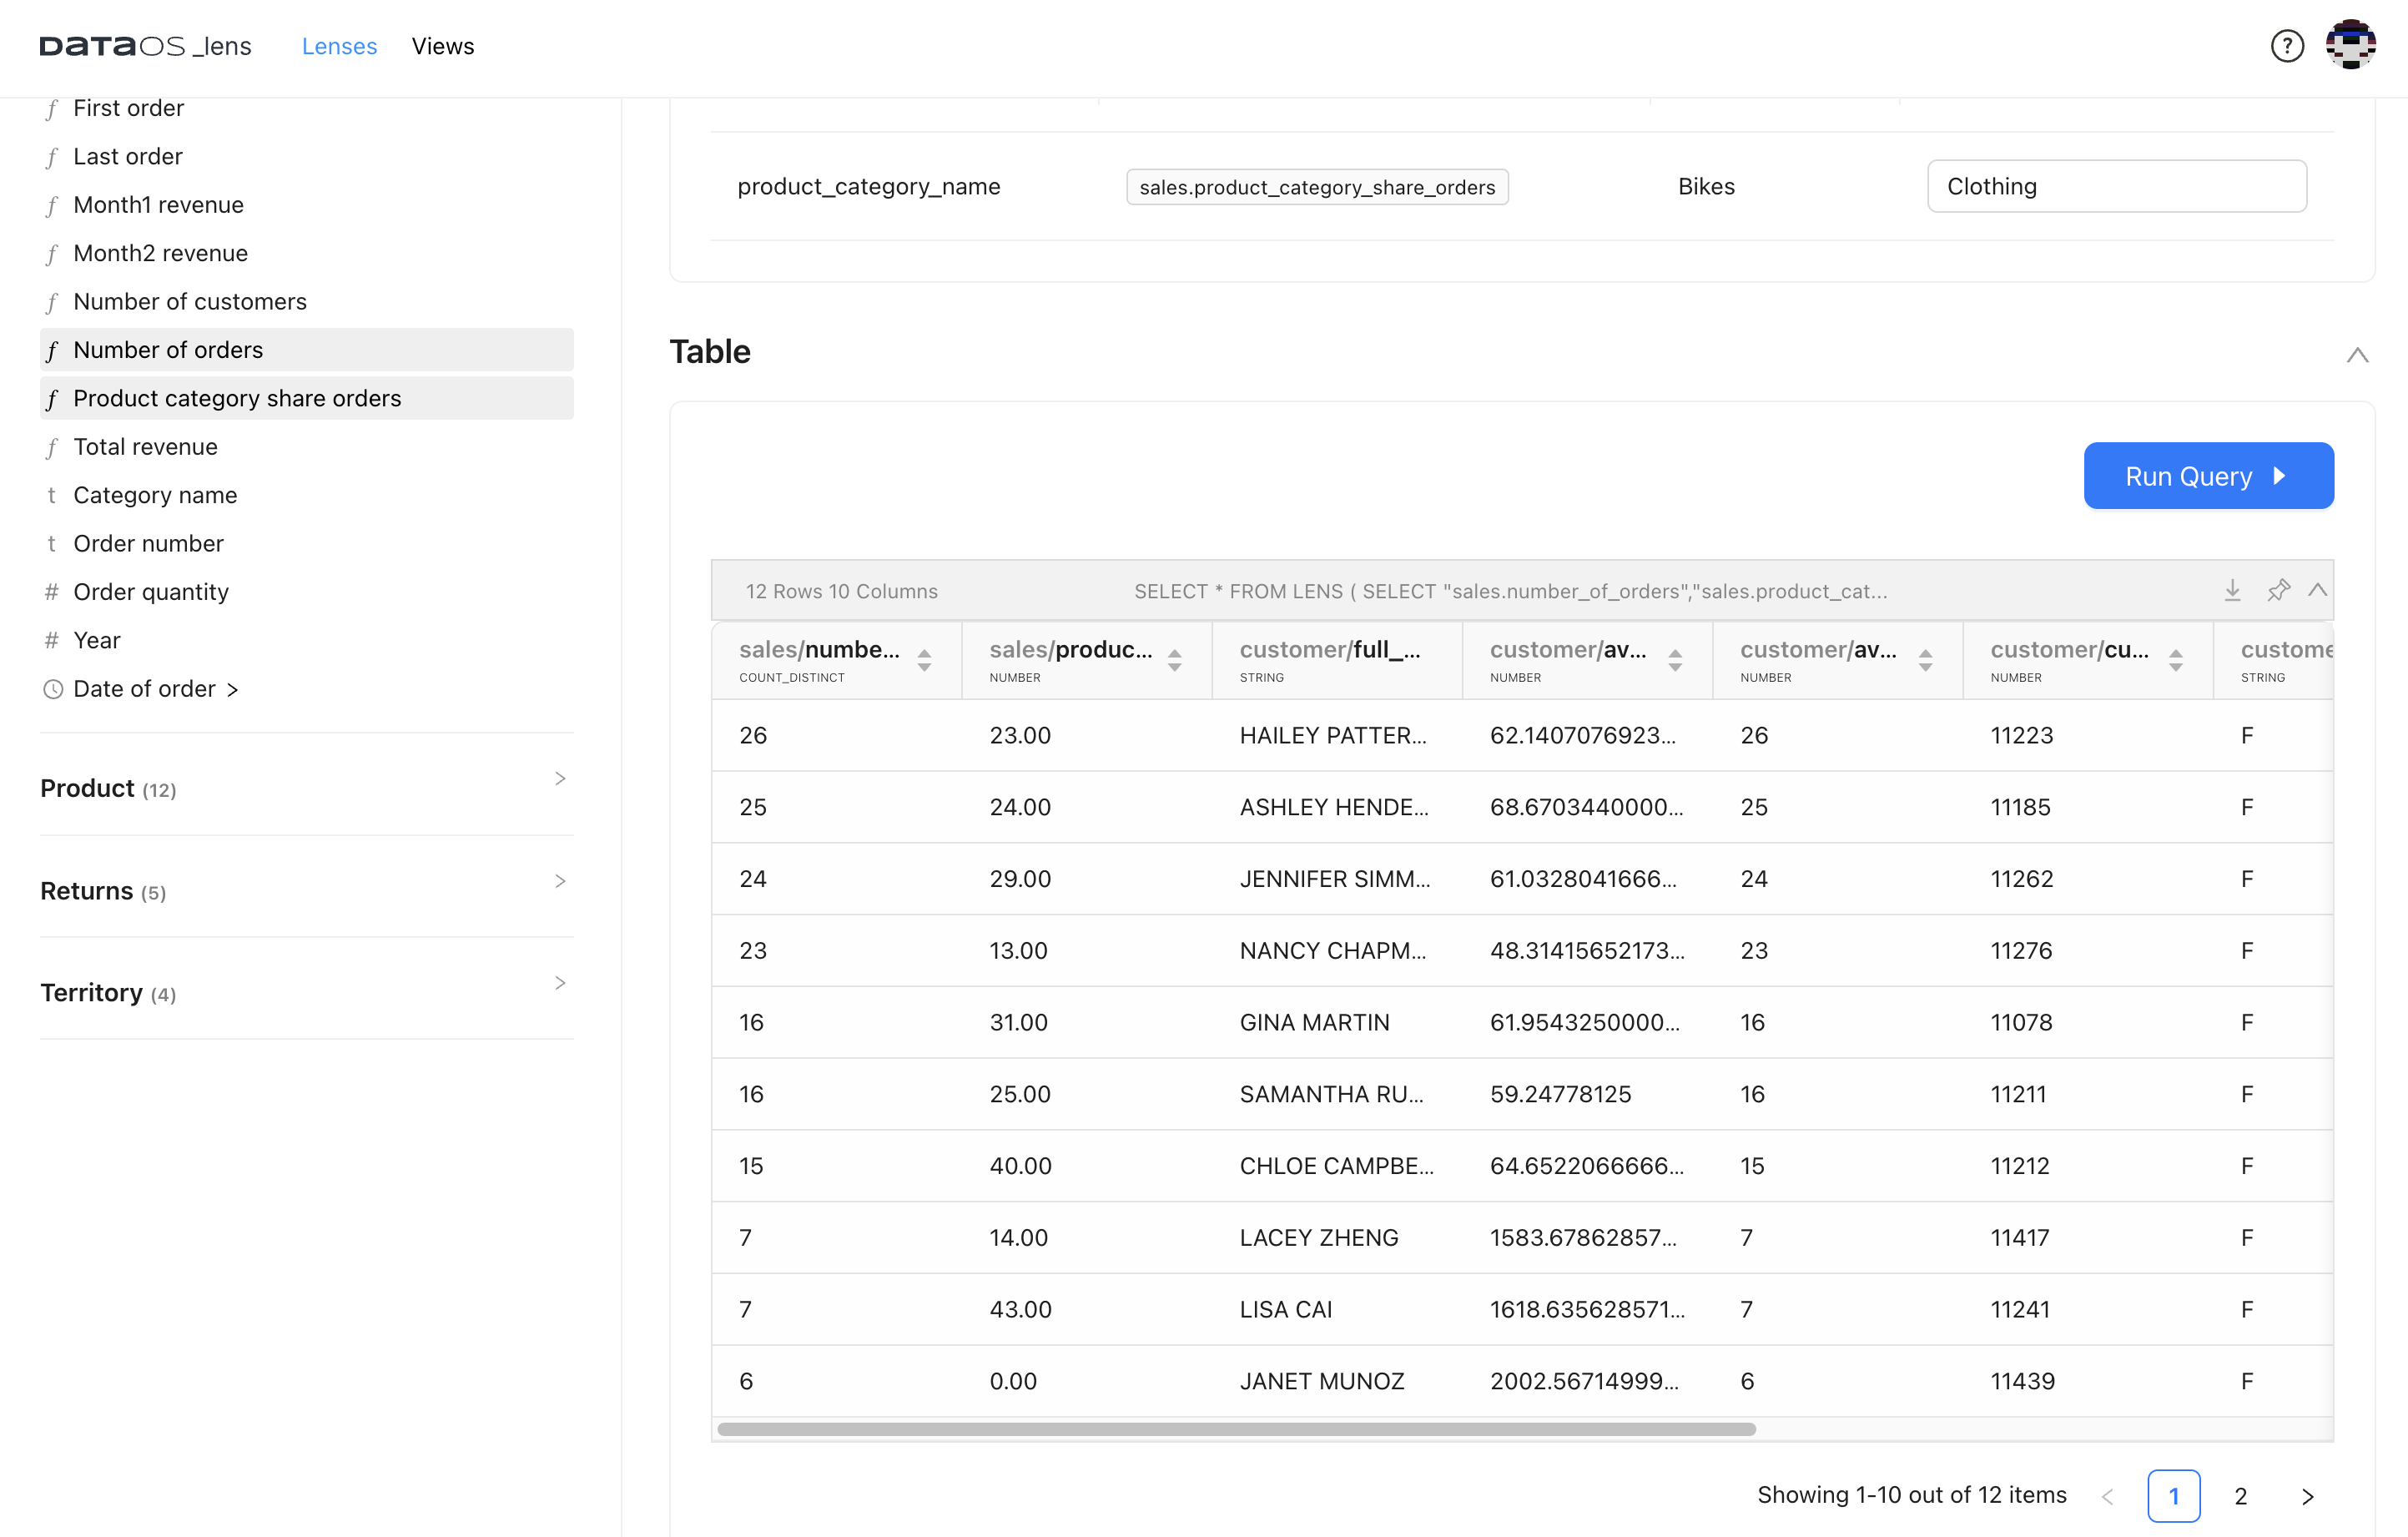
Click on ‘Run Query’ to see the results. The data displayed in the Lens Explorer will be filtered based on your specified condition.
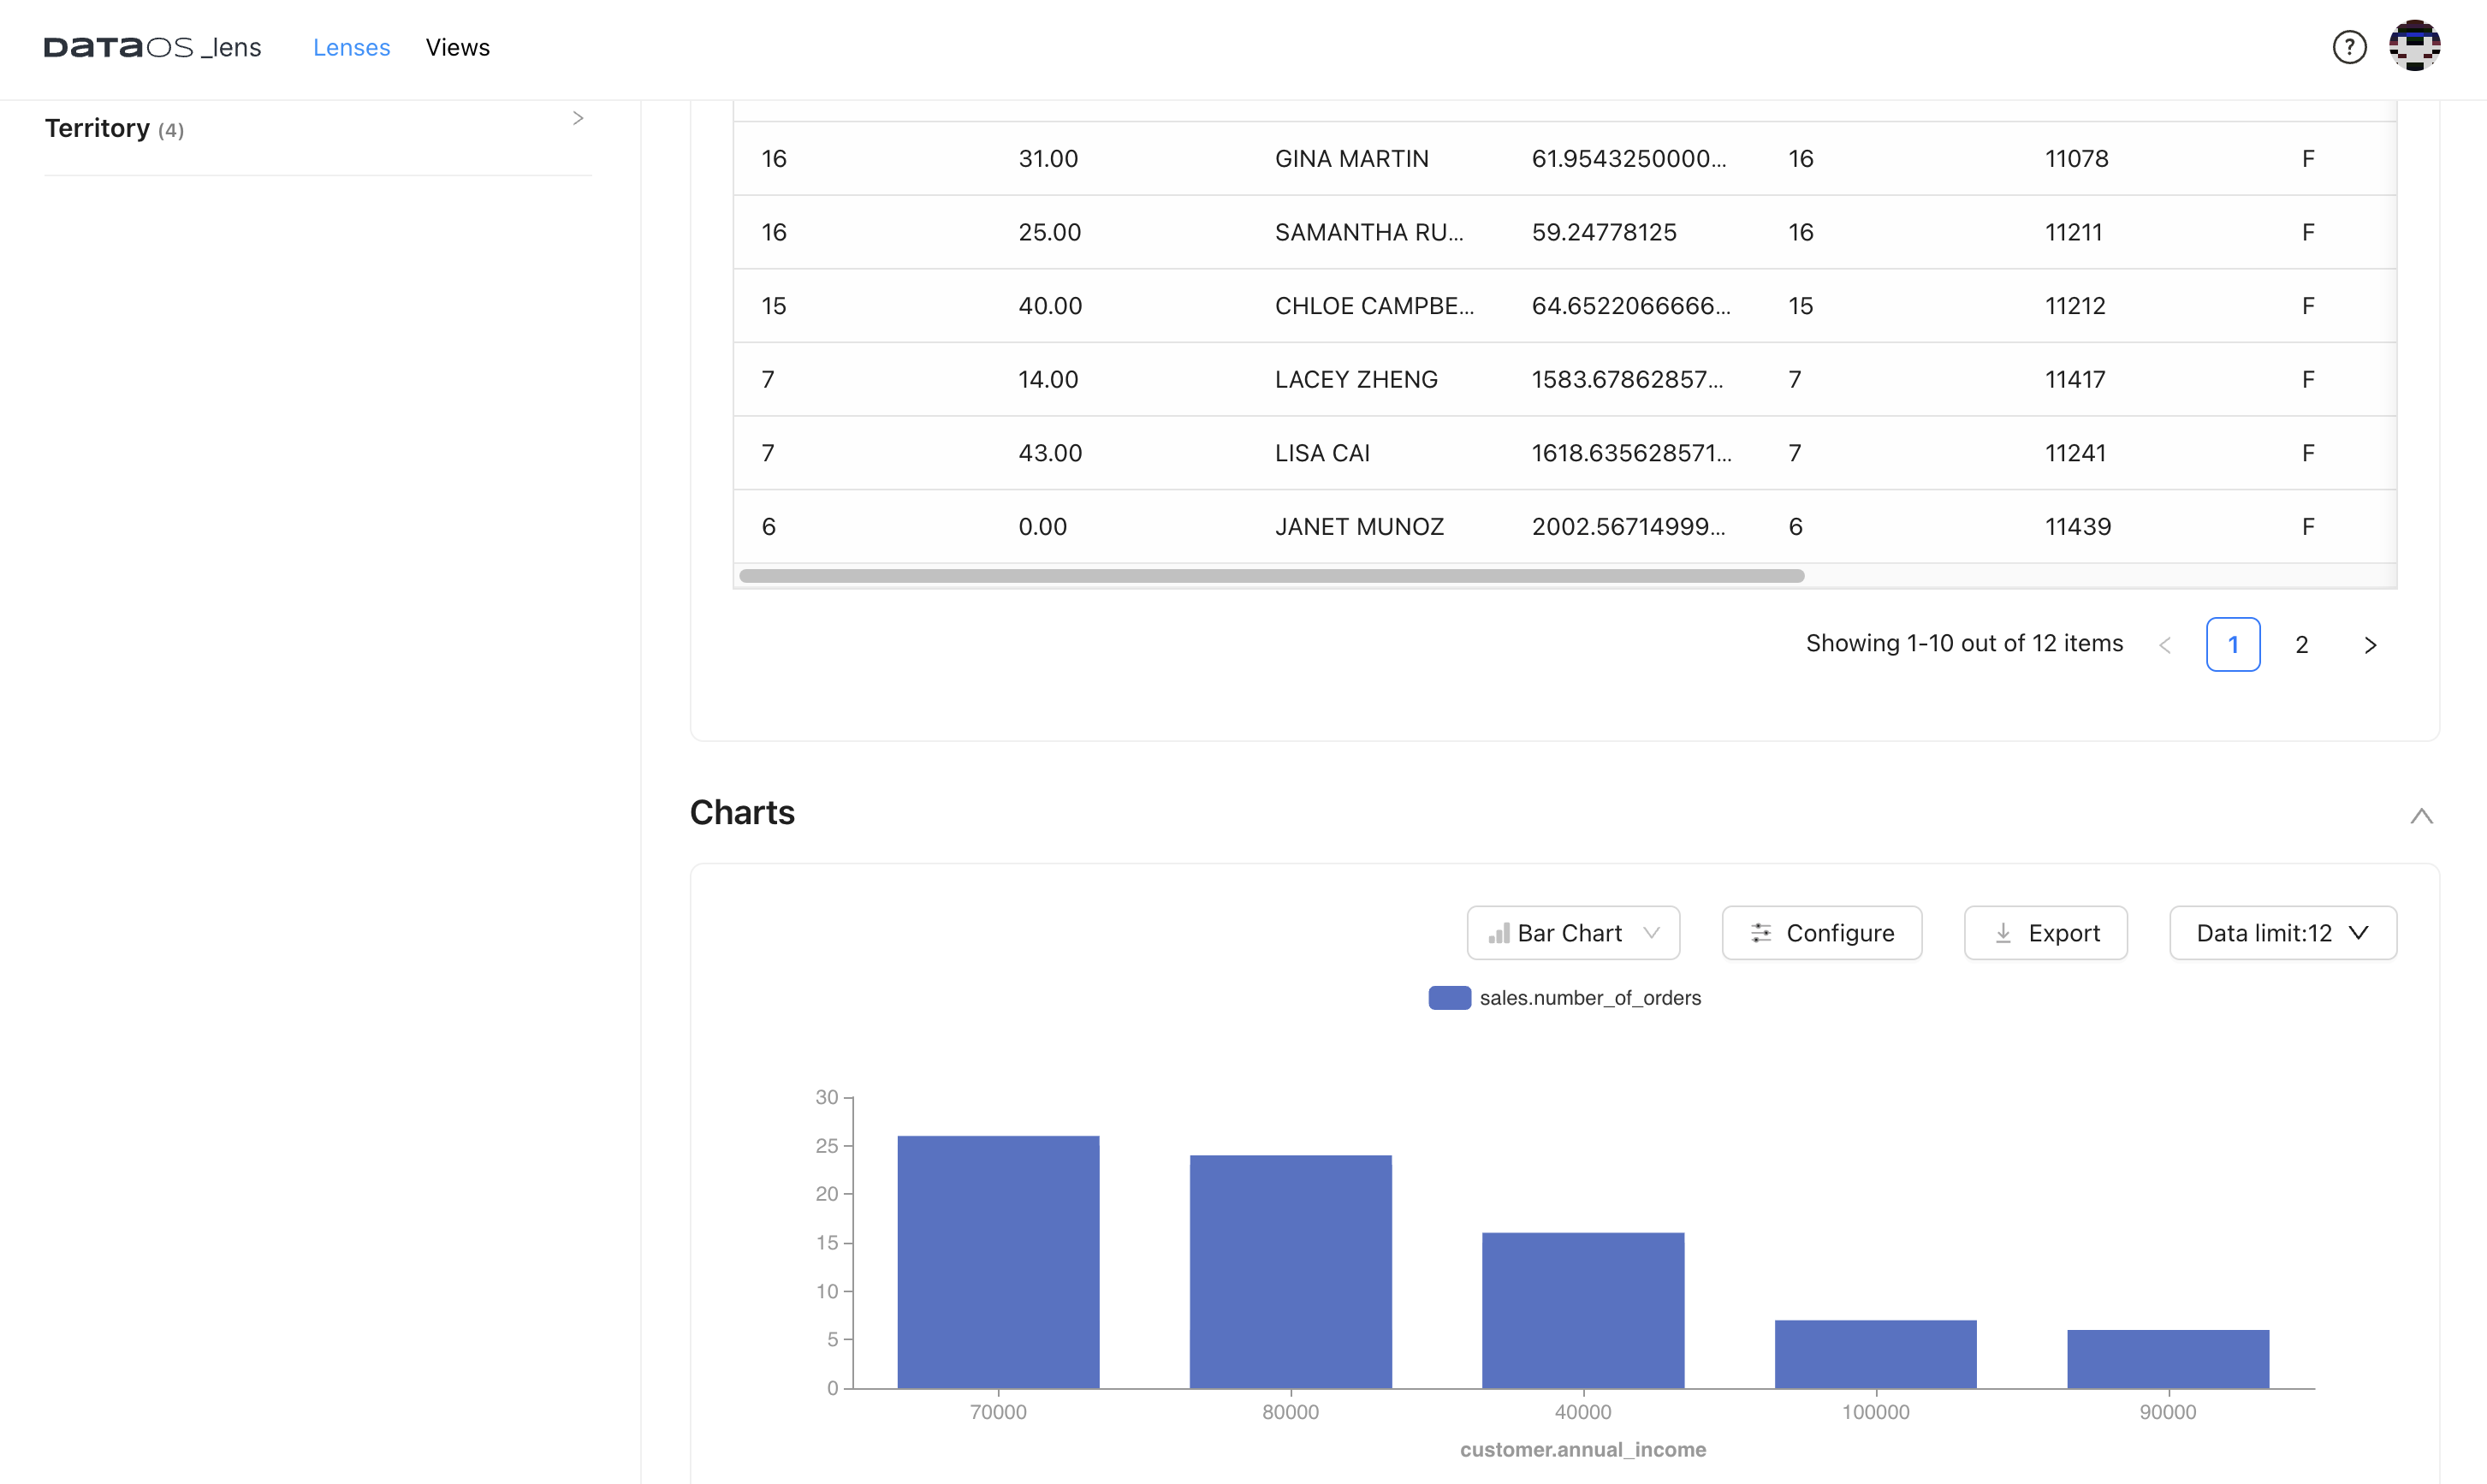
Step 6: Visualize the Results
This table view is generated as query output.
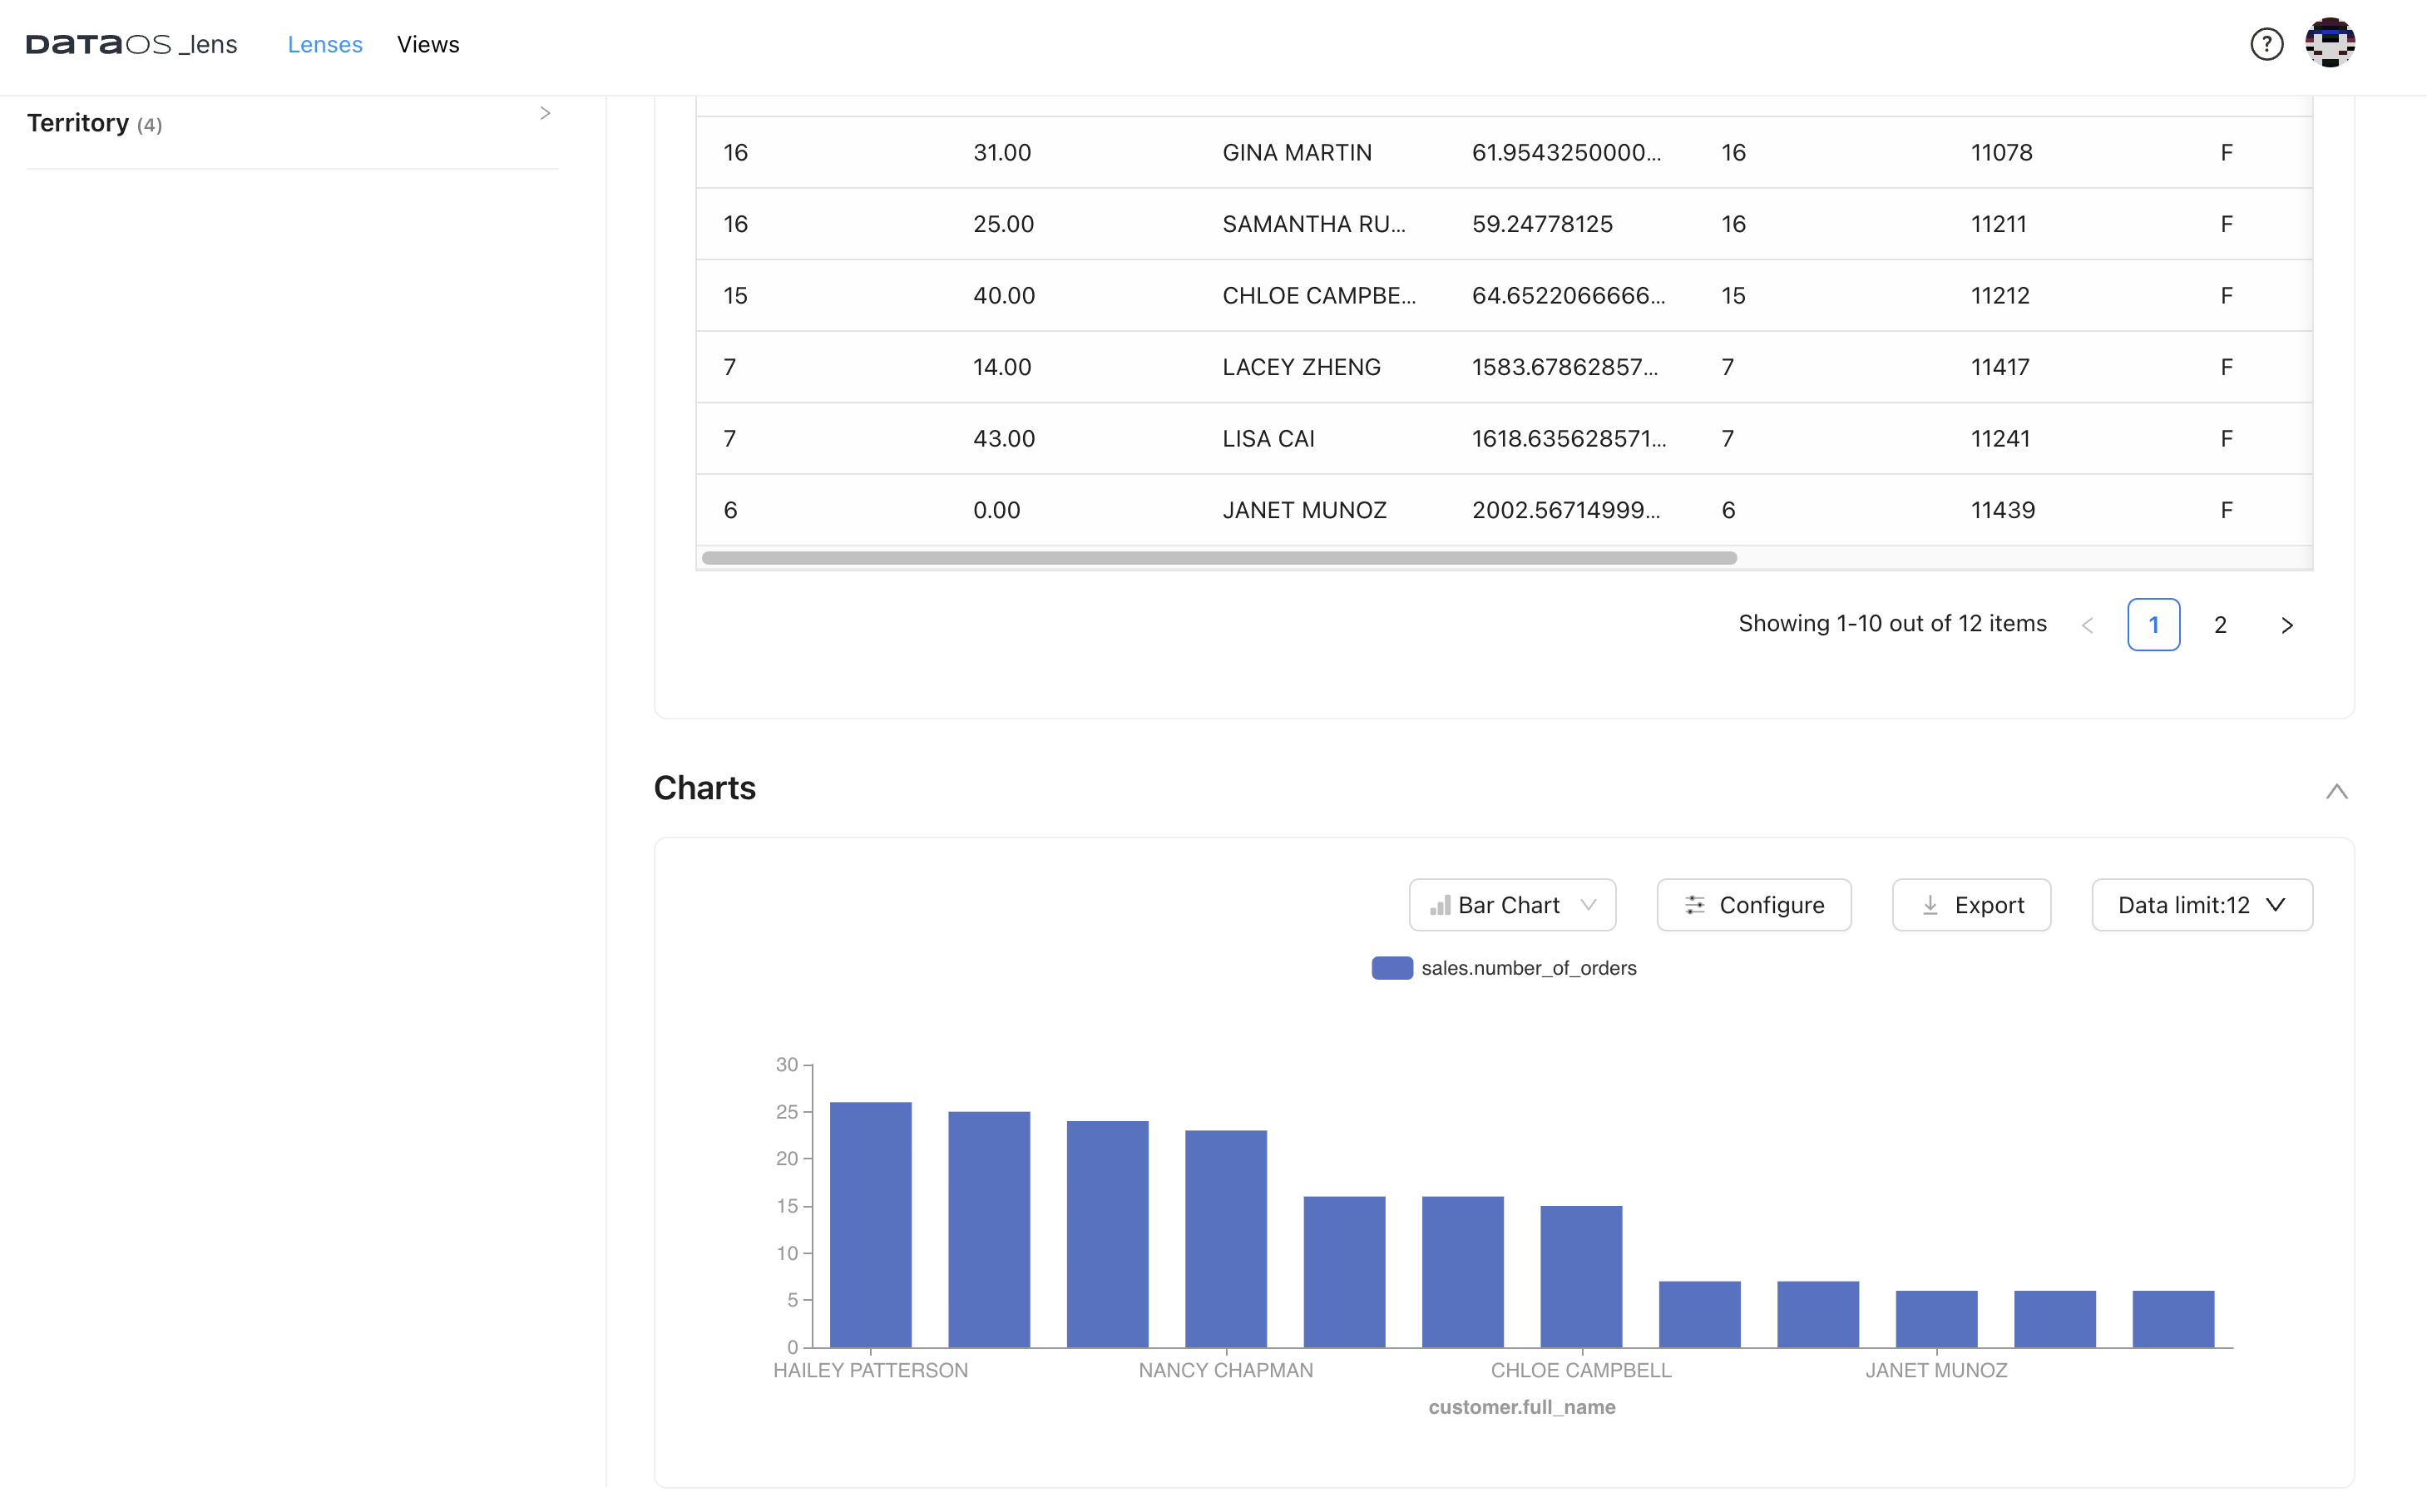
Graph: This is generated to show results graphically. Additionally, the generated charts can be exported for dashboard creation, enhancing data visualization capabilities.
Step 7: Customize the Generated Chart
You can customize the chart displayed in your Lens with the tools provided within the Chart Section. For example, you can switch between Line Chart and Bar Chart depending on the use case or change the data you want to show on X /Y axis. You can also Export the Chart in the required file format.
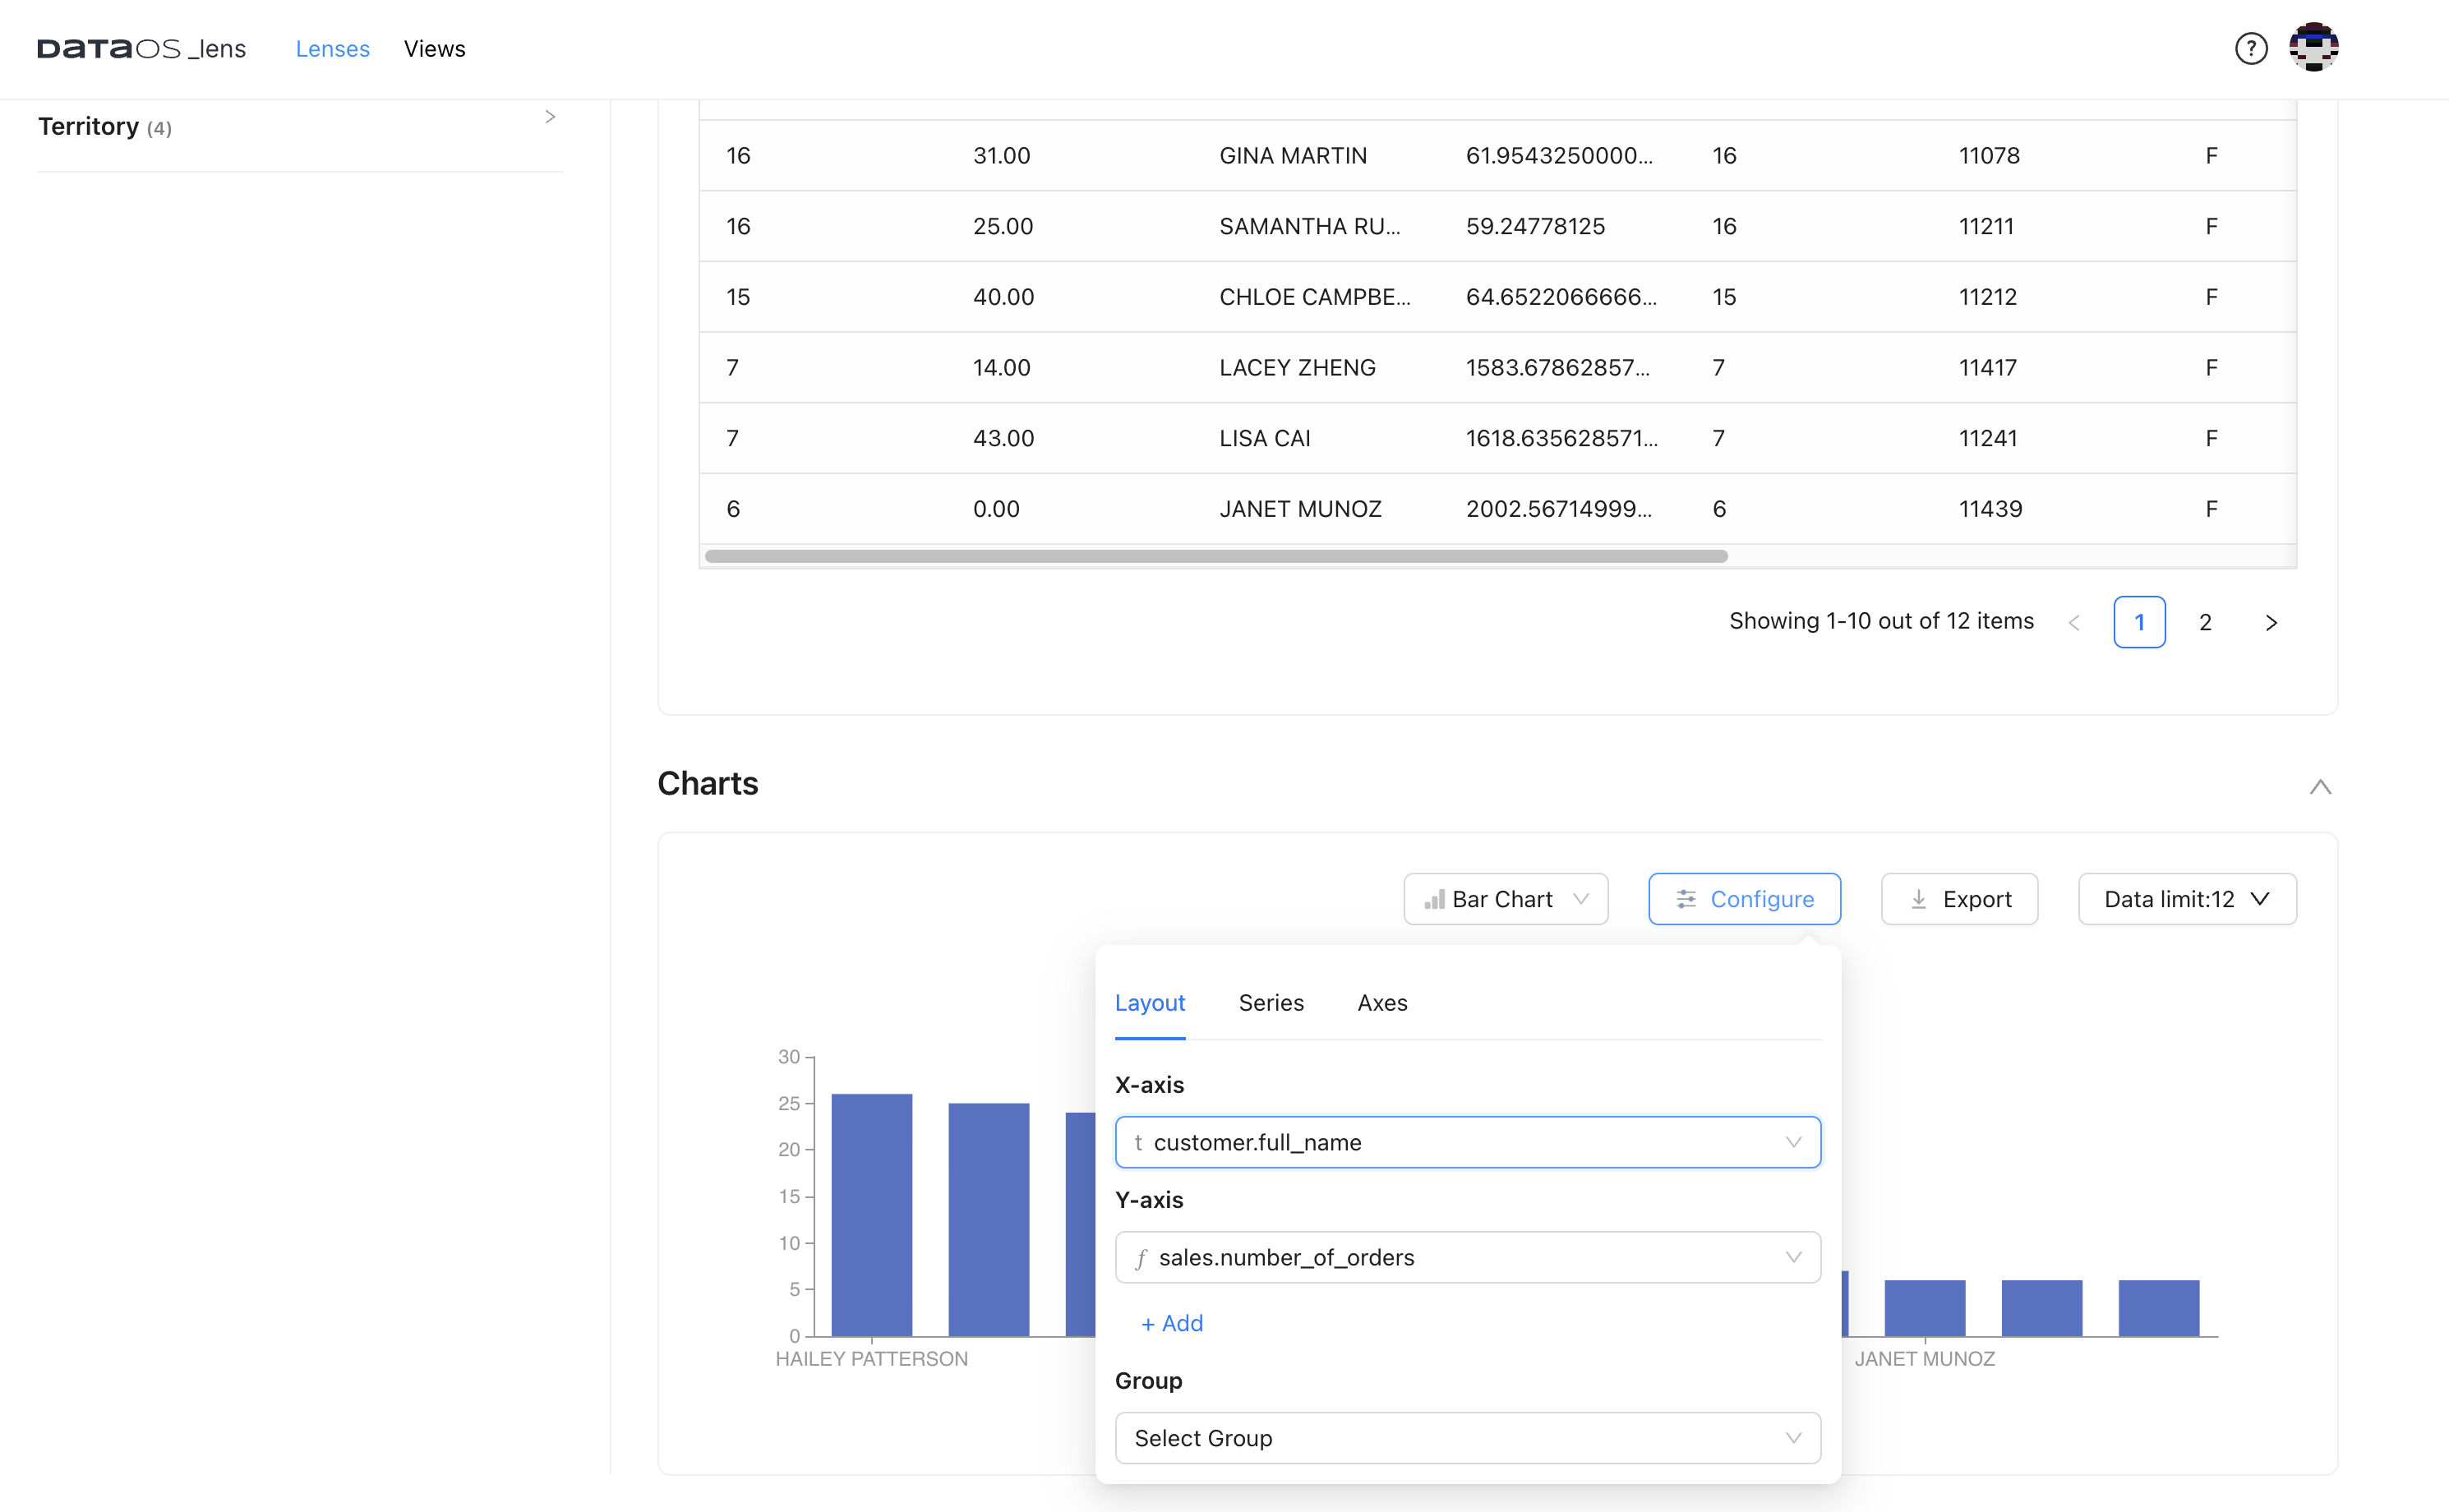
Here is the modified chart for more insights.
Step 8: Utilize the Generated LQL and SQL
Once all the columns in the table have been populated with data, you can view the underlying query by clicking on the SELECT statement located above the dataset. Simply hover over the statement, and the View Query icon will appear, allowing you to access the query.
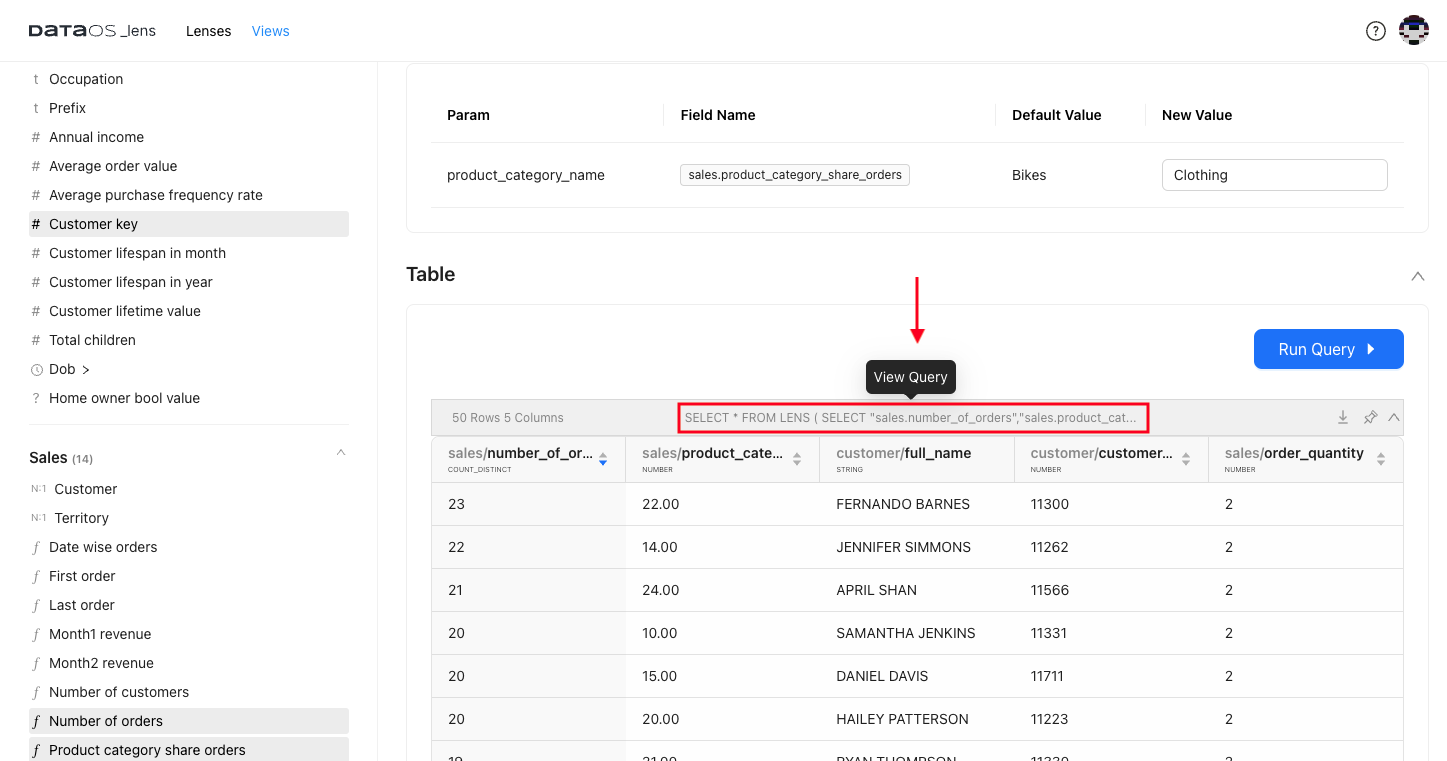
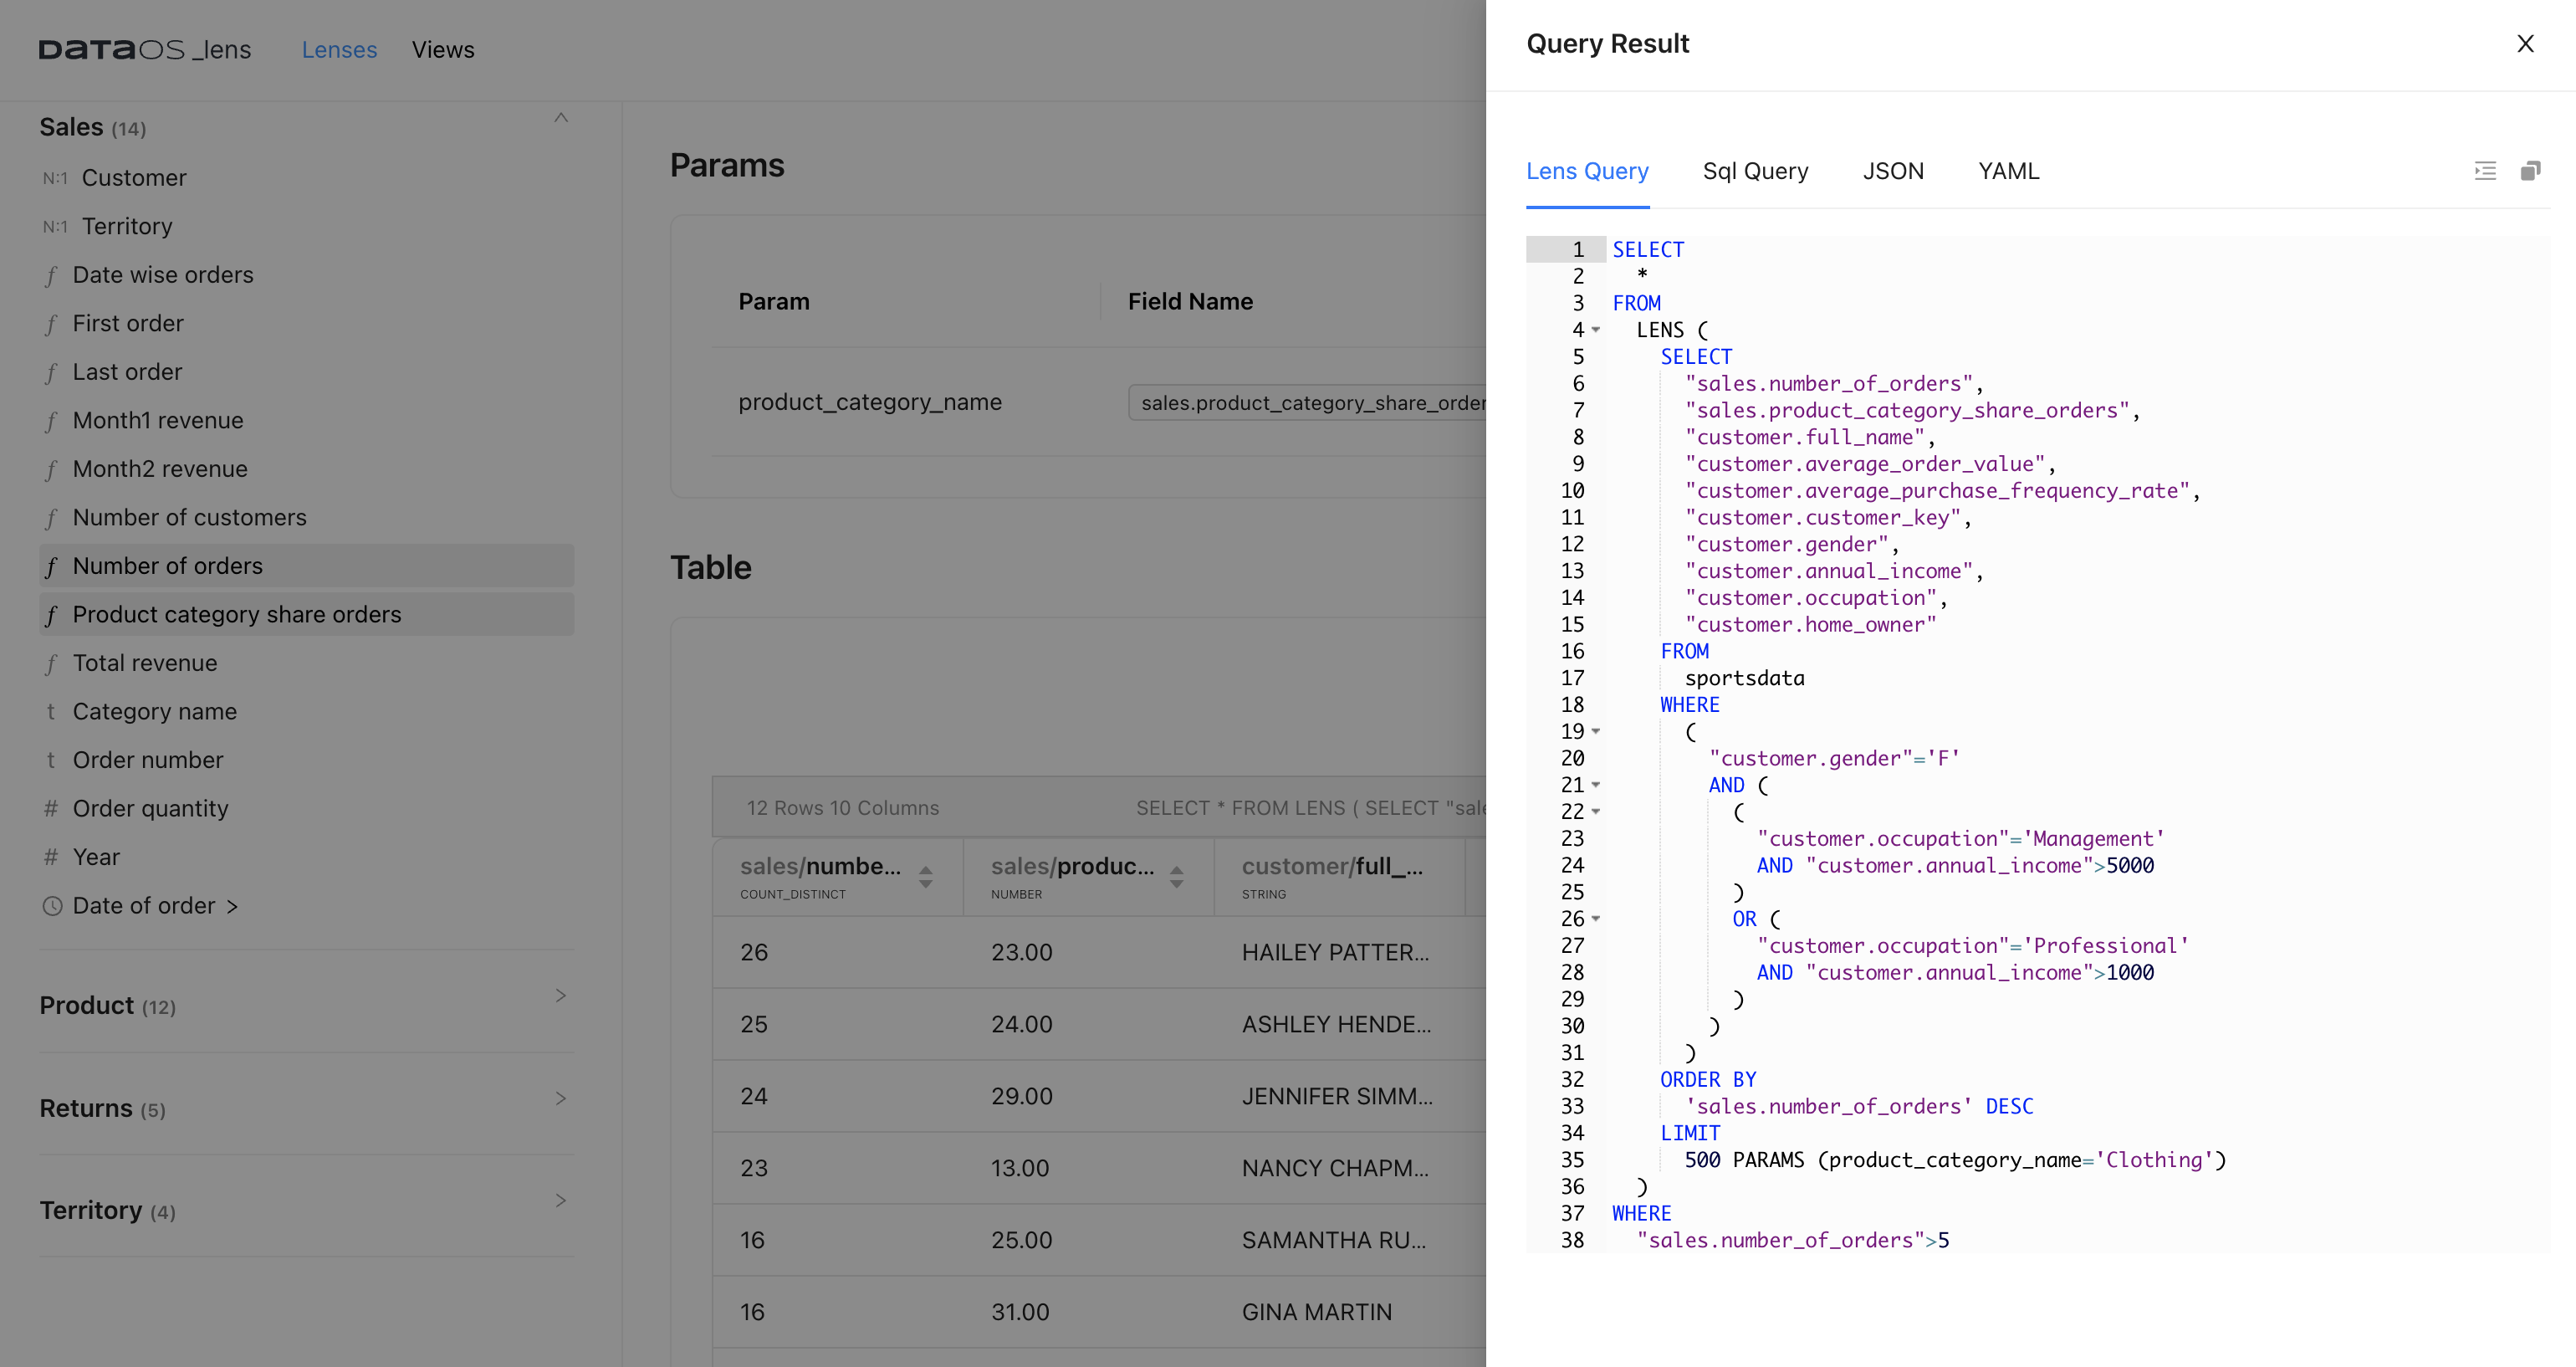
Click on the query seen in the table format of query result.
Saving and Sharing a Snapshot of Your Analysis
You can create a Lens View to take a snapshot of your analysis, capturing insights and visualizations obtained while exploring Lenses. It is a shareable compilation of your findings, making retrieving and collaborating on analytical insights easy.
Step 1: Creating a Lens View
To create a Lens View, you need to compose a query in Lens Explorer, analyze the result set as a table or chart, and then save the analysis as a View by providing a name and description for the View.
-
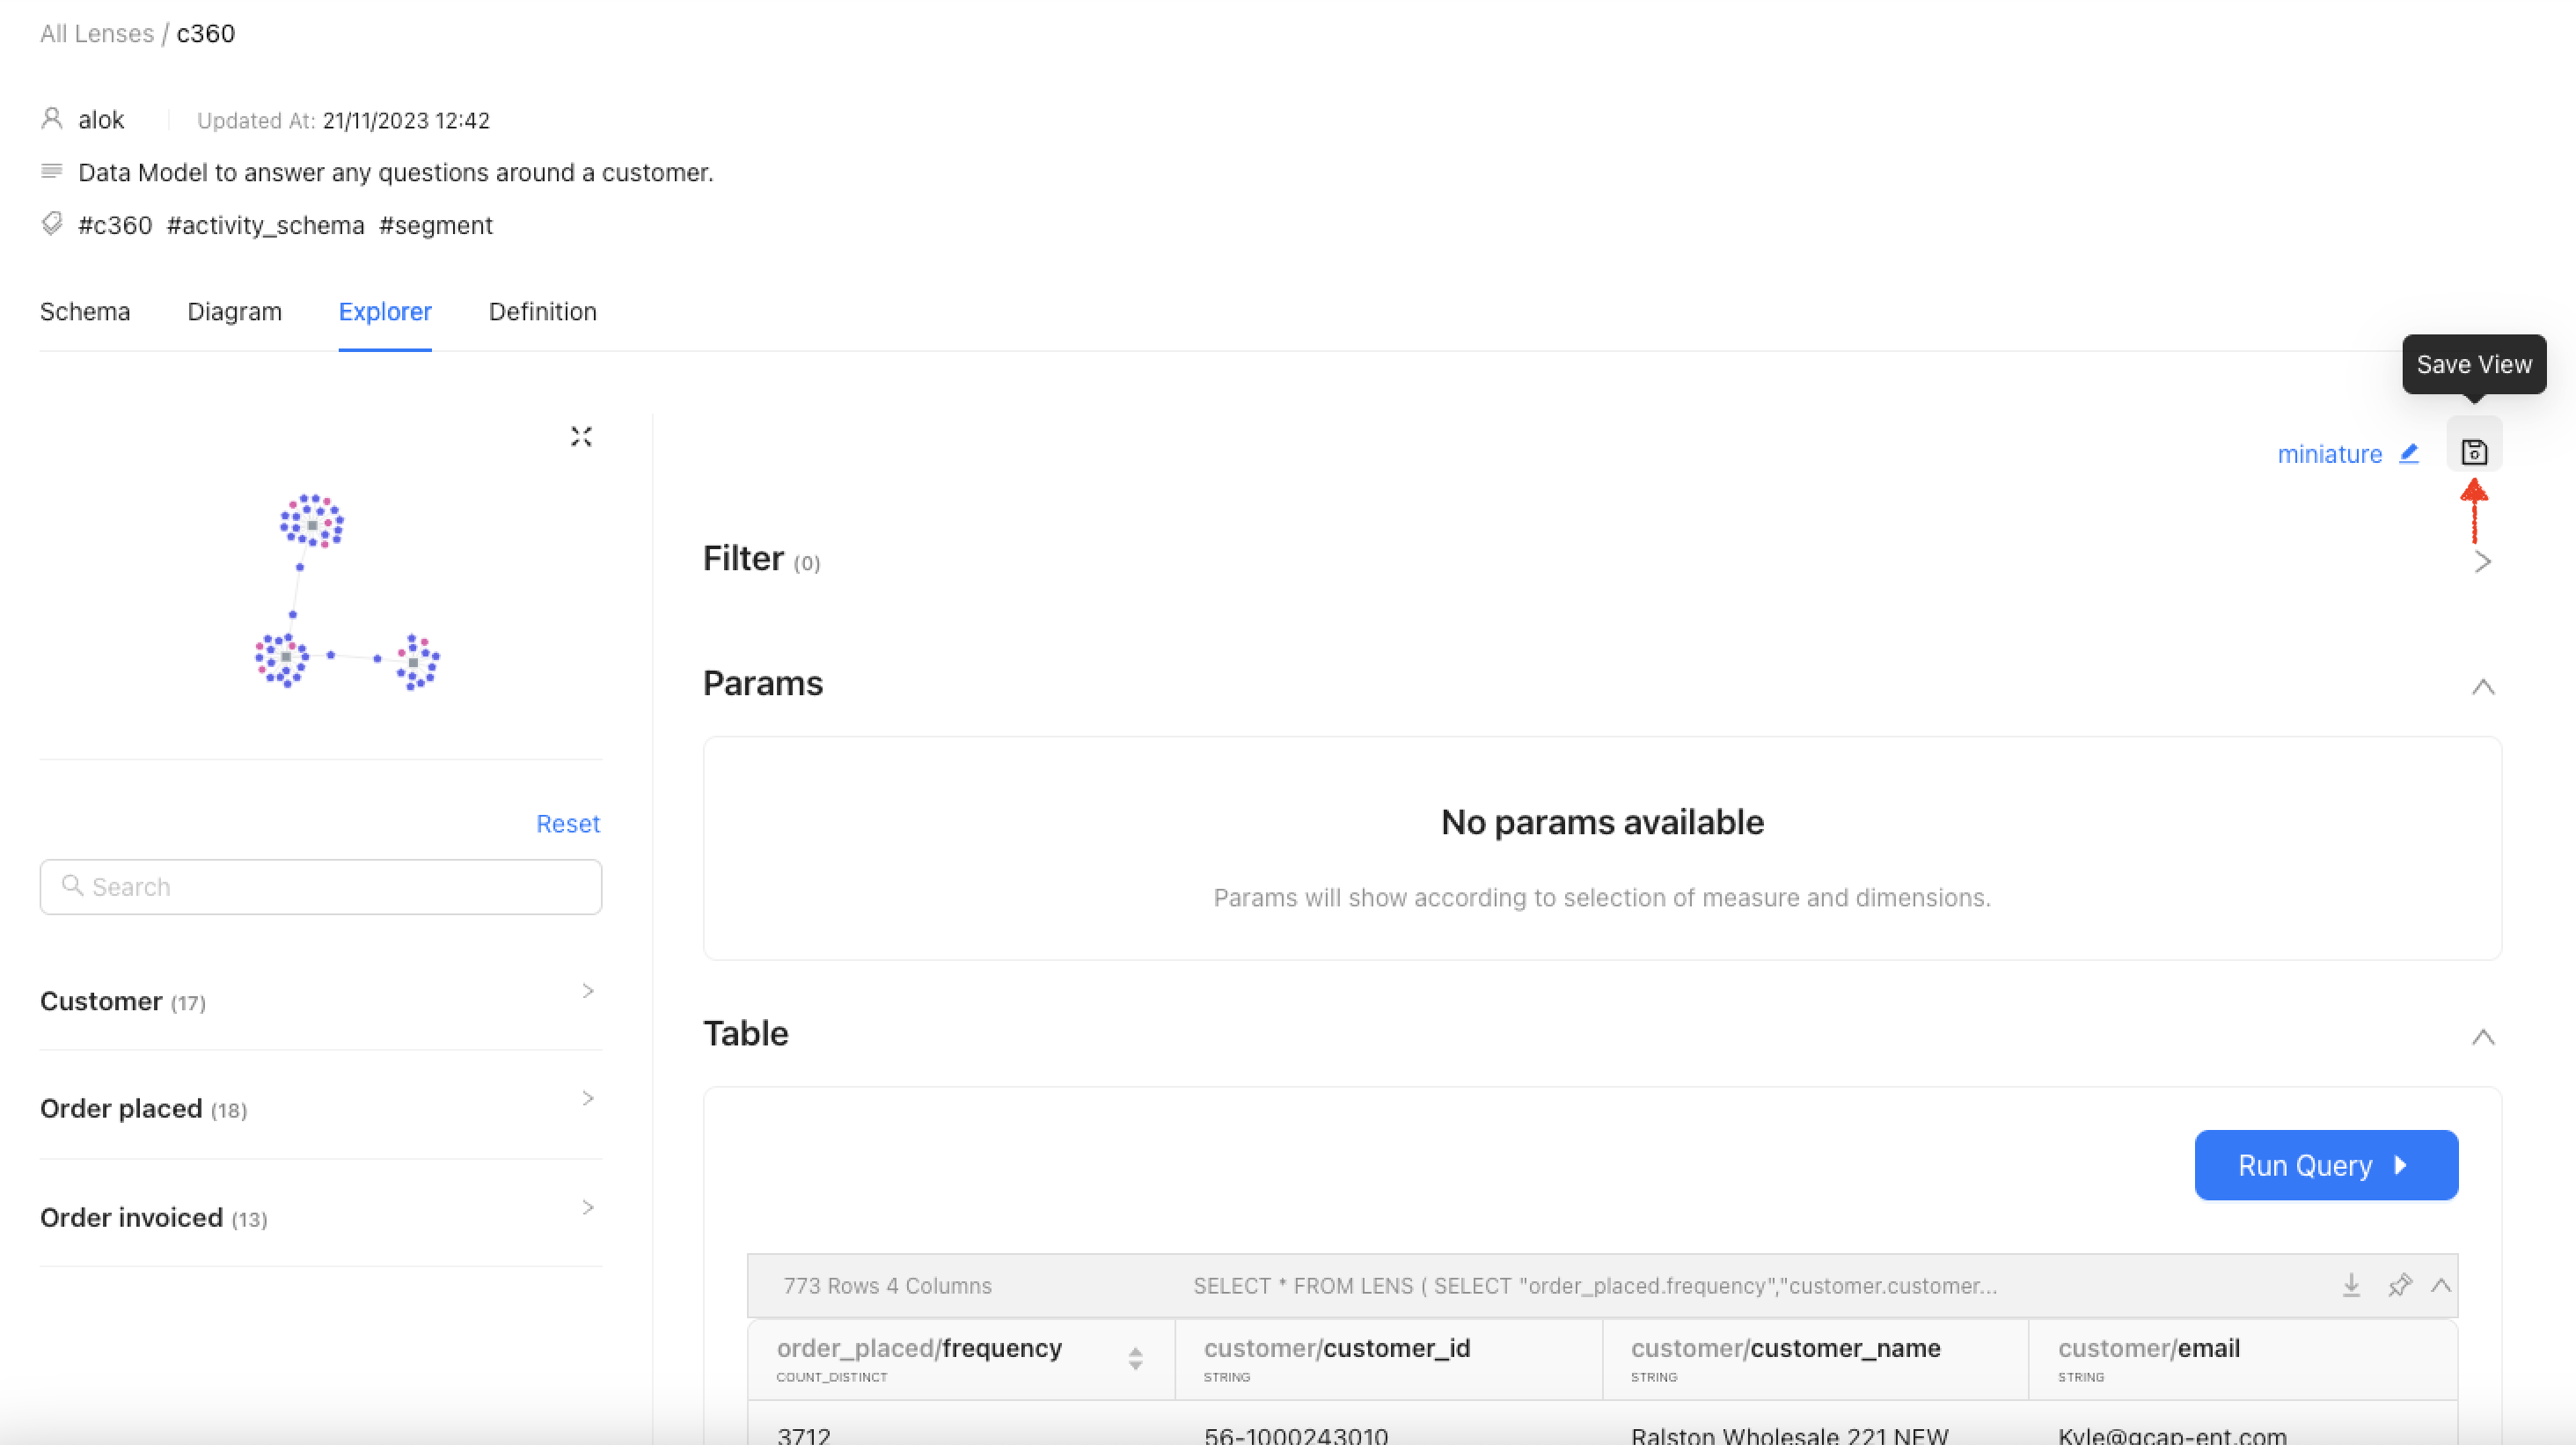
Compose a Query: Open Lens Explorer and compose your query by selecting the required dimensions and measures. suppose you want to highlight top users for a specific brand. So you select frequency, customer ID & name, order value and apply the filter for the specific brand.
-
Save the View: Once you've analyzed the result set as a table or chart, you'll see an option to save the analysis as a View. Provide a name and description for your Lens View. This helps identify and describe the insights captured in the View.
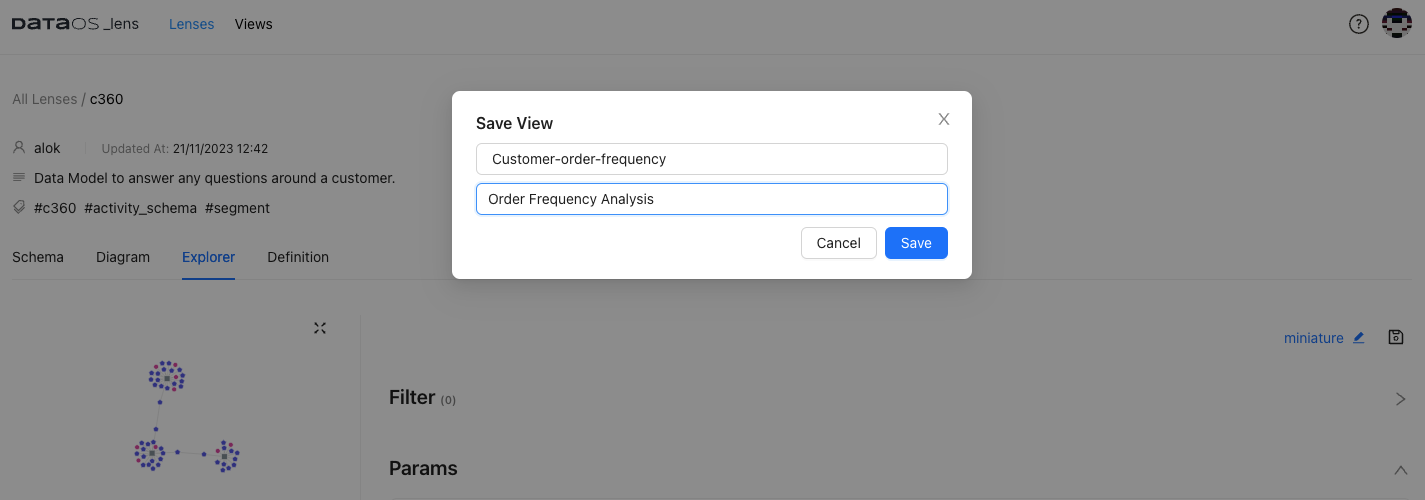
-
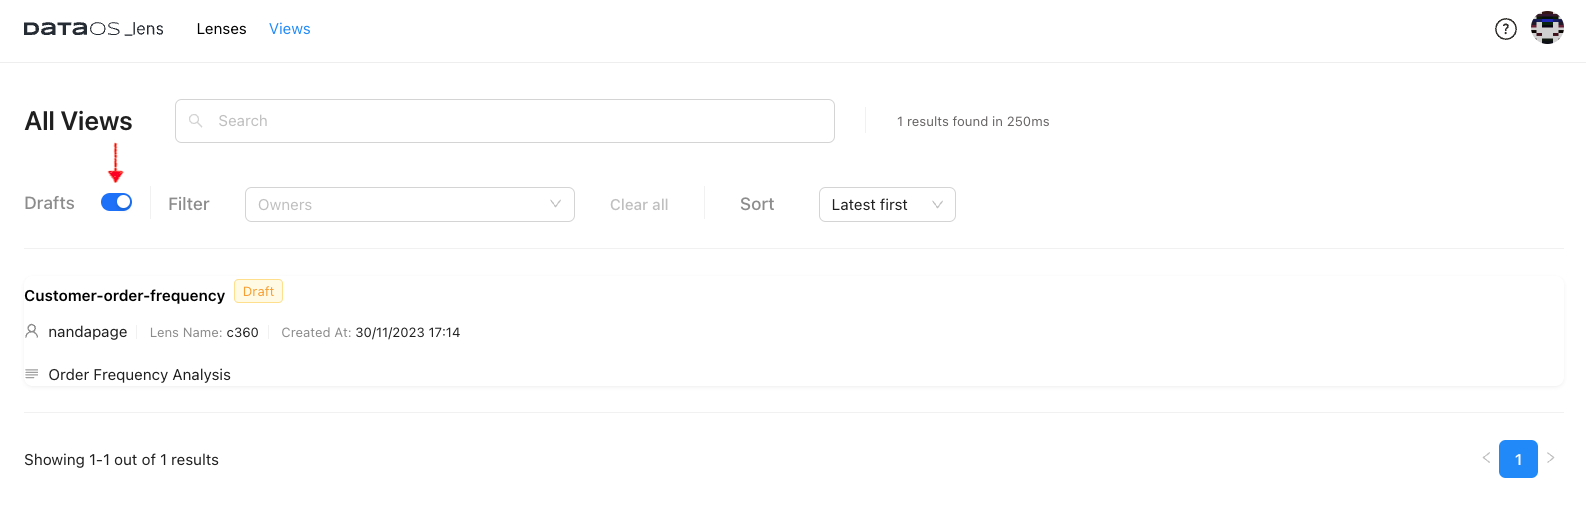
The View is now created and in Draft mode, accessible exclusively to its creator.
Step 2: Sharing Views
Publish the View: You need to publish the View to make it available to other users. Click on the "Publish" option to share it with others.
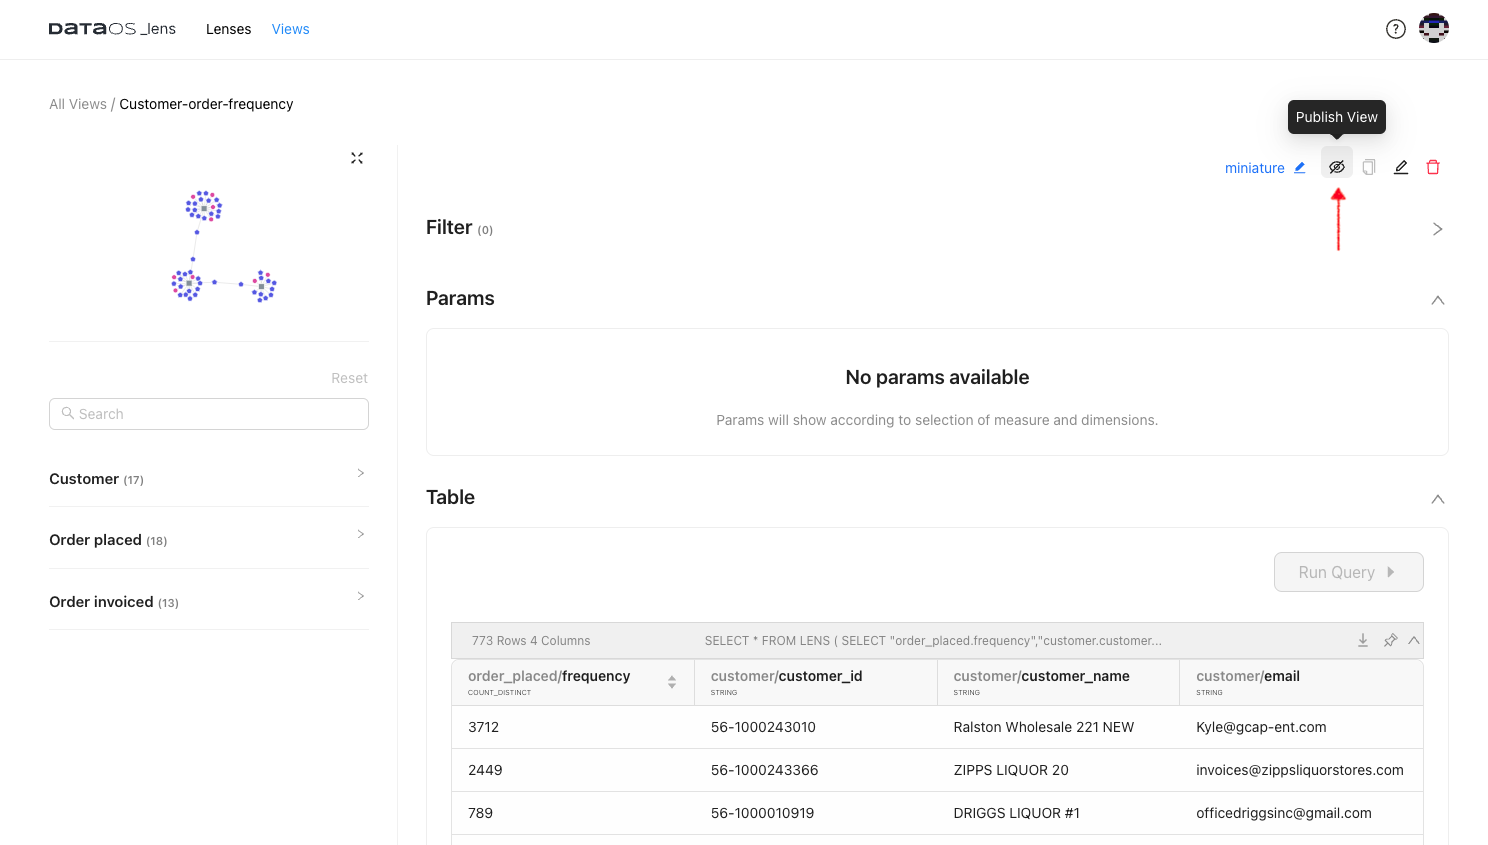
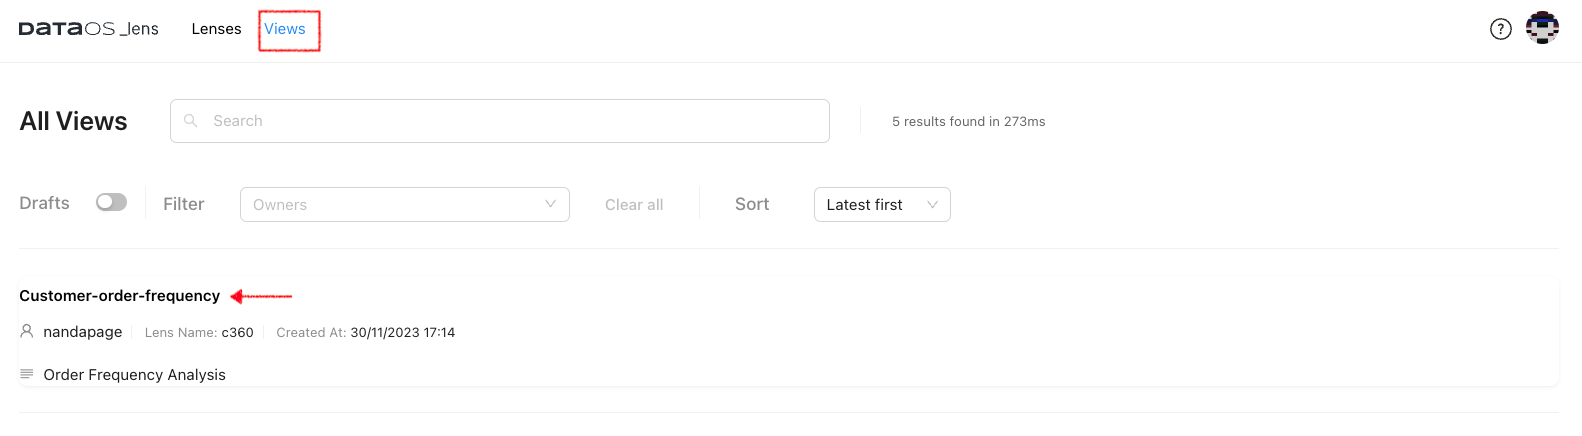
Once published, it will be removed from the draft mode and become available under Views.
Step 3: Cloning a Lens View
Cloning a Lens View allows you to create variations of existing Views without starting from scratch. We can easily analyze various scenarios. Follow these steps to clone a Lens View:
-
Navigate to View: Select the Lens View you want to clone.
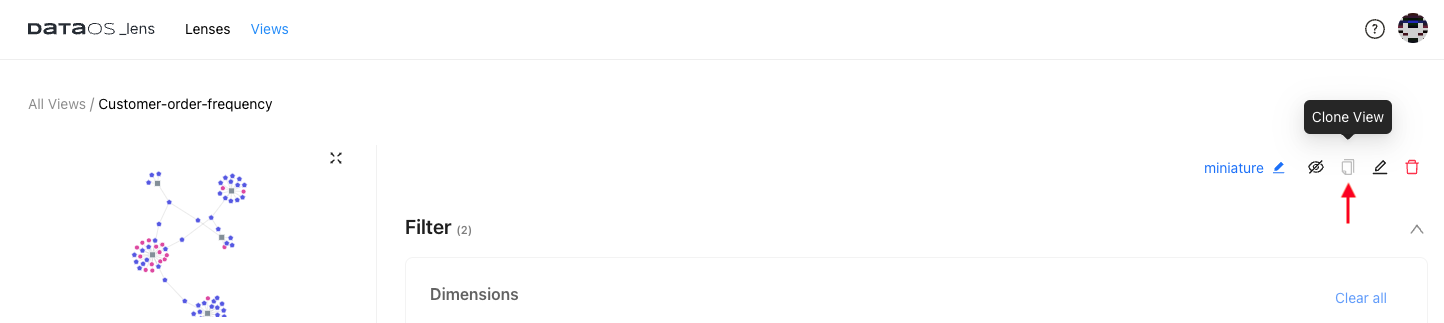
-
Clone View Icon: Click on the "Clone View" icon to create a cloned view.
-
Make Modifications: Customize the cloned view according to your requirements. Experiment freely with different dimension and measure selections. Click on “Run Query” to generate the view.
-
Save the Cloned View: Once the query execution is complete, you will see the Save View icon. Click on it and provide a new name and description.
.png)
Following these steps, you can create, publish, edit, and clone Lens Views to capture and share your analytical insights. Happy analyzing!!