Building Lens
Creating Lenses involves several key steps. Here's a structured guide to help you navigate the process.
Lens Modeling
Understanding Key Questions and Metrics
Before diving into lens modeling, it's essential to have a clear understanding of the questions you aim to address and the metrics required. Think about the aspects of your data that you want to analyze. For example, if you're working with sales data, you might want to know which products are selling best in different regions or which customers are making the most significant purchases. This outcome-oriented approach ensures that your lens aligns with your specific needs. So, you need to list the critical questions.
Example: In the retail industry, which provides consumers with access to a diverse range of products and services across the globe, the following are the critical concerns:
- Which products do users prefer in particular cities or states?
- In which state are these products most frequently sold?
- Who are the top users of these products?
- Which types of retailers sell particular categories of products?
- What are the most recent orders?
Understanding Data Elements
Begin by comprehending the data you're working with. DataOS Lens is composed of elements such as entities, relationships, fields, dimensions, and measures. The objective of these elements is to define the structure and logic of data models. These elements help develop a conceptual and logical data model that, when mapped to physical data, will enable meaningful insights from raw data, supporting decision-making processes.
- Entities are logical representations of an organization’s widely referred to and analyzed business concepts. They are the subjects or actors in the data. In the context of this use case, three primary entities are
Retailer,Order, andProduct - Fields, also known as attributes or columns, are individual data elements within an entity. Each field represents a specific piece of information about the entity. They are columns that uniquely identify an entity. For instance, in the "Retailer" entity, fields might include "retailer_id", “name", and "customer email”. In our use case,
retailer_idandproduct_idare fields. - Dimensions are categorical or qualitative attributes that provide context for measures. They describe the various ways data can be categorized or grouped. In an
Orderdataset, dimensions could includeorder_date,product_category, or geographic location such ascity. Dimensions allow for slicing and dicing data to gain different perspectives or aggregations. - Measures are quantitative, numerical values that can be aggregated or computed for analysis. They represent metrics or calculations based on fields and dimensions. Common measures include "total sales," "average customer age," or "maximum order quantity.”To solve our use case, we need to define measures like
total_retailers,total_order_quantity, etc. - Relationships between two entities can be one-to-one, one-to-many, or many-to-one. A defined relationship simplifies querying dimensions and measures from multiple entities. Entities would be joined based on the defined keys and relationships. In our use case, there are two relationships
- Retailer and Order Entity are joined on
retailer_idin a one-to-many relationship - Order and Product Entity are joined on
product_idin a many-to-one relationship
- Retailer and Order Entity are joined on
Creating a Data Model for Lens
The thumb rule for data modeling is to first define what your model would look like, what entities you need that are relevant to answering all your data questions, and how different entities would relate to each other. To achieve this, create a logical schema as the foundation, which can then be customized to create specific Lenses tailored to various use cases.
Begin with the following steps:
-
Identify Key Questions: Consider the key questions you need to answer with your lens. These questions can cover a wide range of aspects, including:
a. Customer Behavior: Understand customer behaviour by identifying metrics like the customer with the longest lifespan in months, the most frequently purchased items, and preferred products.
b. Product Performance: Evaluate product performance by identifying the top-selling products and those that are underperforming.
c. Product Quality: Assess product quality by analyzing customer returns. Determine how frequently customers return purchased items.
d. Pricing Strategy: Examine the impact of pricing changes on sales and profit margins. Investigate the influence of discounts on revenue generation.
e. Geographical Analysis: Explore regional variations in product preferences and purchasing behaviour to gain insights into your market.
These questions will help you identify the dimensions and measures (aggregated metrics like sales revenue, profit margin, and customer count) you need to include in your data lens.
-
Understand Your Data: This involves identifying the various entities or business objects within your dataset. These could be products, customers, orders, suppliers, or any other relevant entities.
- Select Relevant Attributes: Once you've pinpointed your key questions, select attributes (columns) from your entities that are relevant to answering those questions. These attributes will serve as your fields, such as product_id, type, product_name, etc or if you're interested in regional sales, you'd likely include attributes like "region" or "city."
- Evaluate Data Granularity: Think about the level of detail or granularity you need for your dimensions. These dimensions are columns containing categorical and qualitative data. Depending on your questions, you might choose dimensions that provide data at different levels, such as daily, monthly, or yearly.
- Consider Derived Dimensions: In some cases, you may need dimensions that don't directly exist in your dataset but can be derived from existing data using SQL expressions. For instance, you might calculate a "profit margin" dimension based on the "revenue" and "cost" columns. Define them under dimensions.
- Decide the metrics: Measures serve as a way to define specific business metrics based on aggregated data. To understand measures, think of them as aggregated numerical values derived from quantitative columns in the underlying table.
- Identify Relationships: You have identified entities and their attributes, but querying individual entities to arrive at answers isn’t enough. We need a holistic view, and for that, we need to join these entities together.
Here's a summary of entities and their attributes for the retail industry use case:
| Entity | Related To | Relationship | Fields and Dimensions | Measure |
|---|---|---|---|---|
| Retailer | Order | 1:N | retailer_id, type, name, chain, state, city | total_retailers |
| Order | Product | N:1 | order_id, retailer_id, order_date, inline_item_number, product_id, quantities, order_line_no | total_orders, total_order_quantity, recency |
| Product | product_id, product_name, product_category, disease_name | total_products |
For a deep dive into the data modeling concepts, we recommend referring to the comprehensive guide on Data Modeling.
YAML Syntax for Data Modeling
This forms the foundation for our Lens definition. Data engineers will expand upon it by establishing mappings to physical data using SQL.
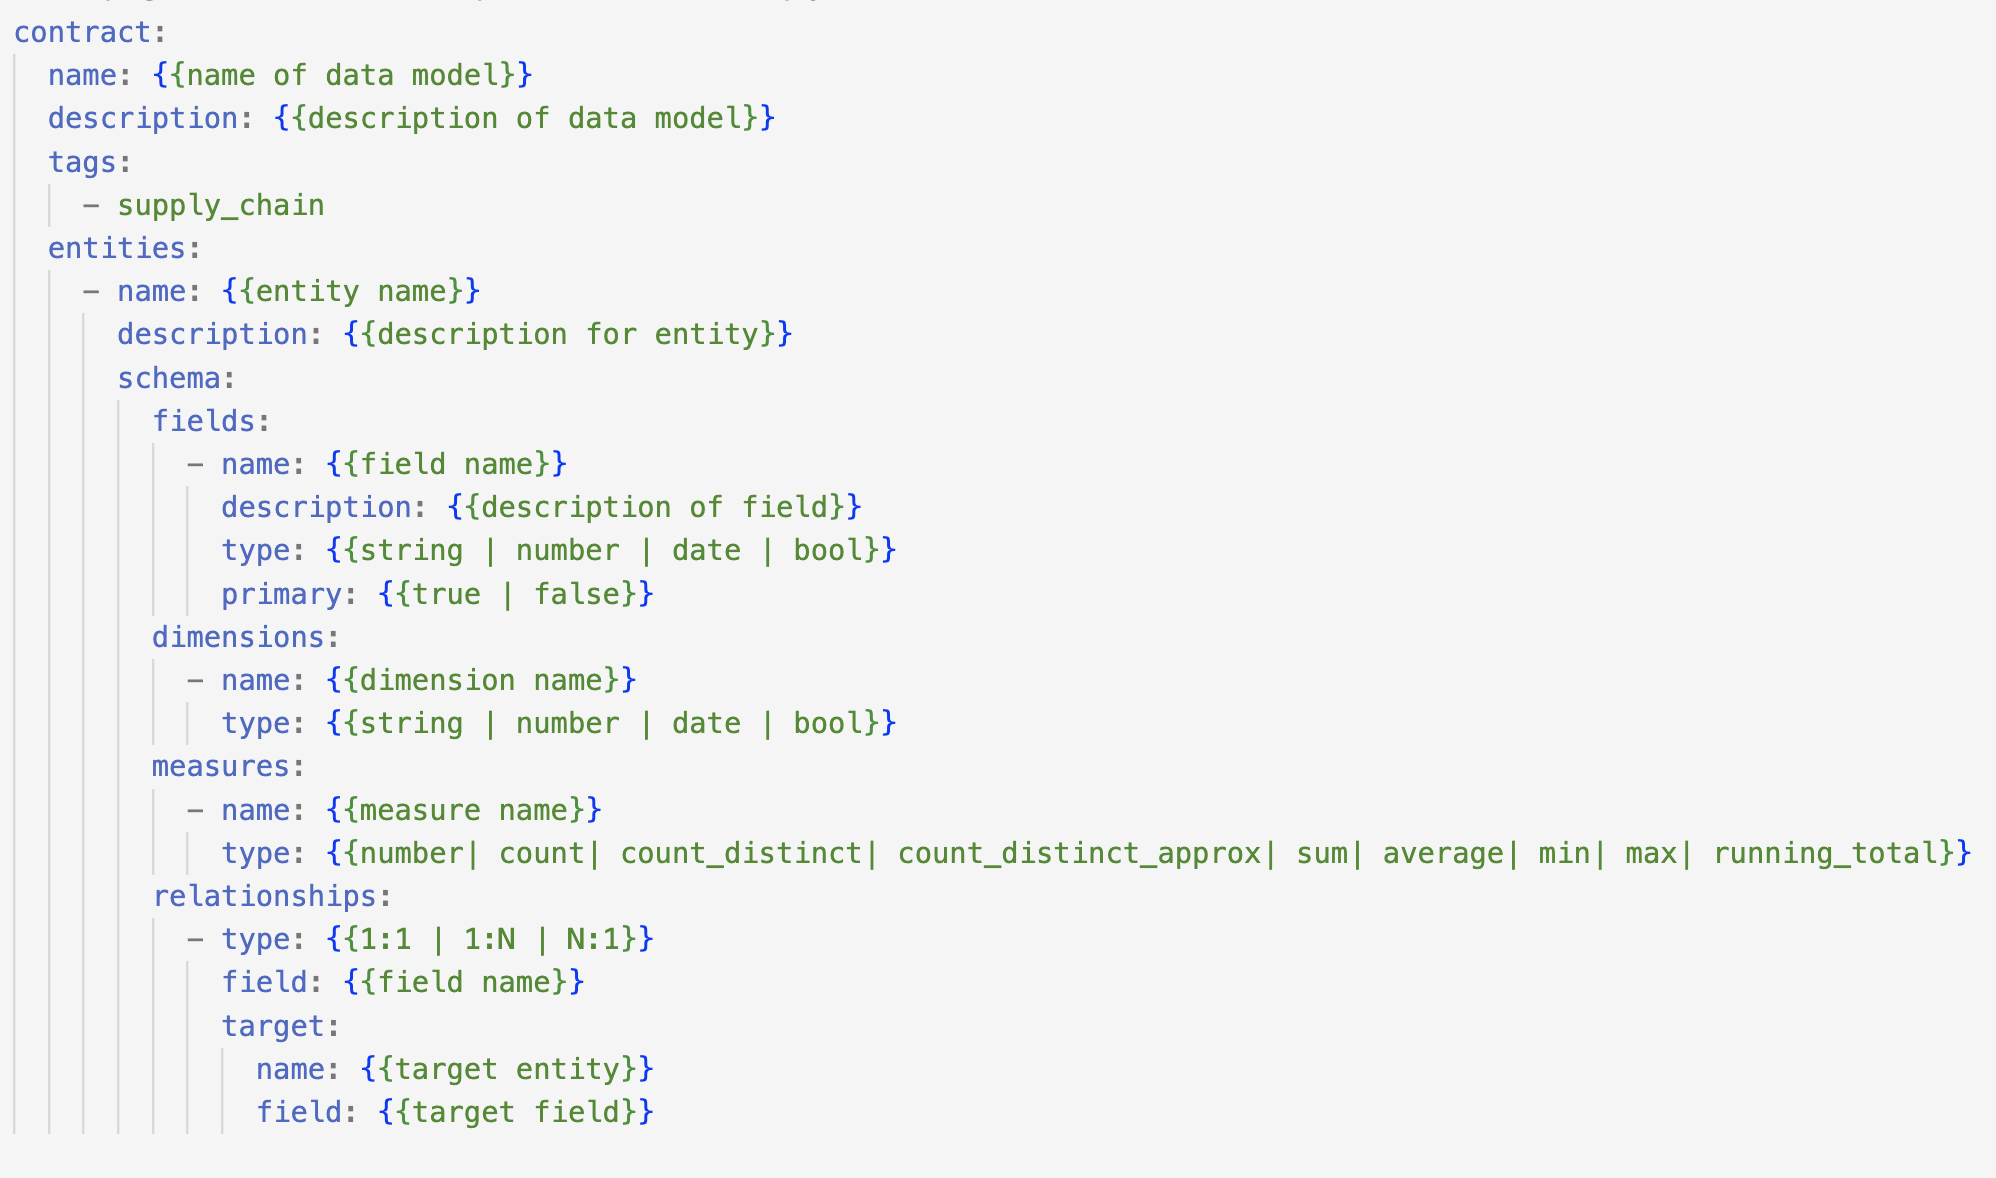
Example YAML for Retail Supply Chain Data Model
Data Model YAML
contract:
  name: supply_chain
  description: Logical schema for the supply chain model to explore specific business use cases
  tags:
    - supply_chain
  entities:
    - name: retailer
      description: This entity captures details of the retailer.
      schema:
        fields:
          - name: retailer_id
            description: Unique identifier of a retailer
            type: string
            primary: true
          - name: type
            type: string
          - name: name
            type: string
          - name: chain
            type: string
        dimensions:
          - name: state
            type: string
          - name: city
            type: string
        measures:
          - name: total_retailers
            type: count
        relationships:
          - type: 1:N
            field: retailer_id
            target:
              name: order
              field: retailer_id

    - name: order
      description: This entity captures all the orders placed for a product.
      schema:
        fields:
          - name: order_id
            type: string
            primary: true
          - name: retailer_id
            type: string
          - name: order_date
            type: date
          - name: inline_item_number
            type: number
          - name: product_id
            type: string
          - name: quantities
            type: number
        dimensions:
          - name: order_line_no
            type: string
        measures:
          - name: total_orders
            type: count_distinct
          - name: total_order_quantity
            type: sum
          - name: recency
            type: min
        relationships:
          - type: N:1
            field: product_id
            target:
              name: product
              field: product_id

    - name: product
      description: All details related to a product
      schema:
        fields:
          - name: product_id
            type: string
            primary: true
          - name: product_name
            type: string
          - name: product_category
            type: string
          - name: disease_name
            type: string
        measures:
          - name: total_products
            type: count
Defining Lens
Once your logical data model is in place, data engineers can start referring to it to construct Lens. Lens maps the attributes to the physical data.
Syntax of a Lens YAML
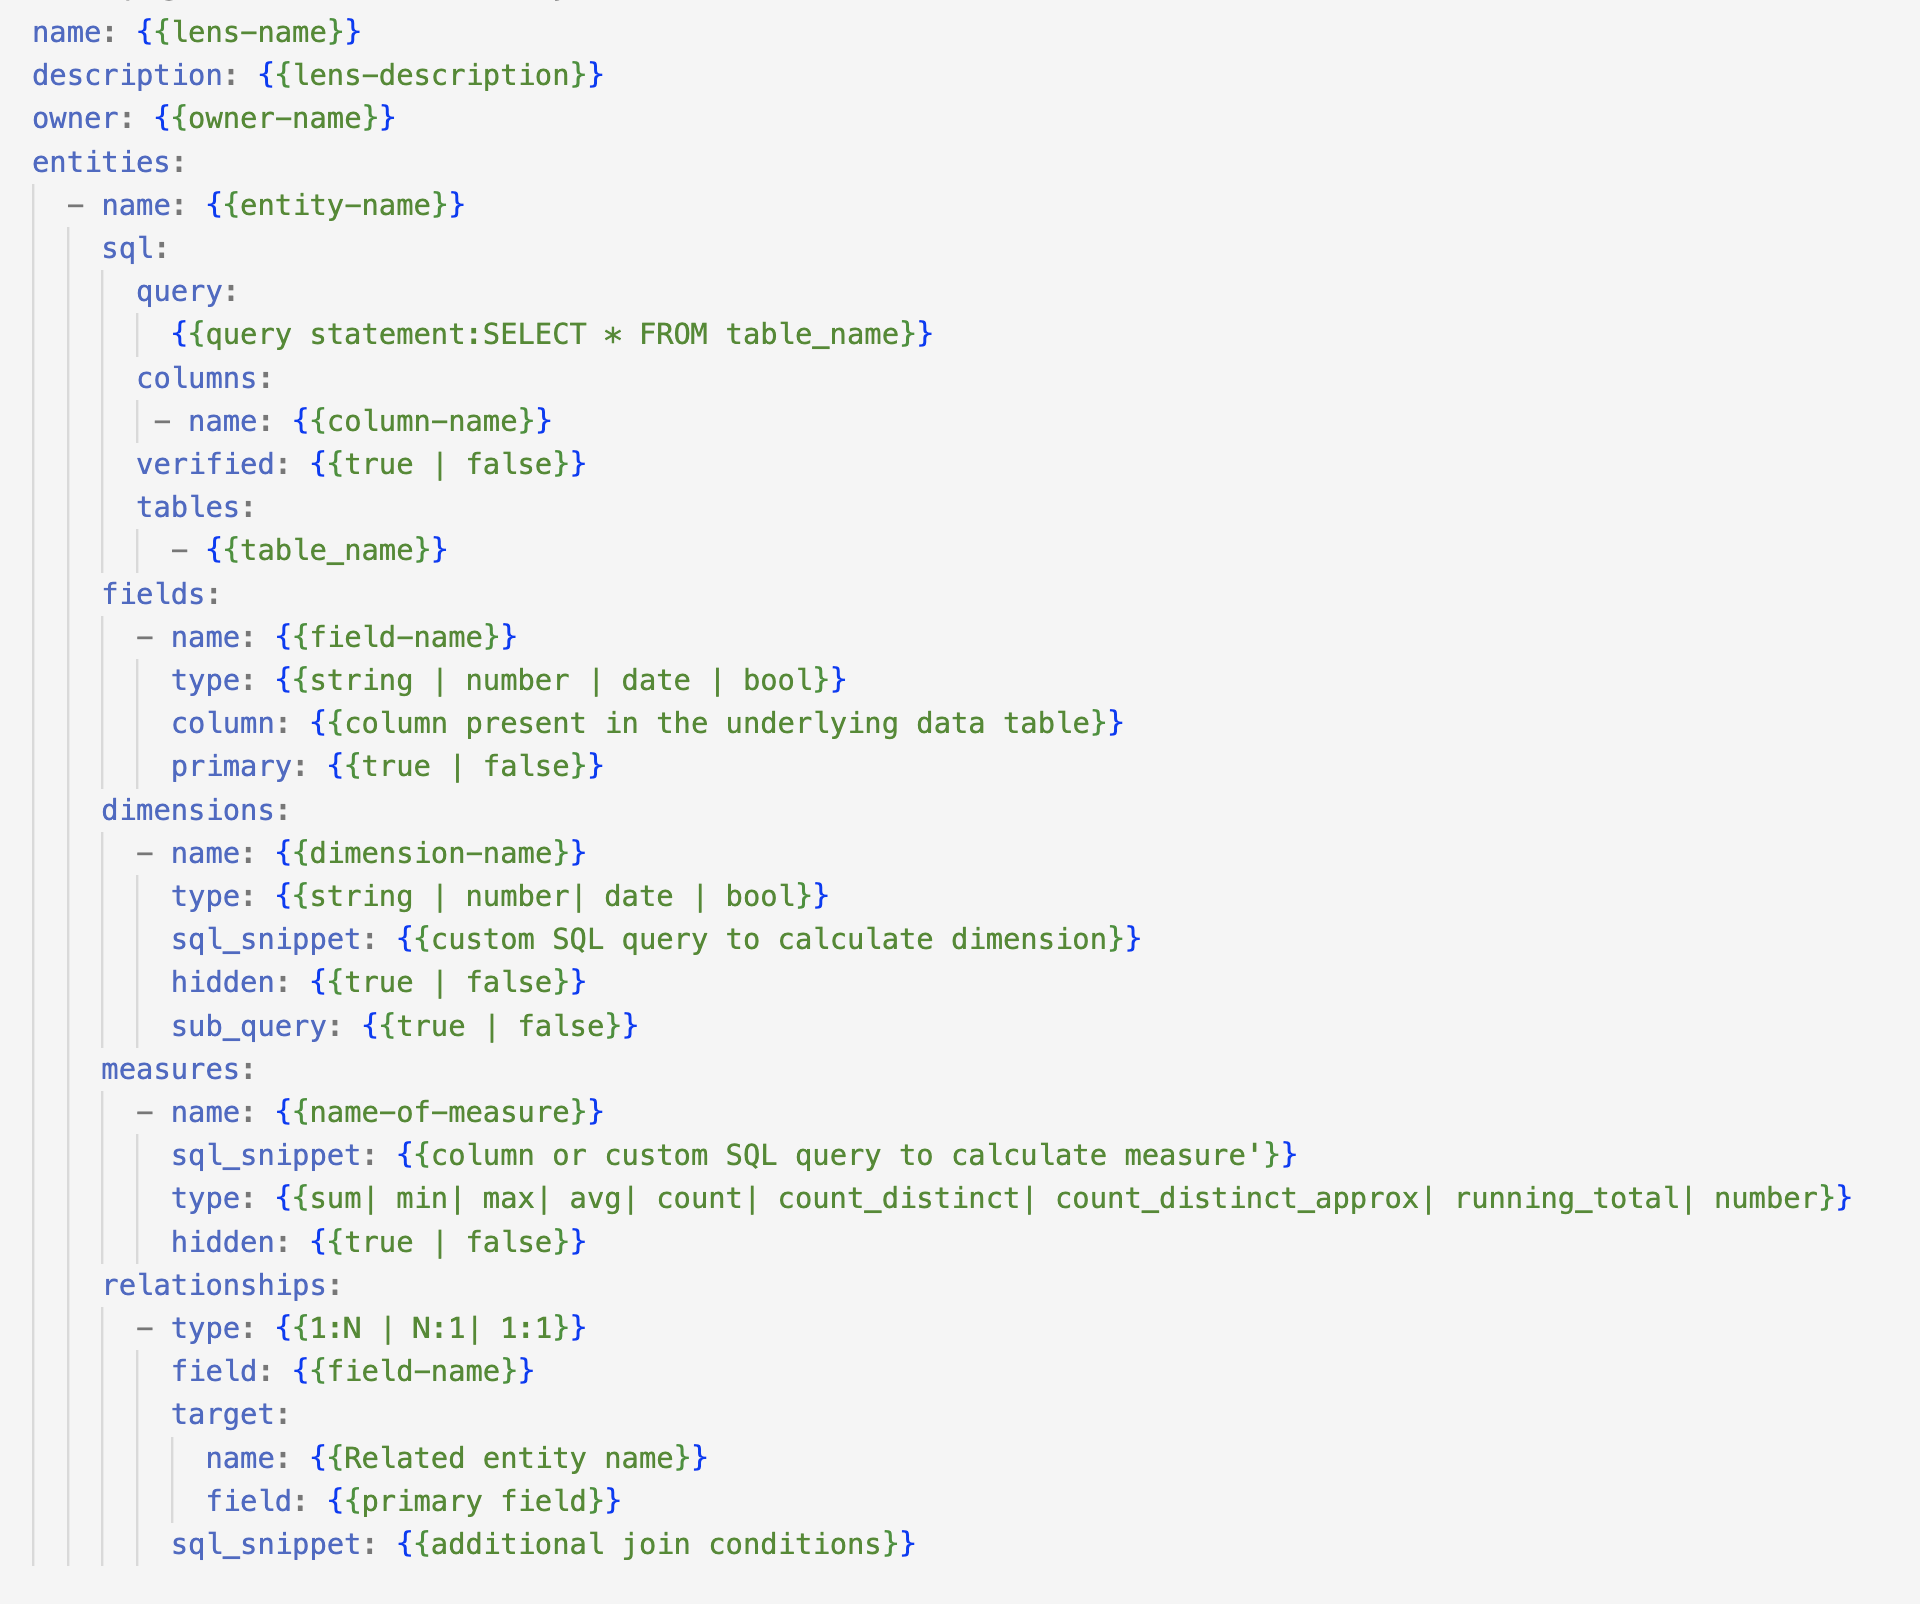
Creating a Lens YAML
To create a Lens, you need to configure the attributes of various sections within a Lens YAML. The sections are provided below:
For additional information regarding the various elements of the Lens, including their definitions, considerations and other details, please refer to Attributes of Lens YAML
The table below summarizes various attributes within the Lens YAML.
| Attribute | Data Type | Default Value | Possible Value | Requirement |
|---|---|---|---|---|
| entity | mapping | products, customers, orders, suppliers | Mandatory | |
| name | string | Mandatory | ||
| description | string | Optional | ||
| tags | string | Optional | ||
| sql | string | Mandatory | ||
| query | string | Mandatory | ||
| columns | string | Mandatory | ||
| tables | string | Mandatory | ||
| lenses | string | Optional | ||
| fields | mapping | Optional | ||
| name | string | |||
| type | string | |||
| description | string | |||
| column | string | |||
| primary | boolean | |||
| dimensions | mapping | Optional | ||
| name | string | |||
| description | string | |||
| type | string | |||
| sql_snippet | string | |||
| sub_query | string | |||
| hidden | boolean | |||
| measures | mapping | Optional | ||
| name | string | |||
| description | string | |||
| type | string | |||
| sql_snippet | string | |||
| rolling_window | string | |||
| hidden | boolean | |||
| relationship | mapping | Optional | ||
| field | string | |||
| target | mapping | |||
| name | string | |||
| field | string | |||
| description | string | |||
| type | string | |||
| sql_snippet | string |
Example Lens for Retail Supply Chain
Here's a comprehensive example of the 'Retail Supply Chain' Lens to drive our use case based on the previously created data model.Lens YAML
name: retail_supply_chain
description: Data Model to get started with lens
contract: supply_chain
owner: TMDC
tags:
  - supply_chain
entities:
# Let's create our first entity 'retailer'
  - name: retailer
    sql:
      query:
      >
        SELECT
          cast(retailer_id as varchar) as retailer_id,
          type,
          name,
          case when chain is null then 'Independent' else chain end as chain,
          state,
          city
        FROM
          icebase.supply_chain.retailer_info
      columns:
        - name: retailer_id
        - name: type
        - name: name
        - name: chain
        - name: state
        - name: city
      verified: true
      tables:
        - icebase.supply_chain.retailer_info
    fields:
      - name: retailer_id
        type: string
        description: unique identifier of the retailer
        column: retailer_id
        primary: true

      - name: type
        type: string
        description: retail format
        column: type

      - name: name
        type: string
        description: name of the retailer
        column: name

      - name: chain
        type: string
        description: corporate chain of the retailer
        column: chain

      - name: state
        type: string
        description: name of state where the retailer is located
        column: state

      - name: city
        type: string
        description: name of city where the retailer is located
        column: city
    measures:
      - name: total_retailers
        sql_snippet: ${retailer.retailer_id}
        type: count
        description: total retailers
    relationships:
      - type: 1:N
        field: retailer_id
        target:
          name: order
          field: retailer_id
# Let's jump on to creating the second entity 'product'
  - name: product
    sql:
      query: >
        SELECT
          product_id,
          product_name,
          product_cat as product_category,
          product_condition as disease_name
        FROM
          icebase.supply_chain.product_info
      columns:
        - name: product_id
        - name: product_name
        - name: product_category
        - name: disease_name
      verified: true
      tables:
        - icebase.supply_chain.product_info
    fields:
      - name: product_id
        type: string
        description: unique identifier of the product
        column: product_id
        primary: true

      - name: product_name
        type: string
        column: product_name
        description: name of the product

      - name: product_category
        type: string
        column: product_category
        description: name of the product category

      - name: disease_name
        type: string
        column: disease_name
        description: disease or health symptom for which the product is being used
    measures:
      - name: total_products
        sql_snippet: ${product.product_id}
        type: count
        description: count of total products
# You there...... Let's move onto the final entity 'order'
  - name: order
    sql:
      query: >
        SELECT
          order_id,
          cast(retailer_id as varchar) as retailer_id,
          from_unixtime (round(cast(order_datetime AS double) / 1000, 0)) AS order_date,
          inline_item_number,
          product_ids as product_id,
          quantities
        FROM
          icebase.supply_chain.retail_order_line_item
        where order_datetime is not null

      columns:
        - name: order_id
        - name: retailer_id
        - name: order_date
        - name: inline_item_number
        - name: product_id
        - name: quantities
      verified: true
      tables:
        - icebase.supply_chain.retail_order_line_item
    fields:
      - name: order_id
        type: string
        column: order_id
        primary: true
        description: unique identifier of the order

      - name: retailer_id
        type: string
        column: retailer_id
        description: unique identifier of the retailer

      - name: order_date
        type: date
        column: order_date
        description: date of the order placement

      - name: inline_item_number
        type: number
        column: inline_item_number
        description: order line sequence number

      - name: product_id
        type: string
        column: product_id
        description: unique identifier of the product

      - name: quantities
        type: number
        column: quantities
        description: total quantities of the product ordered
    dimensions:
      - name: order_line_no
        type: string
        sql_snippet: concat(${order.order_id},'-',${order.inline_item_number})
        description: unique identifier of the order line number
    measures:
      - name: total_orders
        sql_snippet:  ${order.order_id}
        type: count_distinct
        description: total distinct orders

      - name: total_order_quantity
        sql_snippet:  ${order.quantities}
        type: sum
        description: total order quantity

      - name: recency
        sql_snippet: day(current_date - ${order.order_date})
        type: min
        description: days since last order was placed

    relationships:
      - type: N:1
        field: product_id
        target:
          name: product
          field: product_id
        verified: true
Deploying Lens
After defining the Lens, the next step is to deploy it into the DataOS environment. To get started, follow the steps:
Step 1: Get the Environment Token or API Key
- Get the environment token or API Key from the profile section of the current environment. To get the API Key from DataOS, click here.
Step 2: Install Postman
- Install Postman from the following link:
- After completing the installation, you can begin building and exploring Lenses using Postman.
Step 3: Building and Exploring Lenses
Create a lens or update an existing Lens.
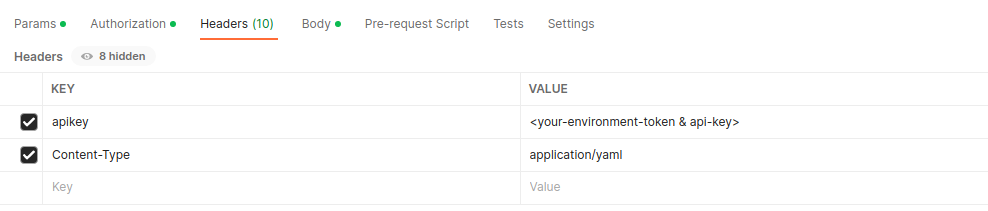
- In the ‘Headers’ section, add the following headers:
- Write Lens in the ‘Body’ Section. Choose ‘raw’ as the text format
- In the ‘Param’ section, select dryrun=false.
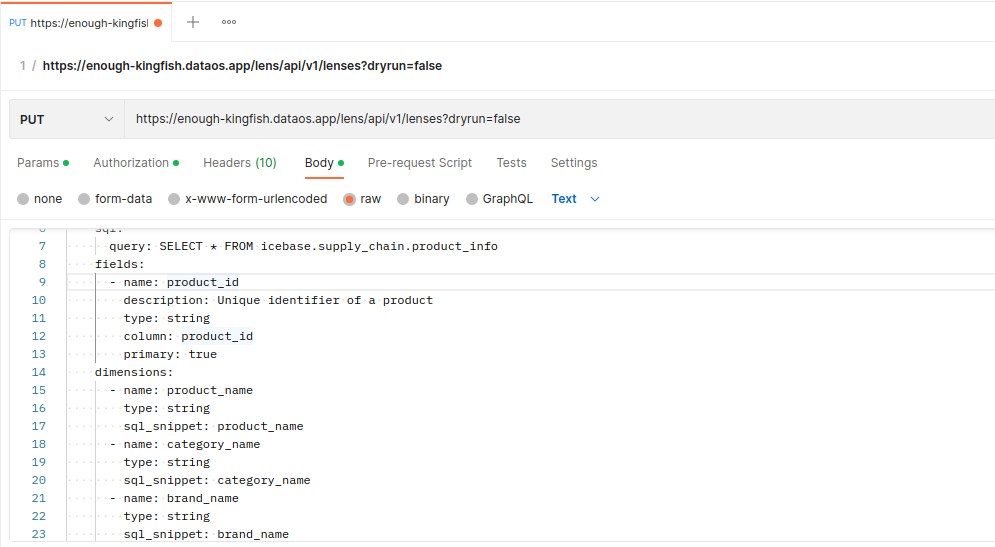
- To upsert the Lens:
- Select PUT.
-
Add the following URL -
https://{{dataos-instance}}/lens/api/v1/lenses?dryrun=falseand click on the ‘Send’ button.Example: https://enough-kingfish.dataos.app/lens/api/v1/lenses?dryrun=false
Querying Lens
Once you've successfully deployed the Lens, you can begin querying and exploring it within the DataOS environment. You have two primary options for this:
- Lens Explorer: You can use Lens Explorer, which provides a user-friendly, low-code interface for exploring modeled ontologies.
- Lens Query (Abstracted SQL): Alternatively, you can utilize Lens Query, an abstracted SQL query language, via the WorkBench tool for more advanced querying and exploration.
Let’s explore an analytical question through Lens Query:
Data Question
Explore the states where the total order quantity was more than 100,000 in the disease product category.
Using Lens Explorer
- Select the Lens and navigate to the Explorer section.
- Within the Lens Explorer, choose the state from
Retailerand the total order quantity measure fromOrderEntities. - To add a filter, open the Filter Pane, add a new rule to the Dimensions, select
product.product_categoryand select the ‘==’ symbol, and type disease in the adjacent box (REMEMBER: though it’s a string, don’t use single or double quotes while typing disease) - To narrow down to states with more than 100,000 orders, add a rule to the Measures section and choose the measure
order.total_order_quantity, then select the ‘>’ symbol and type 100000 in the adjacent box (don’t use quotes). - Now click Run Query.
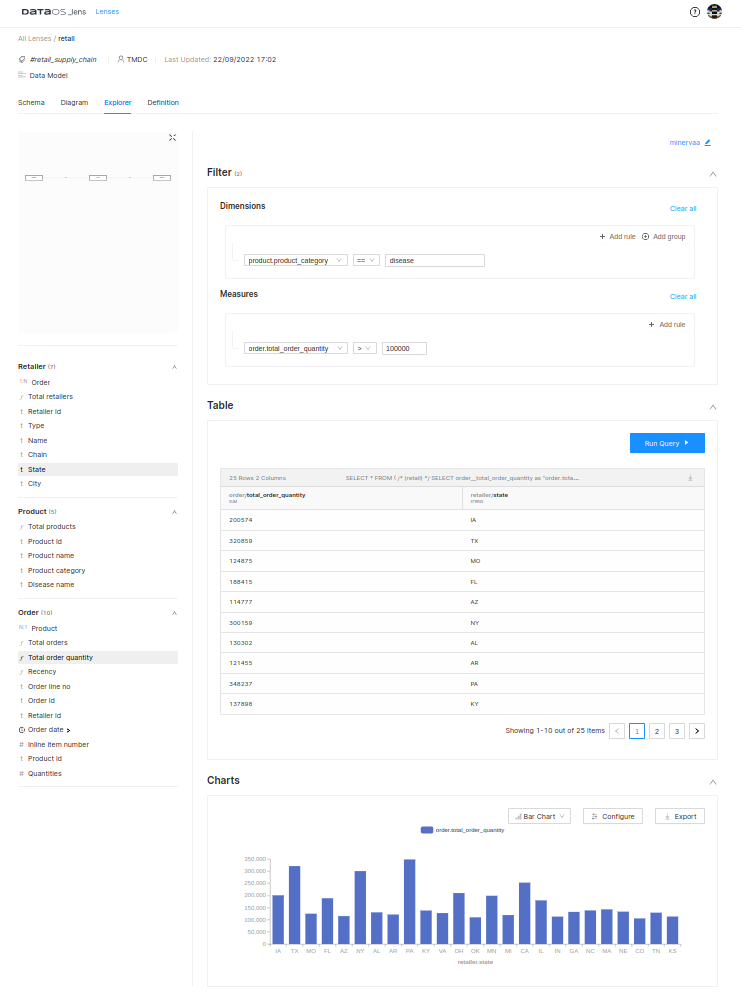
The table in the diagram above displays states with total order quantities exceeding one hundred thousand. Additionally, there's a customizable bar chart at the bottom that you can configure and export according to your requirements.
Using Lens Query in Workbench
-
Open the Workbench from the Main Menu and execute the below Lens Query
-
You will get a table showing states with a total order quantity of more than 100 thousand in the specific product category.
The pre-modeled Lens opens up possibilities for addressing various use cases. In case the existing Lens doesn't meet your current requirements, you have the flexibility to create a new lens or introduce new entities as needed.
Dynamic Parameters
Sometimes, you may need to customize the results of your query based on specific inputs at runtime. For instance, you might want to see the running total of items sold for a particular product category or the monthly active users for a specific month. However, you want the flexibility to define these parameters at runtime. This is where you can use dynamic parameters, 'params'. You can include these params in your Lens definition.
When you want to input values during the query execution, 'params' should be employed. Define these parameters in the fields, dimensions, or measures where you intend to use them.
Consider this example, where we want to find the monthly active user and let the month be defined during the query time, for which we need the count of users. We have defined a measure month active users, and to define param to get month input during the query time, we use the following format: {{key:value}}.
Let's take an example where we aim to find the monthly active users, and we want to specify the month when executing the query to obtain the user count. To achieve this, we have created a measure called "monthly active users." To define a parameter that allows us to input the month during the query execution, we use the following format: {{key:value}}.
measures:
  - name: monthly_active_user
    type: count
    sql_snippet: case when month(${visitedcampaign.ts_}) = {{month:2}}  then entity_id else null end
The value given here will be the default value.
And while running this query on the Workbench, you can input the parameters as follows:
LENS (
    SELECT
     visitedcampaign.monthly_active_users
    FROM
test_extend
# give params input as follows
PARAMS (month=3)
)
On Lens Explorer, you will get an additional input box for the parameter to provide a new value.
Params are useful to power multiple use cases without having to define multiple measures or dimensions per use case. In the following article, we will demonstrate how Params can be leveraged in different scenarios.
Scenarios: Dynamic Parameters in Query
Tutorial: Sports Retail Data Lens Creation
This tutorial walks you through the complete process of developing and designing a Sports Retail Data Lens. By following these steps and considering your data, questions, and user needs, you can effectively determine the dimensions to incorporate into your lens for a meaningful data exploration and analysis experience.