Monitor the CPU and Memory Usage of a Workflow
CPU and memory analytics can only be viewed via Operations and Grafana for Workflows that are in a running state or are scheduled and the steps are similar to Services. If a Workflow has already succeeded or failed its CPU and memory analytics will no longer be accessible through Operations and Grafana. Use the Metis Catalog to view historical data in such cases.
Metis Catalog
This section explains how to monitor the overall CPU and memory usage of a Workflow in DataOS using the Metis UI. Since each Workflow in DataOS runs as a Kubernetes pod this information helps users evaluate runtime efficiency validate resource configurations and troubleshoot performance issues such as throttling or memory exhaustion.
To monitor the CPU and memory usage of a Workflow on the Metis Catalog UI follow the steps below:
-
Open the Metis Catalog.

Open the Metis Catalog (Metis UI) -
Search for the Workflow by name.
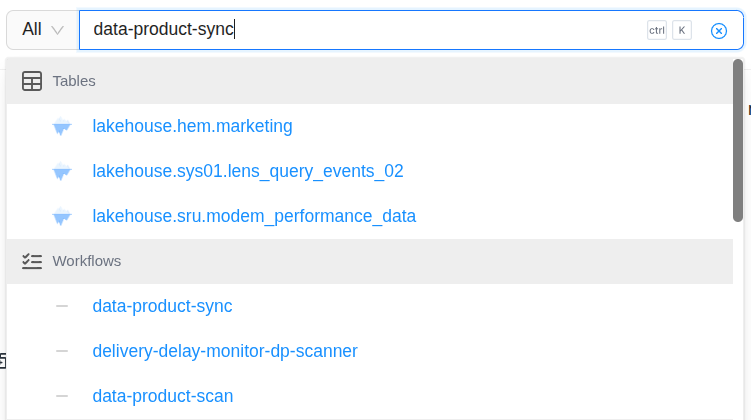
Search the Workflow in Metis -
Click on the Workflow that needs to be monitored and navigate to the ‘Run History’ section.
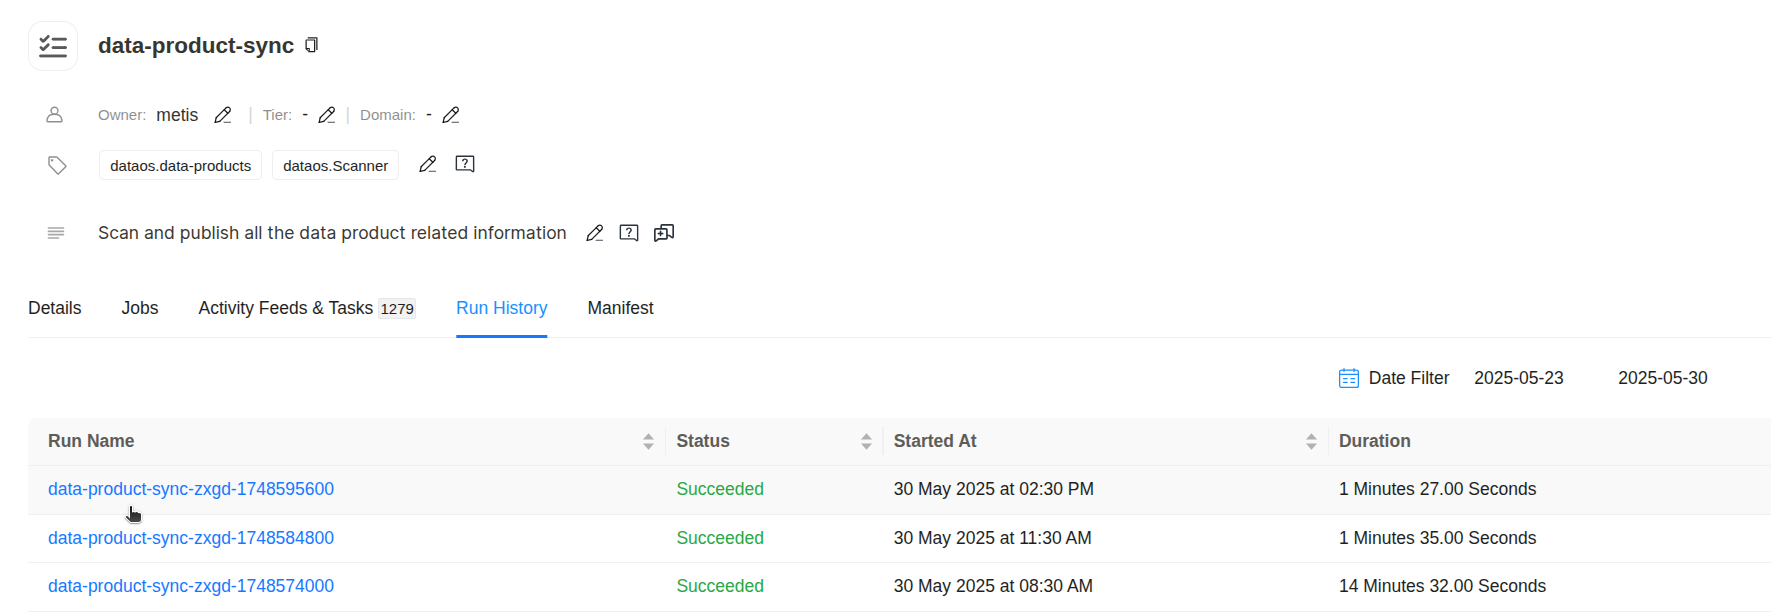
Workflow run history in Metis Breakdown of the Components:
data-product-sync: This is the base name of the Workflow. It signifies that the execution relates to the synchronization of Data Product metadata typically involving scanning the Data Product information into the Metis catalog.zagd: This segment helps in disambiguating multiple concurrent executions within the same logical job group.<epoch_timestamp>: This is a Unix epoch timestamp (in seconds) uniquely identifying the specific instance of the pipeline run. For example1748569600converts to30 May 2025 at 02:30 PM UTCmatching the “Started At” column. This timestamp ensures uniqueness and traceability across executions allowing for precise correlation with system logs events and downstream data updates.
-
Click on any run name for which you want to monitor the CPU and memory usage and navigate to the ‘Usage’ section.
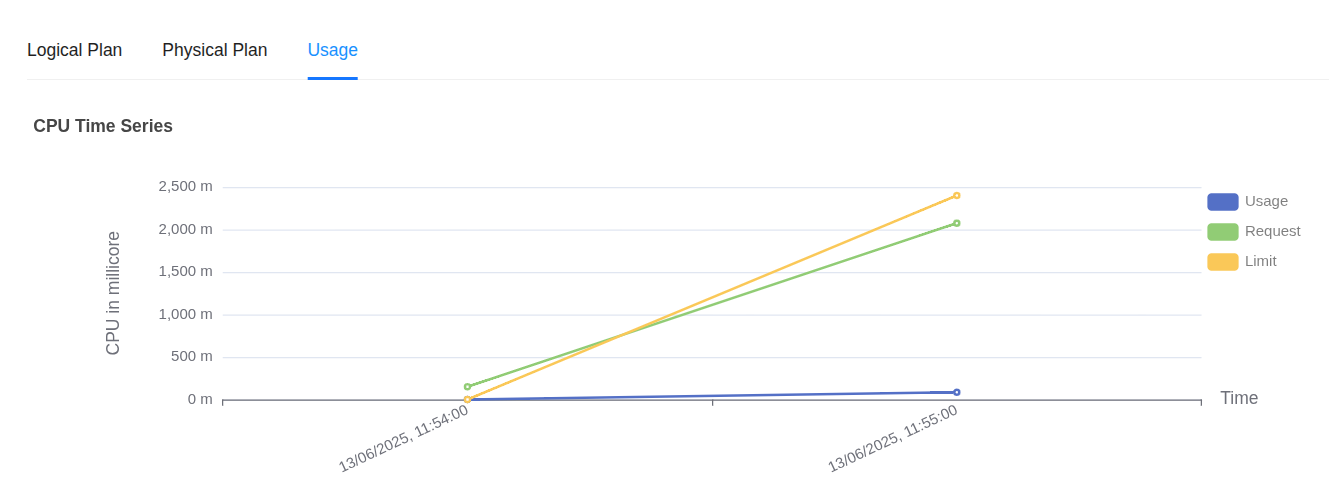
Workflow Usage charts CPU usage:
- Usage (blue line) shows actual CPU consumed by the Workflow pod remaining well below 500 millicores.
- Request (green line) is around 2000 millicores meaning the pod was scheduled with a guaranteed 2 cores.
- Limit (yellow line) is around 2500 millicores the maximum CPU the pod can consume if available.
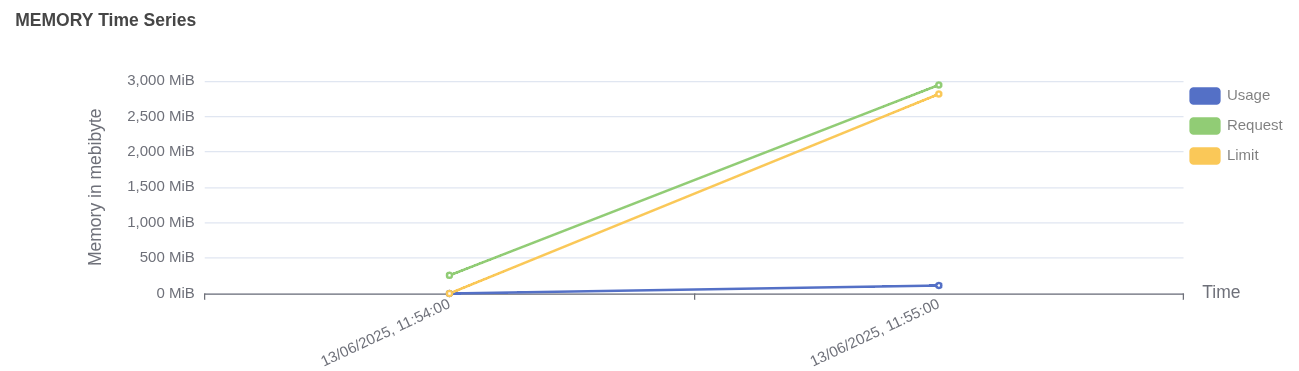
Pod memory usage vs request and limit Memory usage:
- Usage (blue line) remains under 1000 MiB.
- Request (green line) is around 2800 MiB the guaranteed memory reserved for the pod.
- Limit (yellow line) is around 3000 MiB the upper cap for memory consumption.
-
Under the Usage section you can also find an aggregate usage summary of a Workflow.
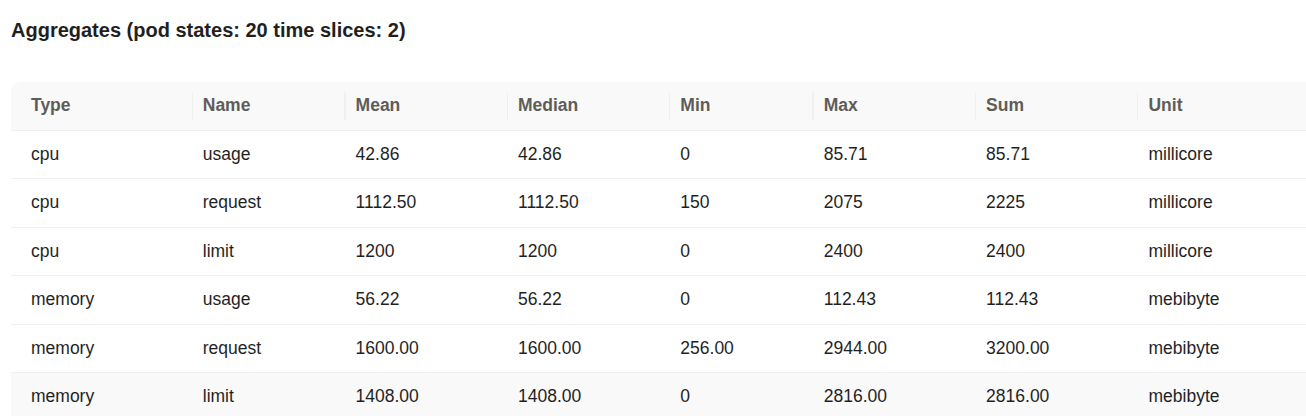
Aggregated CPU and memory statistics Details:
- Type: Indicates whether the metric refers to CPU or memory.
- Name: Describes the metric subtype
usage(actual consumption)request(minimum reserved) orlimit(maximum allowed). - Mean / Median / Min / Max: Statistical summaries of the metric across the collected time slices.
- Sum: Total cumulative value of the metric over all time intervals.
- Unit: Measurement unit (millicore for CPU mebibyte for memory).
- CPU Usage: The average CPU usage is approximately 42.86 millicores with a peak at 85.71 millicores. This indicates that the Workflow required very little CPU during its execution window.
- CPU Request: The average CPU request was 1112.50 millicores (just over 1 core) with a maximum observed request of 2075 millicores.
- CPU Limit: The pod was allowed to consume up to 2400 millicores (2.4 cores) but actual usage stayed far below this threshold.
- Memory Usage: Memory usage averaged 56.22 MiB and peaked at 112.43 MiB a small fraction of what was allocated.
- Memory Request: Each pod was reserved 1600 MiB of memory on average with a maximum request reaching 2944 MiB.
- Memory Limit: The memory limit was around 1408 MiB peaking at 2816 MiB. Usage remained well under these limits.
Overall this data suggests significant over-provisioning for both CPU and memory. Resource configurations can likely be tuned to reduce overhead without affecting workload performance.
CPU alerts
To automatically track the CPU usage users can configure a Monitor and a Pager to send alerts when the CPU usage exceeds certain limits. This enables teams to respond immediately to resource failures that may impact dependent components. Click here to view the steps to set up alerts for CPU usage.
Memory alerts
To automatically track the memory usage users can configure a Monitor and a Pager to send alerts when the memory usage exceeds certain limits. This enables teams to respond immediately to resource failures that may impact dependent components. Click here to view the steps to set up alerts for memory usage.