Monitor the CPU and Memory Usage of a Service
When a Service Resource is created, a corresponding pod is automatically provisioned in the backend. You can monitor the CPU and memory usage of this pod directly through the Metis UI, Operations app, or Grafana.
Metis UI
To monitor the CPU and memory usage of a Service on the Metis Catalog UI, follow the steps below:
-
Open the Metis Catalog.

Open the Metis Catalog (Metis UI) -
Search for the Service by name.
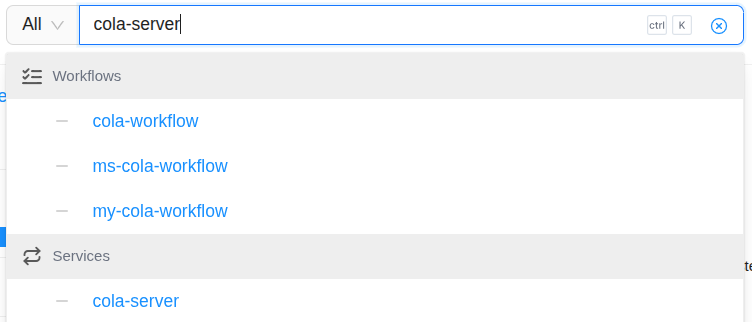
Search for the Service in Metis -
Click on the Service that needs to be monitored and navigate to the ‘Runtime’ section.
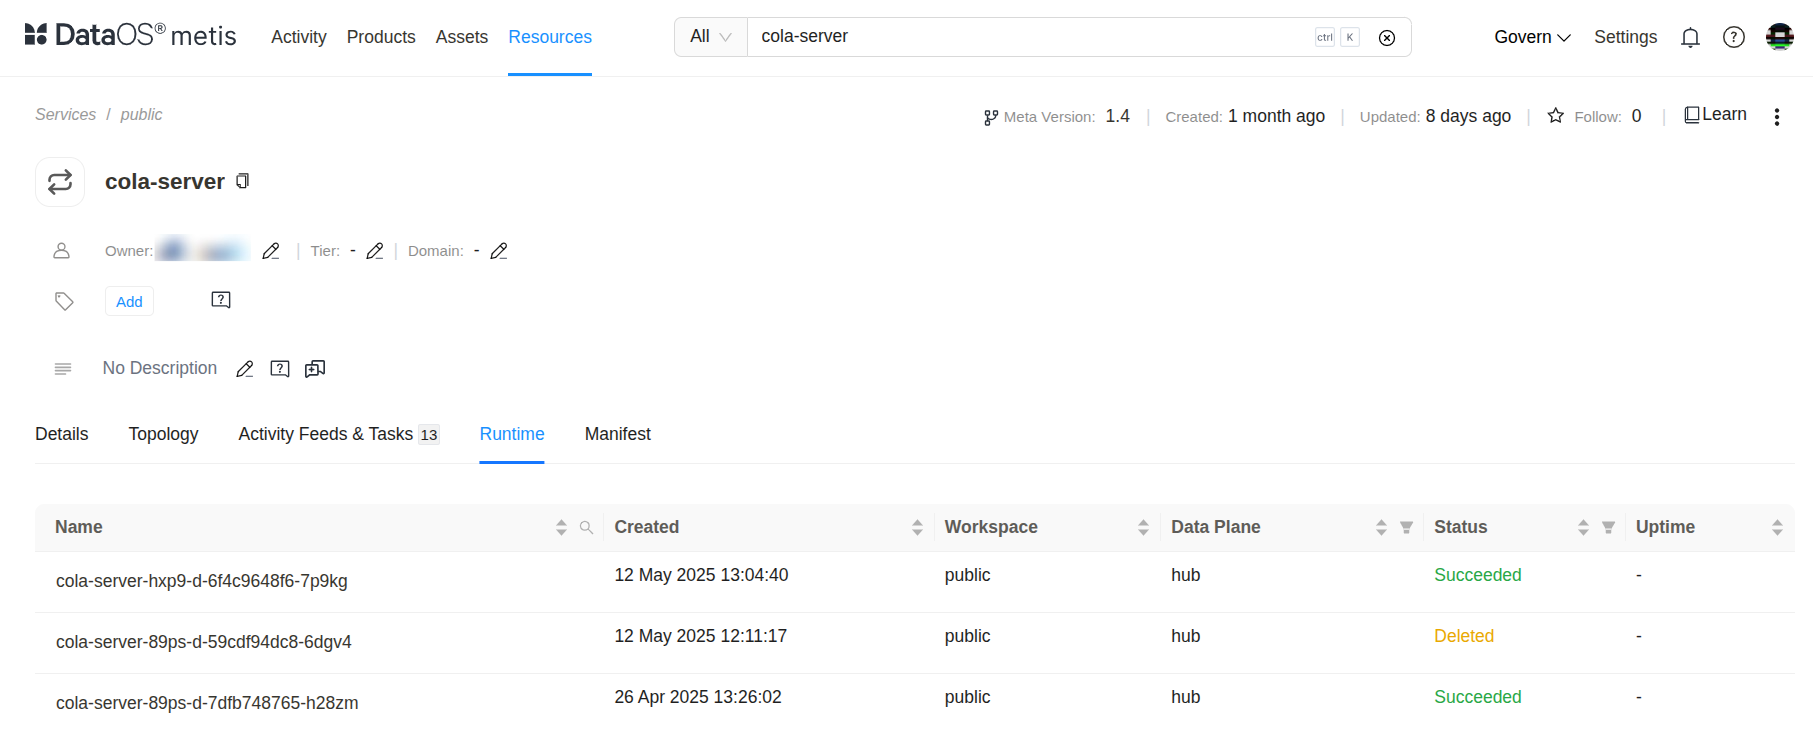
Service details in Metis -
Click on the run name for which you want to monitor the CPU and memory usage, and navigate to the ‘Pod Usage’ section.
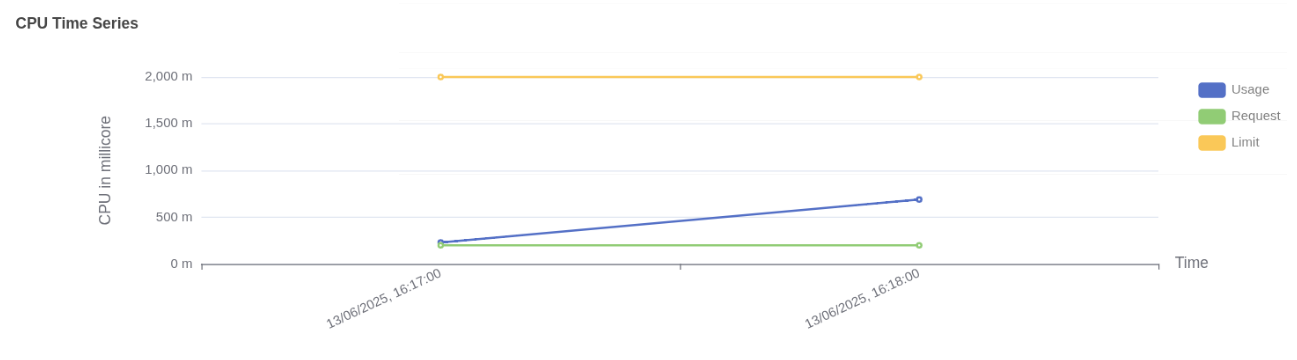
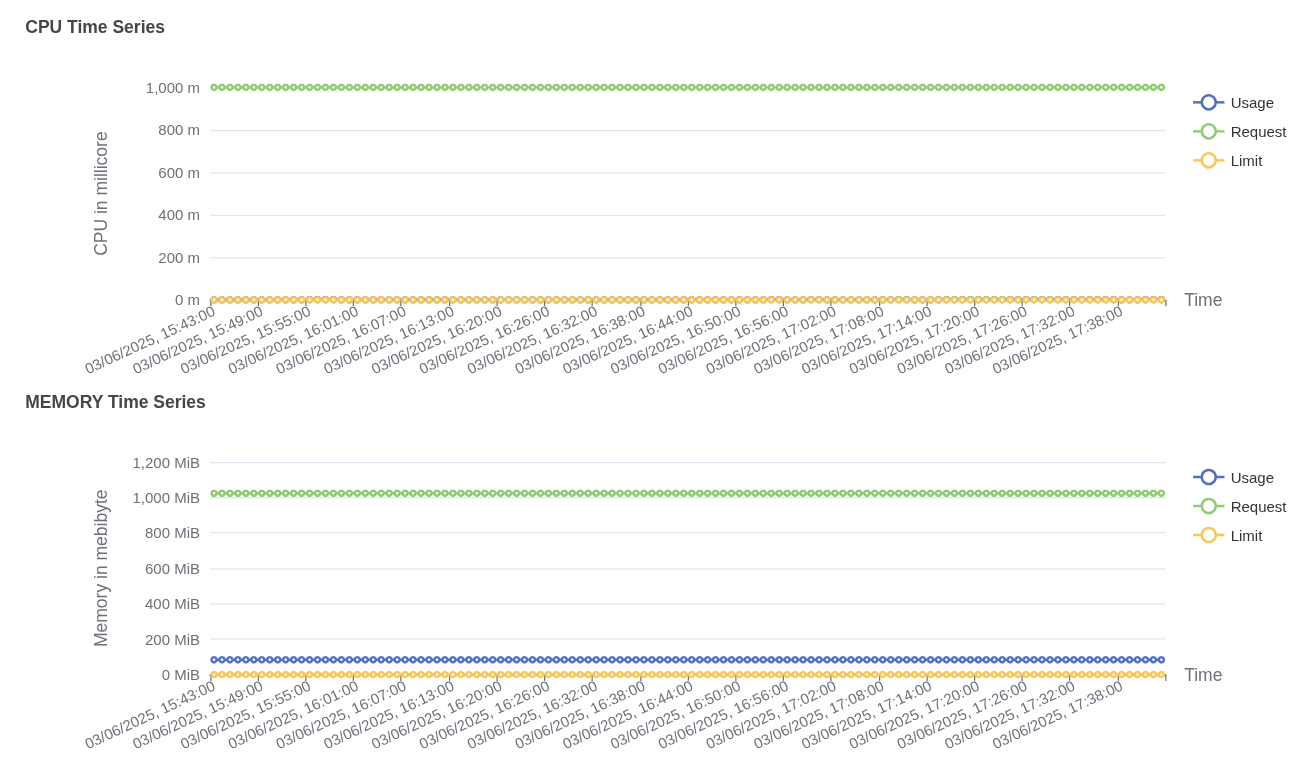
Pod CPU usage vs request and limit CPU usage:
- Usage (blue line) shows actual CPU consumed by the Service pod, increasing steadily and reaching just above 600 millicores.
- Request (green line) is fixed at approximately 250 millicores, indicating the CPU guaranteed for the pod at scheduling time.
- Limit (yellow line) is flat at 2000 millicores, representing the maximum CPU the pod is allowed to use if resources are available.
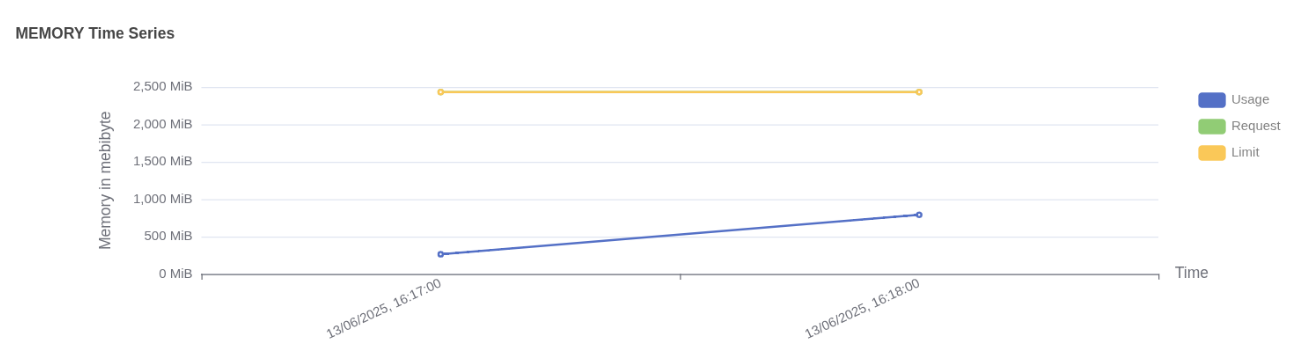
Pod memory usage vs limit Memory usage:
- Usage (blue line) shows actual memory consumed by the workflow pod, increasing over time and reaching just under 1000 MiB.
- Request (green line) is not visible in the graph, which indicates that memory was not explicitly requested or the request value is not available in this dataset.
- Limit (yellow line) remains constant at 2500 MiB, indicating the maximum memory the pod is allowed to consume.
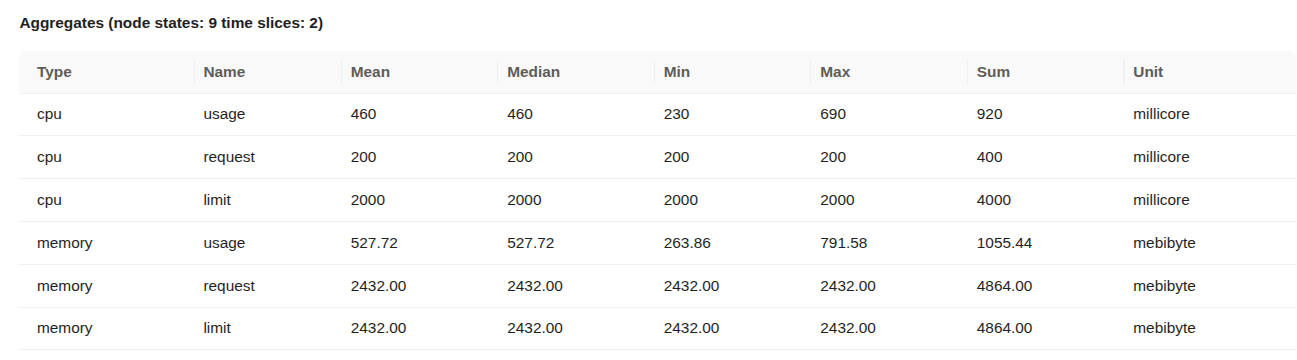
Aggregated CPU and memory statistics Details:
- Type: Indicates whether the metric refers to CPU or memory.
- Name: Describes the metric subtype
usage(actual consumption),request(minimum reserved), orlimit(maximum allowed). - Mean / Median / Min / Max: Statistical summaries over the measured time slices.
- Sum: Total usage across all time slices.
- Unit: CPU is in millicores (1000 millicores = 1 core); memory is in mebibytes (1 MiB = 1,048,576 bytes).
- CPU Usage: Average CPU usage was 460 millicores, peaking at 690 millicores. The pod used significantly more than its request, but stayed within the limit.
- CPU Request: Set at 200 millicores consistently, meaning the pod was guaranteed a small baseline of CPU.
- CPU Limit: Fixed at 2000 millicores (2 cores), providing ample room for the workload to scale under load.
- Memory Usage: Average memory usage was approximately 527.72 MiB, with a maximum usage of 791.58 MiB.
- Memory Request: Set at 2432 MiB, meaning this much memory was reserved and guaranteed to the pod.
- Memory Limit: Also set at 2432 MiB, indicating that the pod could not use more memory than requested.
The Service was allowed to consume significantly more CPU than it requested, and it did so, but stayed under the defined limit. Memory usage remained far below both the request and limit. This suggests an opportunity to reduce memory allocation to free up resources for other workloads.
Operations App
When a Service Resource is created, a corresponding pod is automatically provisioned in the backend. You can monitor the CPU and memory usage of this pod directly through the Operations app.
To monitor the CPU and memory usage of a Service on the Operations app, follow the steps below:
-
Open the Operations app.

Open the Operations app -
Navigate to User Space → Resources → types, select the Service as type, and search for the Service that needs to be monitored.
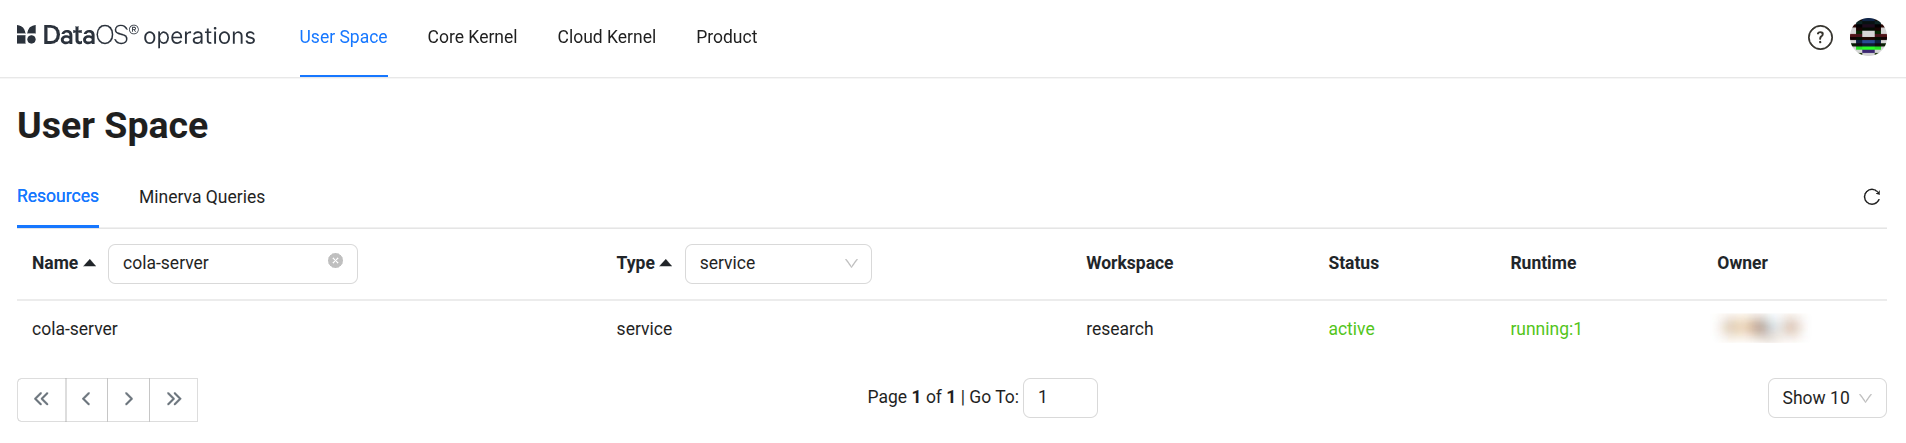
Operations > User Space > Resources -
Click on the Service, navigate to the ‘Resource Runtime’ section.
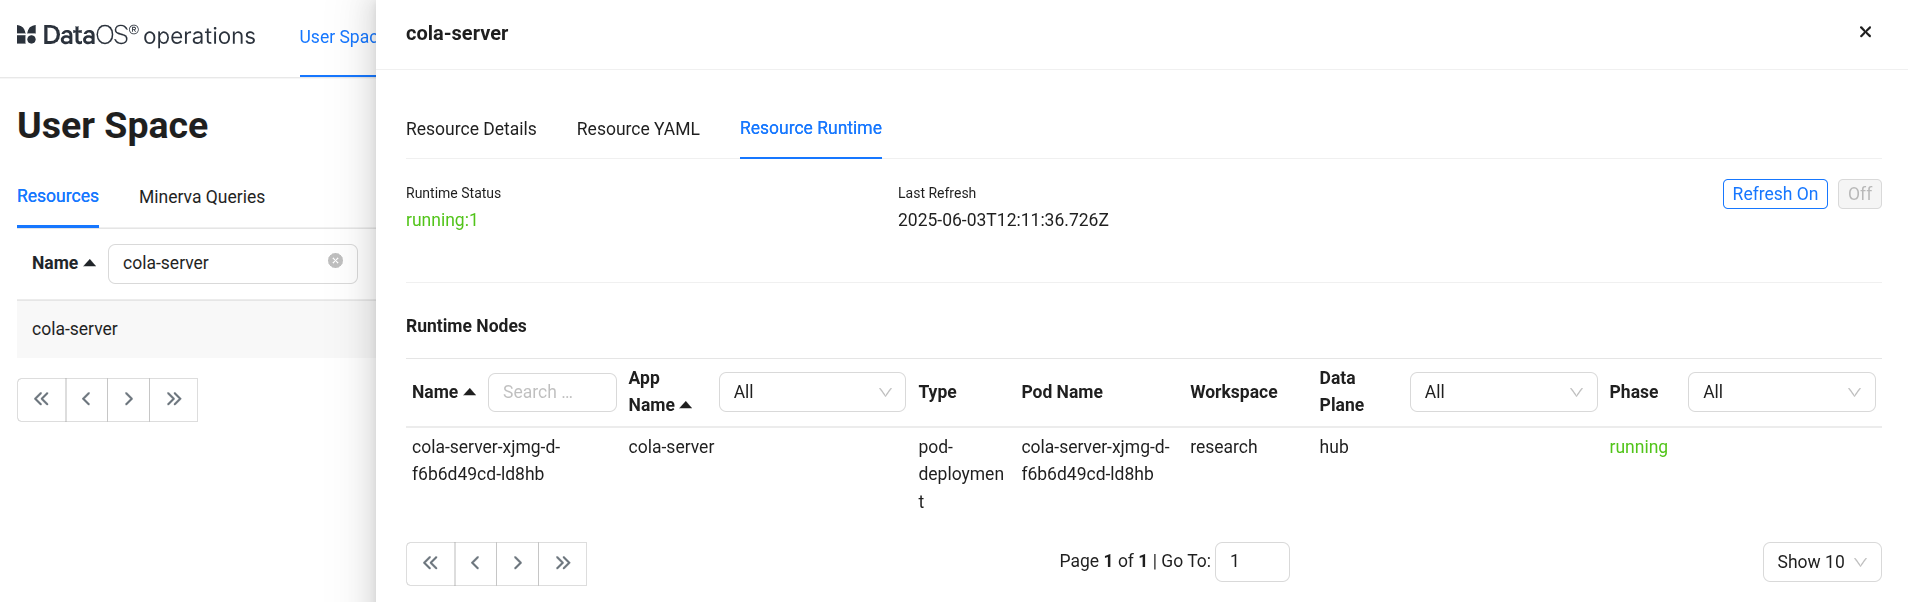
Service resource runtime in Operations -
Click on the pod name for which you want to monitor the CPU and memory usage, and navigate to the ‘Runtime Node Usage’ section.
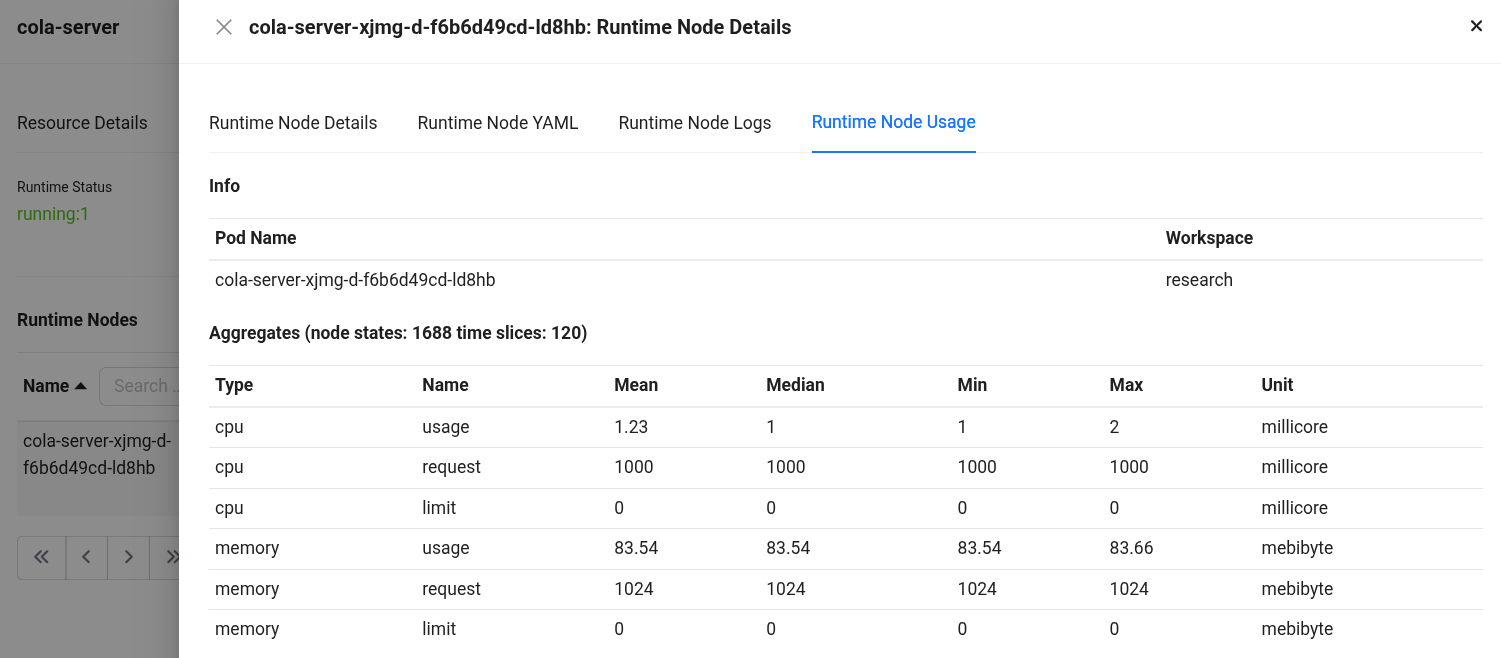
Runtime Node Usage details Details:
- Type: Indicates whether the metric is related to CPU or memory.
- Name: Specifies the metric subtype,
usage(actual consumption),request(guaranteed minimum), andlimit(maximum allocable resource). - Mean / Median / Min / Max: Statistical summaries of the metric over the evaluated time slices.
- Sum: Total value accumulated across all time slices.
- Unit: Measurement unit (millicore for CPU, mebibyte for memory).
- CPU Usage: Average CPU usage was ~1.23 millicores, peaking at 2 millicores (1 core = 1000 millicores). Millicores provide fine-grained control over how much CPU each pod or container should receive.
- CPU Request: The pods are configured to request 1000 millicores of CPU each, consistently across time slices.
- CPU Limit: The pods are configured to limit 0 millicores of CPU each, consistently across time slices.
- Memory Usage: Average memory consumption stands at ~83.54 MiB, with a peak at 83.66 MiB (1 MiB = 2²⁰ bytes = 1,048,576 bytes).
- Memory Request: Each pod has been allocated 1024.00 MiB as a guaranteed memory reservation.
- Memory Limit: Each pod has been allocated 0 MiB as a limited memory reservation.
CPU usage over time in Operations CPU usage:
- Usage (blue line) shows intermittent spikes in CPU consumption, peaking close to 600 millicores. Between spikes, CPU usage drops near zero, indicating short bursts of activity followed by idle periods.
- Request (green line) is not plotted, suggesting no CPU request was explicitly configured or it’s not captured here.
- Limit (yellow line) remains constant at around 1200 millicores, representing the maximum CPU the pod can consume.
Memory usage:
- Usage (blue line) steadily increases, reaching up to 1900 MiB, then dips temporarily and stabilizes again around 1200–1400 MiB. This indicates a consistent memory footprint with some momentary drops.
- Request (green line) is missing, indicating it was either not set or not shown in this view.
- Limit (yellow line) is fixed at 2048 MiB, defining the upper bound for memory allocation.
Grafana
When a Service Resource is created, a corresponding pod is automatically provisioned in the back-end. You can monitor the CPU and memory usage of this pod directly through the Grafana app.
To monitor the CPU and memory usage of a Service on the Grafana app, follow the steps below:
-
Execute the following command in DataOS CLI to get the pod name corresponding to the Service Resource.
Example usage:
INFO[0000] 📃 log(research)... INFO[0001] 📃 log(research)...complete NODE NAME │ CONTAINER NAME │ ERROR ───────────────────────────────────────┼────────────────┼──────── nilus-server-3zef-d-66b64fb88d-krq8b │ nilus-server │ # ^ pod name -------------------LOGS------------------- 2025-06-02 23:02:04 [INFO] migration.py:51 [nilus_server.migrations.migration] Running Alembic migrations during startup... 2025-06-02 23:02:04 [INFO] migration.py:16 [nilus_server.migrations.migration] Starting Alembic Migration upgrade process 2025-06-02 23:02:04 [INFO] migration.py:27 [nilus_server.migrations.migration] Running Alembic upgrade to 'head' INFO [alembic.runtime.migration] Context impl PostgresqlImpl. INFO [alembic.runtime.migration] Will assume transactional DDL. /usr/local/lib/python3.11/site-packages/pydantic/_internal/_fields.py:192: UserWarning: Field name "schema" in "LoadInfo" shadows an attribute in parent "BaseModel" warnings.warn( 2025-06-02 23:02:10 [INFO] main.py:148 [nilus_server.main] Initiating nilus server on path: /nilus/research:nilus-server INFO: Started server process [1] INFO: Waiting for application startup. 2025-06-02 23:02:14 [INFO] main.py:54 [nilus_server.main] Started metrics push task INFO: Application startup complete. INFO: Uvicorn running on http://0.0.0.0:8000 (Press CTRL+C to quit) -
Open the Grafana app.
Open the Grafana app -
Navigate to the Explore section and select ‘Thanos’ as a source and search for the metric
cpu_container_usage_total, and in the label filters select pod and paste the pod name which we have gotten from step 1, then click on ‘Run Query’.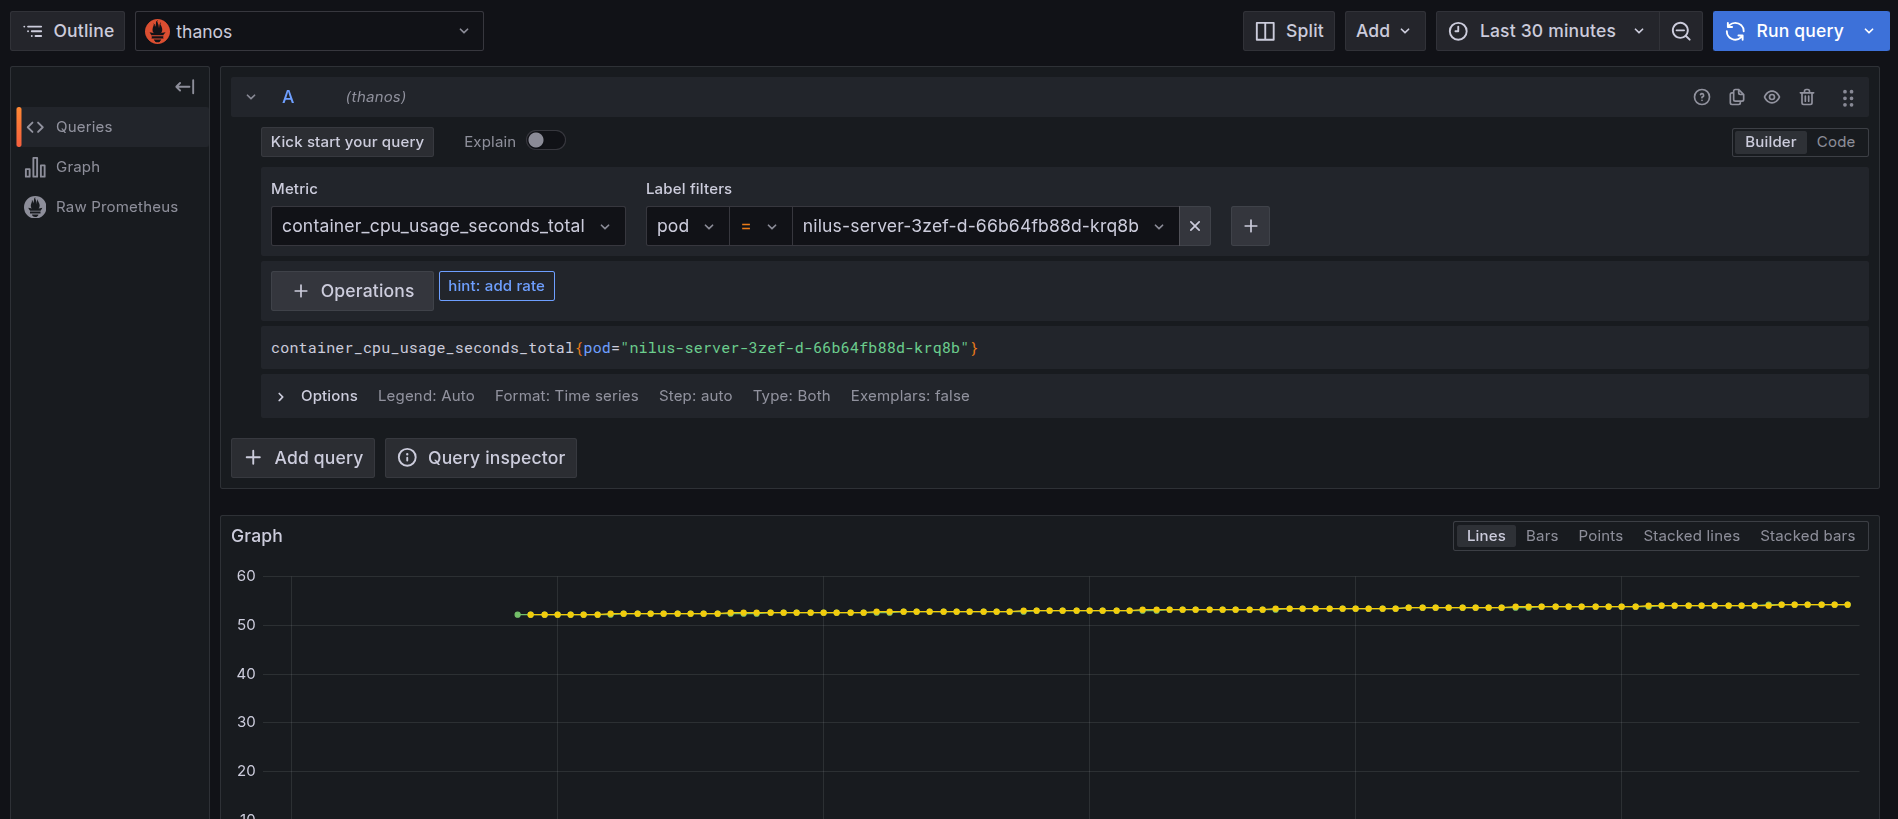
Grafana Explore: CPU usage query -
After clicking on the ‘Run Query’, you can find the usage of CPU by the Service.
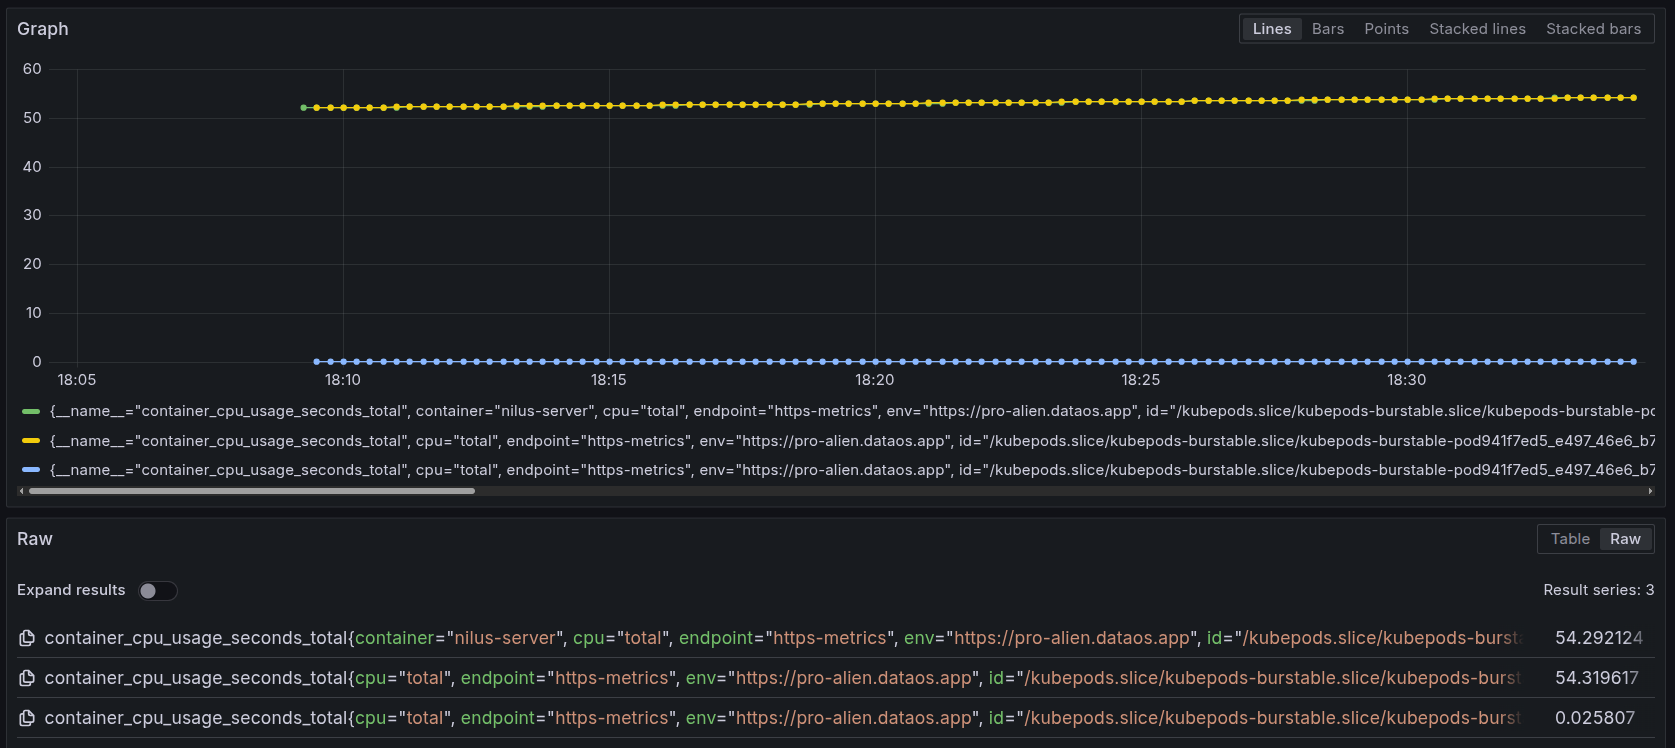
CPU usage by container over time This graph displays the cumulative CPU usage (in seconds) over time for containers within a single pod tied to the
nilus-serverService.- Green Line: This line represents the cumulative CPU usage for the main container named
nilus-server. It consistently hovers around54.29seconds, indicating stable CPU consumption over the monitored time window. - Yellow Line: This line also shows a CPU usage pattern at approximately
54.31seconds. It corresponds to another container within the same pod, such as an init container. The color here simply helps distinguish it visually. - Blue Line: The blue line has a much lower value (~0.025), suggesting it represents another container within the pod.
All three lines originate from containers running inside the same pod, identified by a common pod ID (
kubepods-burstable-pod941f7ed5_...). This setup is typical for DataOS deployments where the main service container (likenilus-server) is initialized alongside supporting containers. - Green Line: This line represents the cumulative CPU usage for the main container named
-
To monitor the memory usage, select the
container_memory_working_set_bytesin the query explorer and select the pod name as the label filter of the corresponding Service, and run the query.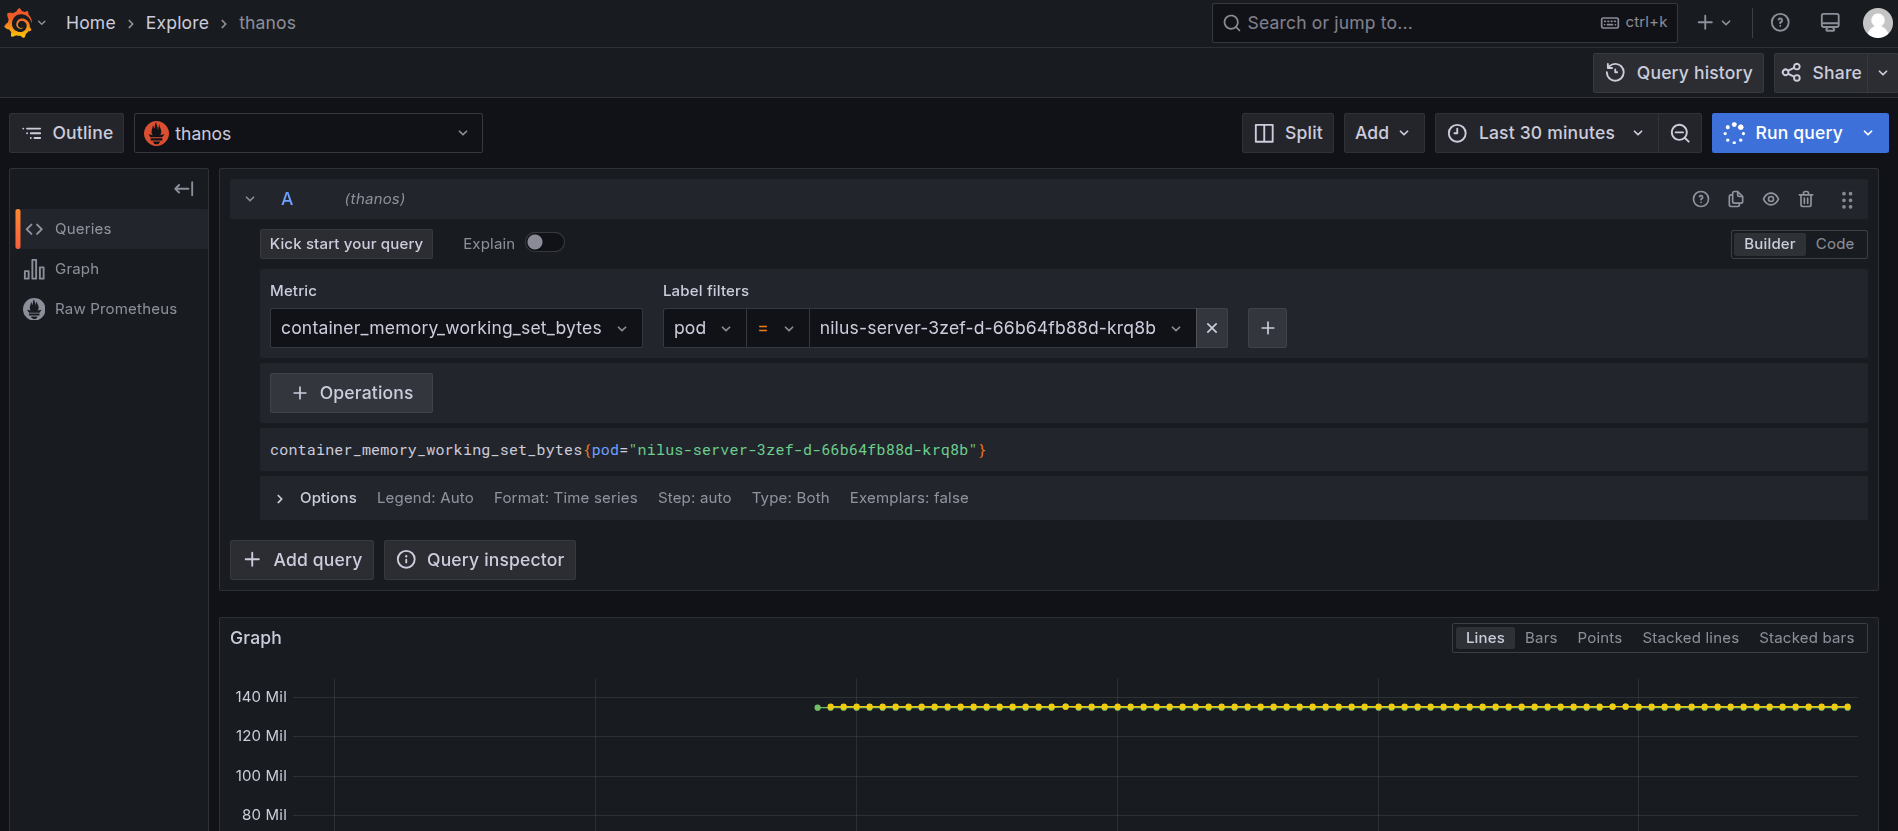
Grafana Explore: memory working set query -
On executing the query, you can see the memory used by the pod in the last thirty minutes.
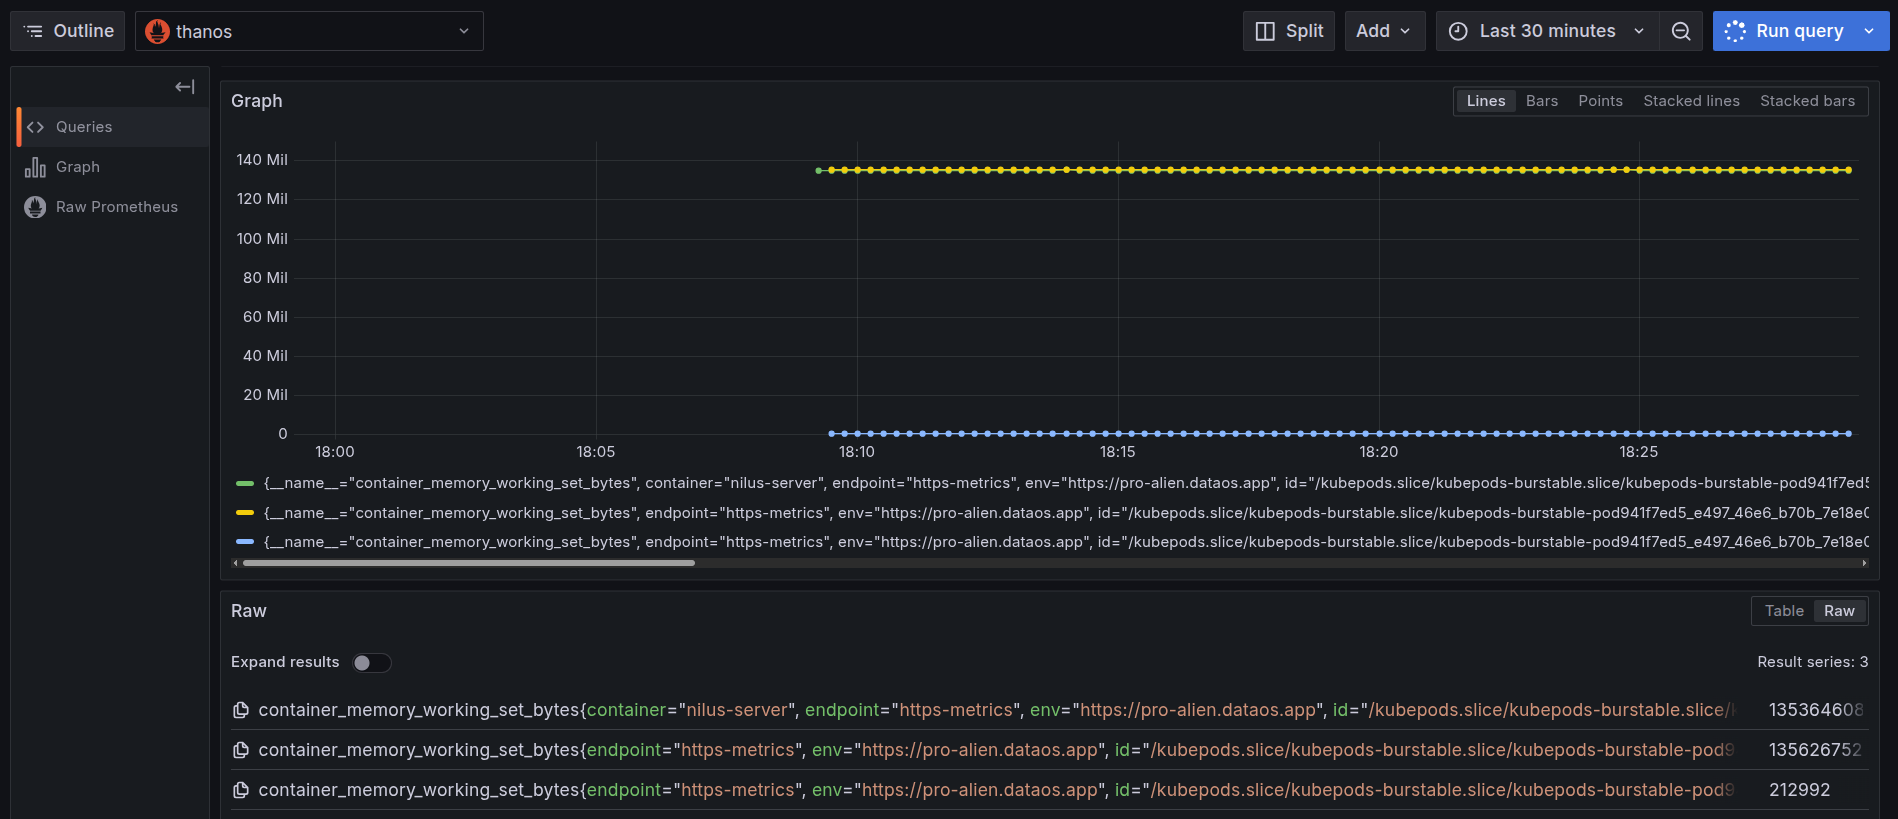
Memory usage by container over time This graph visualizes the working memory set (Resident Set Size memory) over time for all containers within a single pod backing the
nilus-serverService.- Green Line: This represents the memory consumption of the main container named
nilus-server. The working set memory consistently remains around 135 MiB, indicating a steady memory footprint by the application layer during the observed window. - Yellow Line: This shows usage for another container in the same pod (an init container). The value (~135 MiB) is almost identical to the green line, suggesting a similarly allocated memory footprint.
- Blue Line: The blue line, much lower in value (~0.2 MiB), corresponds to another init container, which initializes briefly and consumes negligible memory during its lifecycle.
All containers in the graph belong to the same pod, backing the
nilus-serverService. This reflects a common DataOS deployment pattern, where multiple containers, main and init, run within a pod to support application logic, initialization, or auxiliary setup. - Green Line: This represents the memory consumption of the main container named
-
You can further select the time range at which you want to see the memory usage.
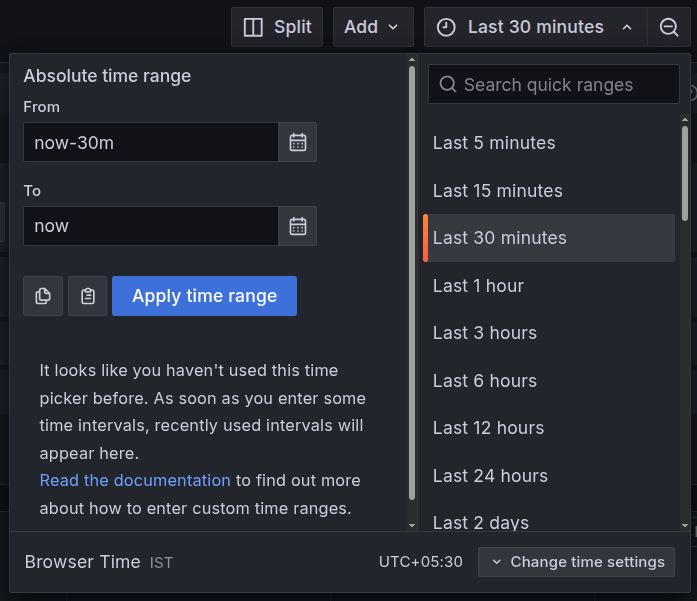
Adjust the time range in Grafana
CPU alerts
To automatically track the CPU usage, users can configure a Monitor and a Pager to send alerts when the CPU usage exceeds certain limits. This enables teams to respond immediately to resource failures that may impact dependent components. Click here to view the steps to set up alerts for CPU usage.
Memory alerts
To automatically track the memory usage, users can configure a Monitor and a Pager to send alerts when the memory usage exceeds certain limits. This enables teams to respond immediately to resource failures that may impact dependent components. Click here to view the steps to set up alerts for memory usage.