Viewing Data Product Details
Overview
In this topic, you'll learn to explore the details of a Data Product in the Data Product Hub.
📘 Scenario
You’ve found the Product Affinity Data Product. Now, let’s assess whether it fits your needs for analyzing purchasing patterns. You’ll evaluate its reliability by reviewing contributors, metadata, quality, metrics, and outputs.
Quick concepts
As we understand that Data Product is a ready-to-use, reliable, and governed data solution designed to provide meaningful and actionable insights to meet specific business needs. It exposes clean, analysis-ready data through APIs and interfaces.
Key components
-
Inputs: Raw data that feeds into a Data Product or analysis. These datasets serve as the foundation for all processing and transformations that the Data Product performs.
-
Outputs: Insights or processed data generated from a Data Product, ready-to-use datasets for downstream use. A Data Product may have one or more outputs, or in some cases, none.
-
Semantic model: Maps physical data to logical tables by defining relationships between data entities and creating meaningful metrics. It simplifies the underlying data structure into familiar business terms.
- Abstracting complexity: It abstract representations of the data designed for ease of use.
- Providing insights: Enables easy understanding of key metrics and relationships. Metrics are derived from the Semantic Model and represent key business indicators.
- Facilitating interaction: Serves as a user-friendly interface for data exploration.
-
Data quality: Coverage on accuracy, freshness, schema, and completeness for its intended use.
-
Access options: Consumption portsfor exposing data through APIs or BI tools for downstream applications.
What do you need to get started?
Familiarity with basic semantic modeling and data quality concepts is helpful.
Steps to view Data Product details
After discovering the 'Product Affinity' Data Product, follow these steps to explore its details.
-
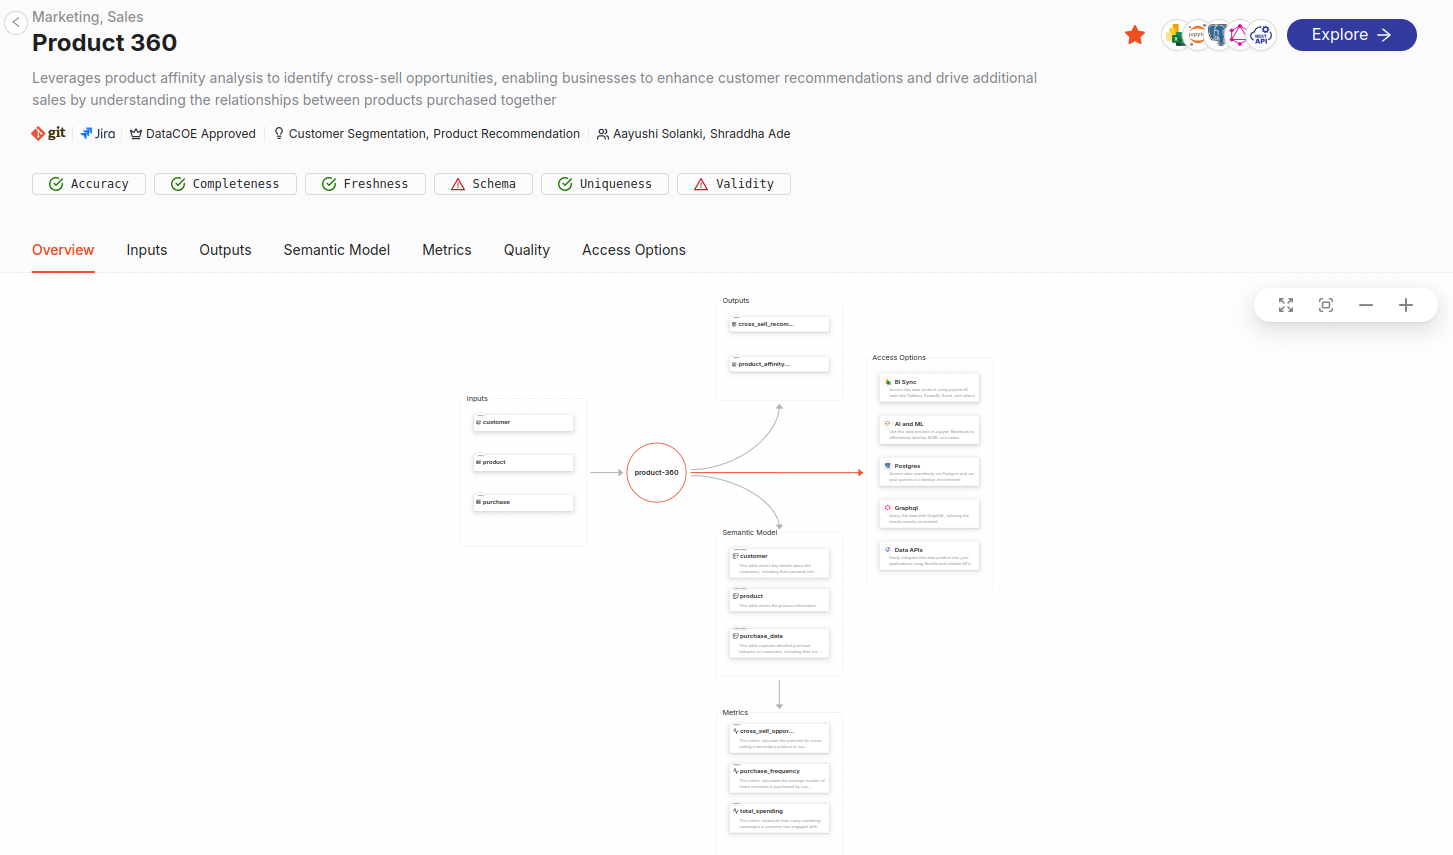
Access the Data Product details page: From the Data Product Hub, select the 'Product Affinity' Data Product.
-
Review the details: On the Data Product details page, you get the description, Git link, Jira link, tier, use cases, collaborators, quality checks applied on the Data Product, and an overview tab that shows the data flow.
-
Get the details on inputs and outputs: Go to the Inputs tab to view source datasets (e.g., customer table fields). You get the details of the columns, their type, and the Data Product reference that has the same dataset used for its development.
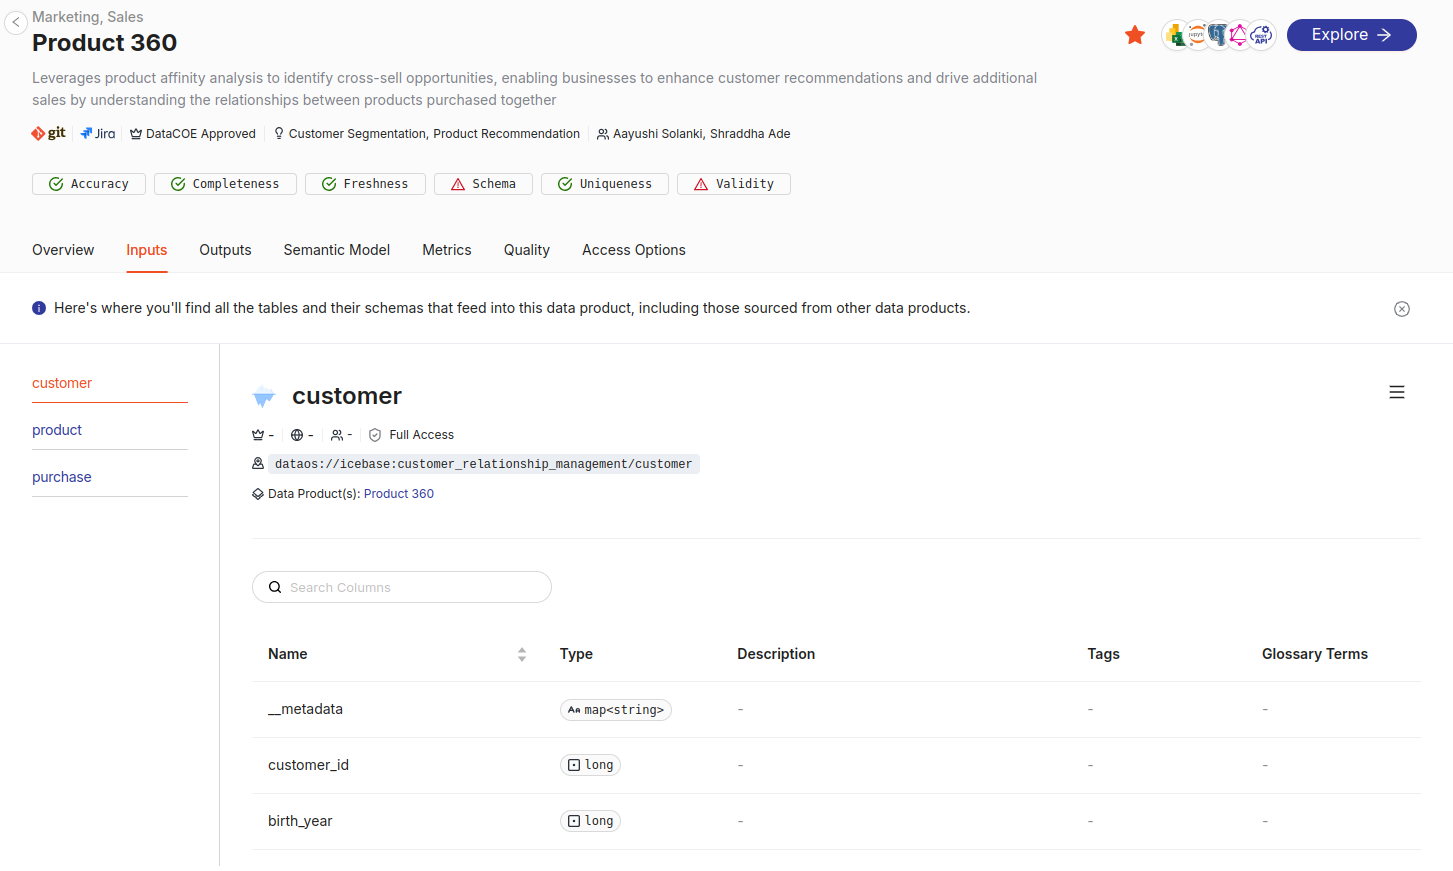
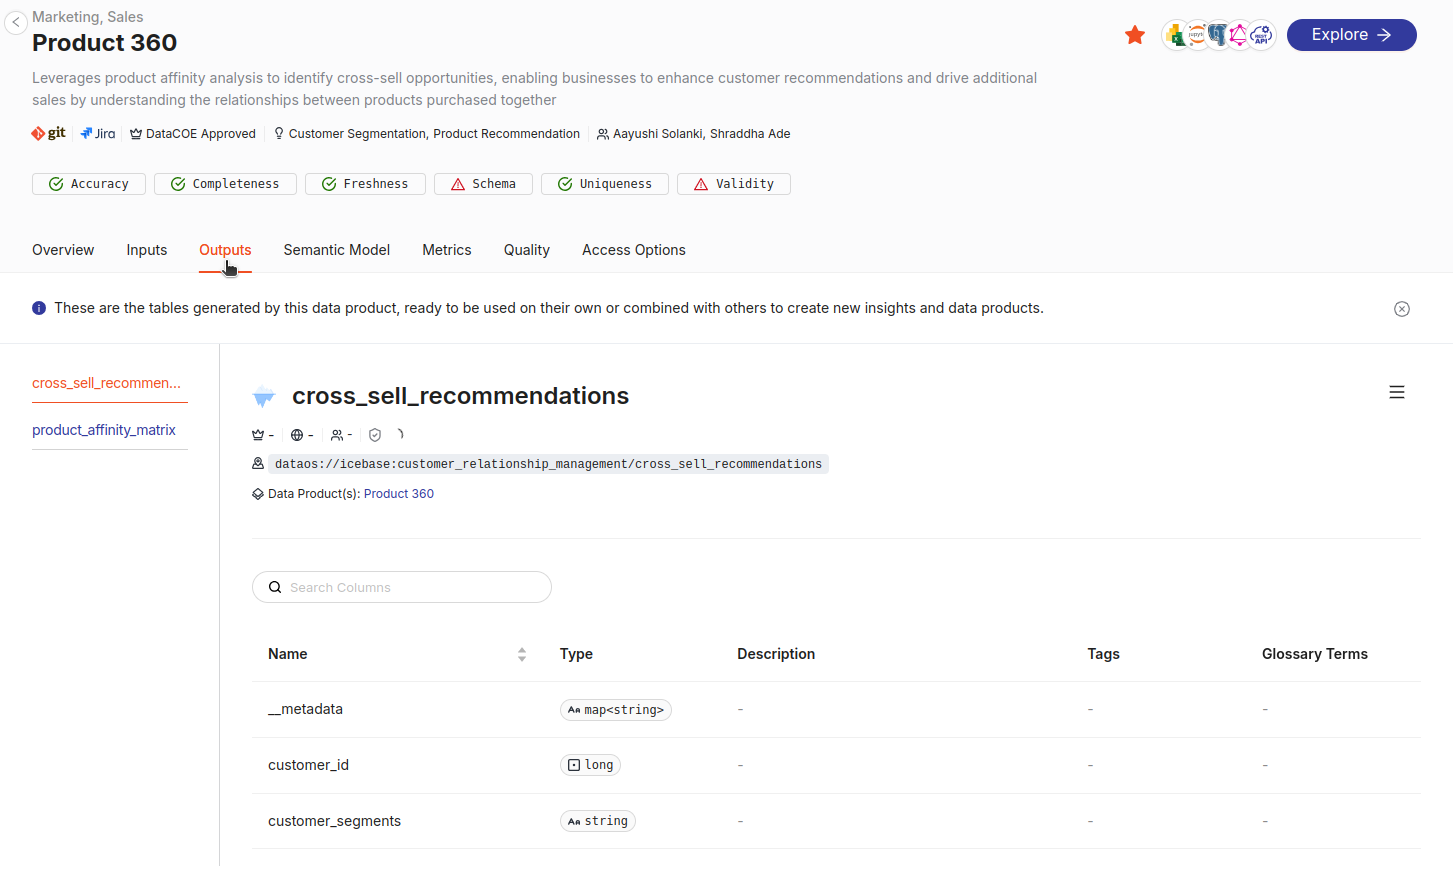
- Then check the Outputs tab for transformed datasets used in analysis.
-
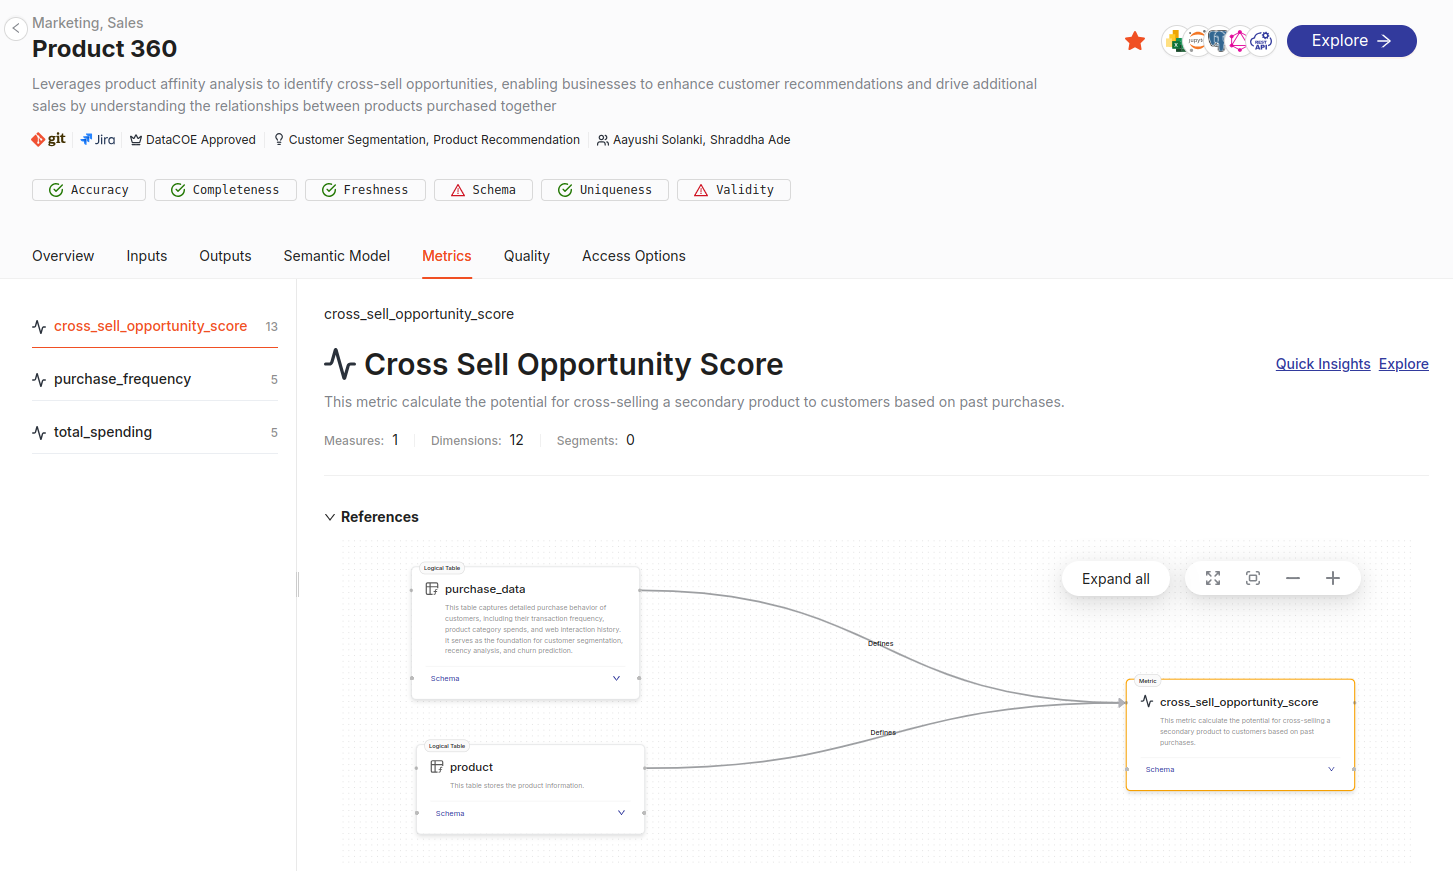
Understanding the semantic model and Metrics: On the 'Semantic Model' tab, you get to understand the data model built on top of the Data Product that is populating the key metrics of the Data Product. Here, you can view the relations between logical tables and derived metrics and views.
Notable metrics include: - **Cross Sell Opportunity Score** - **Purchase Frequency** - **Total Spending** 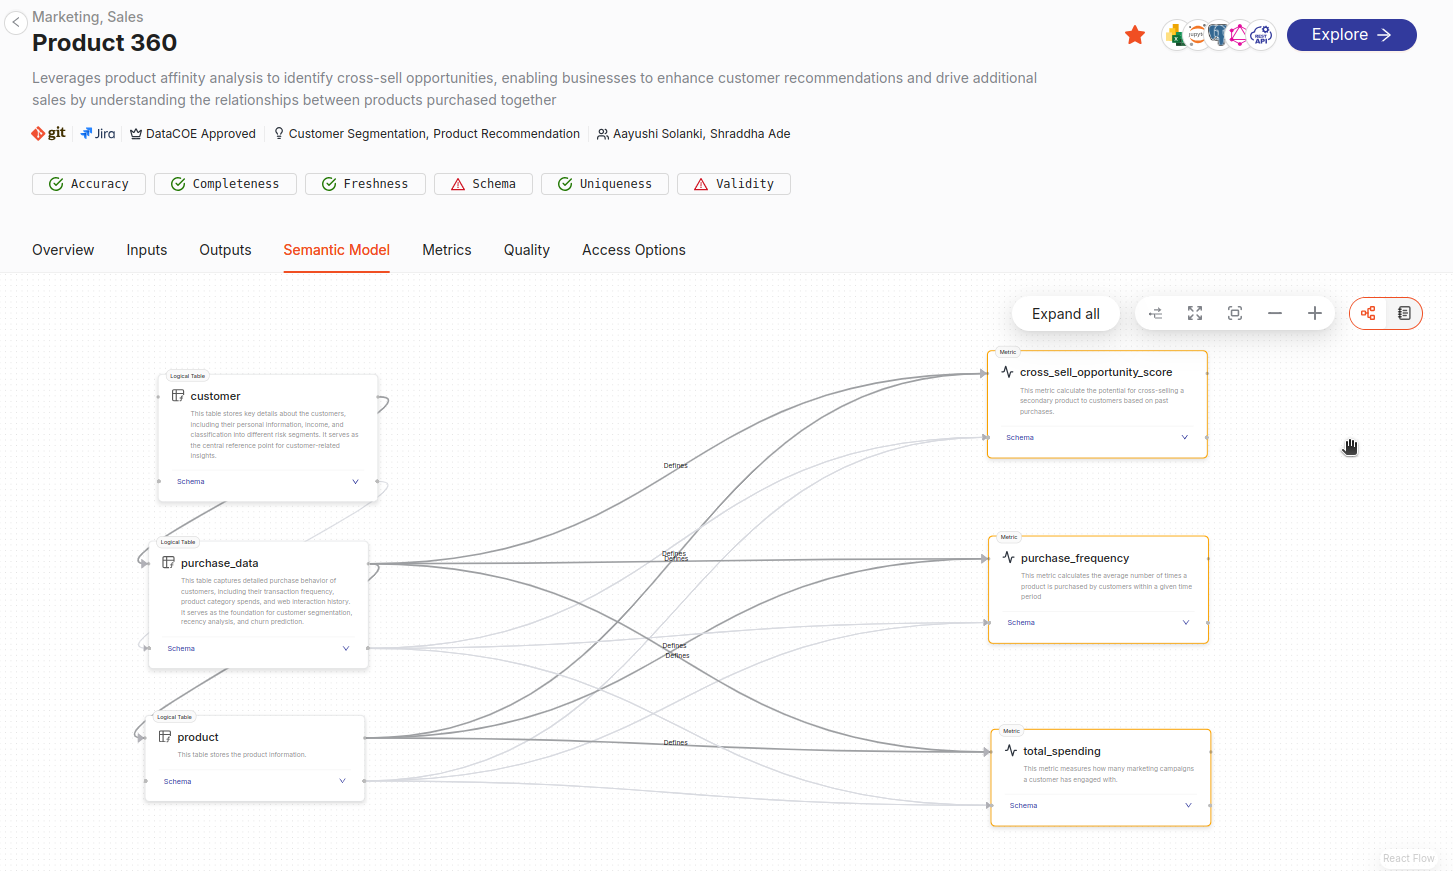-
Metrics details: On the Metrics tab, you’ll see how each metric is calculated from the input datasets. For example, the “Cross Sell Opportunity Score” metric is derived from the product and purchase datasets.
-
-
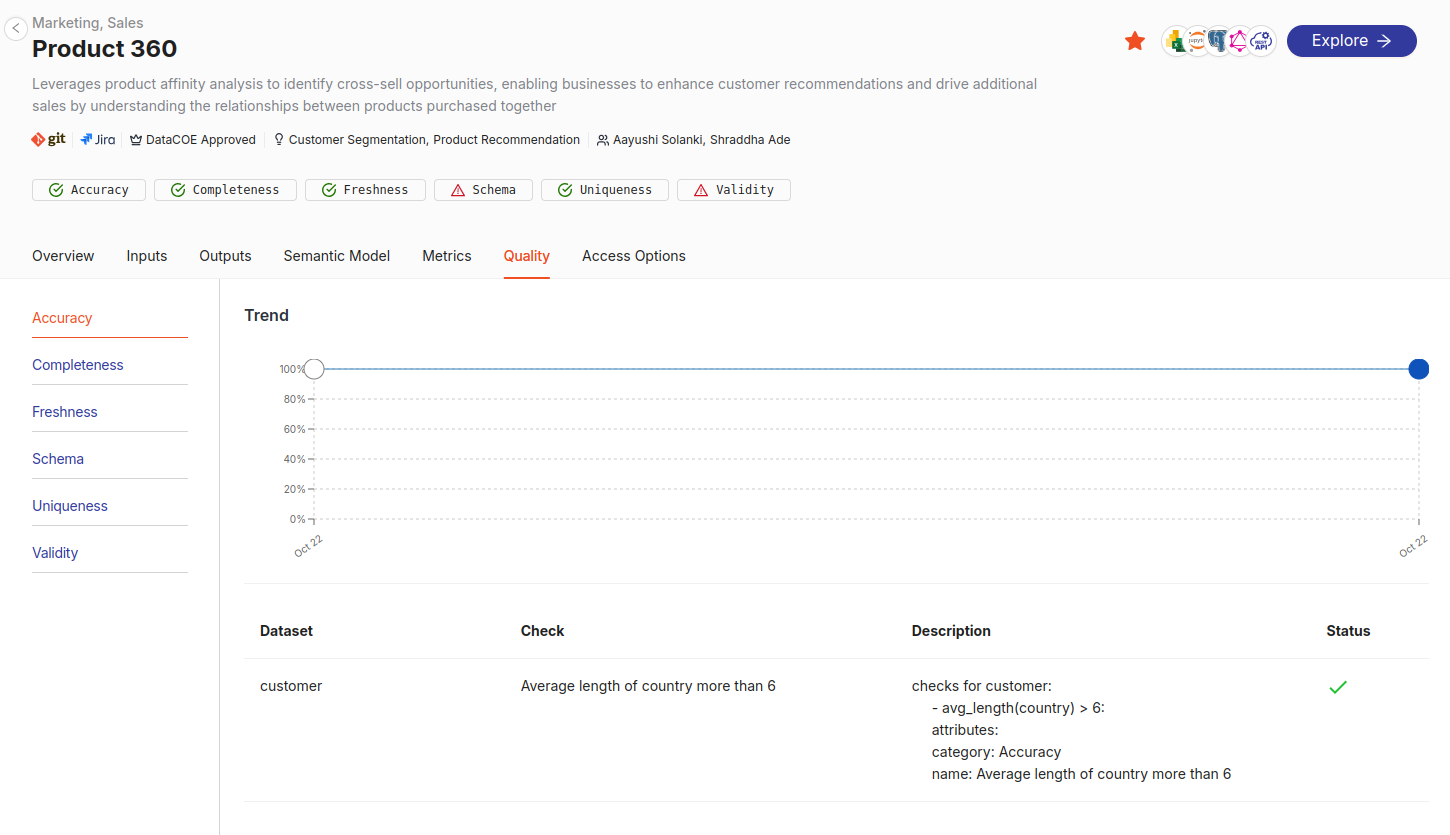
Review quality checks: Get the details on the quality of the Data Product categorized by accuracy, completeness, freshness, schema, uniqueness, and validity.
 -
Access options: Explore the semantic model associated with your data Product using tools like Studio or integrate with various BI tools, AI/ML platforms, or applications using DataOS APIs. If a Data Product includes a Semantic Model, then the following consumption ports are available:
- Power BI and MS Excel
- Jupyter Notebook
- Postgres
- GraphQL
Best practices
-
Review metadata for insights: Always check metadata for the Data Product description, quality checks, and ownership to ensure it aligns with your requirements.
-
Evaluate Suitability of Data Products: Check linked resources, like Git repositories or Jira tickets, to understand its development and governance history.
-
Check inputs and outputs: Ensure they align with your analysis requirements.
FAQs
Q1: How can Semantic Models be consumed?
Semantic Models can be explored using tools like Studio or integrated with BI tools and GraphQL APIs. Their versatility makes them suitable for a wide range of consumption layers.
Q2: What are Metrics in a Semantic Model?
Metrics are quantifiable measures used to track and evaluate the performance of a Data Product or user behavior. Derived from the Semantic Model, they represent key business indicators.
Q3: What are consumption ports?
Consumption ports are the methods or interfaces to expose data from a Data Product. Examples include APIs, BI tools, and GraphQL APIs.
Self-check quiz
Q1. What does the Semantic Model help with in a Data Product?
a) Encrypting data
b) Storing raw input data
c) Mapping data to business terms for easier analysis
d) Sending alerts
Q2. Try it task: Explore a Data Product in Your Training Instance.
Follow the steps below in your DataOS training instance to reinforce your learning:
- Open the Data Product Hub
- Search for the Data Product named "Product Affinity"
-
Navigate through its tabs and answer the following:
-
What inputs does it use?
-
What key metric is defined in the Semantic Model?
-
Which BI tools are listed in its access options?
-
Next step
Continue to the next topic to analyze schema, metadata, and quality of input/output datasets in more details: