Exploring Input & Output Datasets
Overview
Gain deeper insight into the data behind a Data Product by exploring its input and output datasets using Metis (for metadata and quality) and Workbench (for hands-on querying).
📘 Scenario
You're preparing for a marketing campaign and need to ensure the underlying data is accurate and complete. You’ve identified the Product Affinity Data Product. Now, it’s time to assess its inputs and outputs to evaluate its fitness for your use case.
Step 1: Start with Data Product details
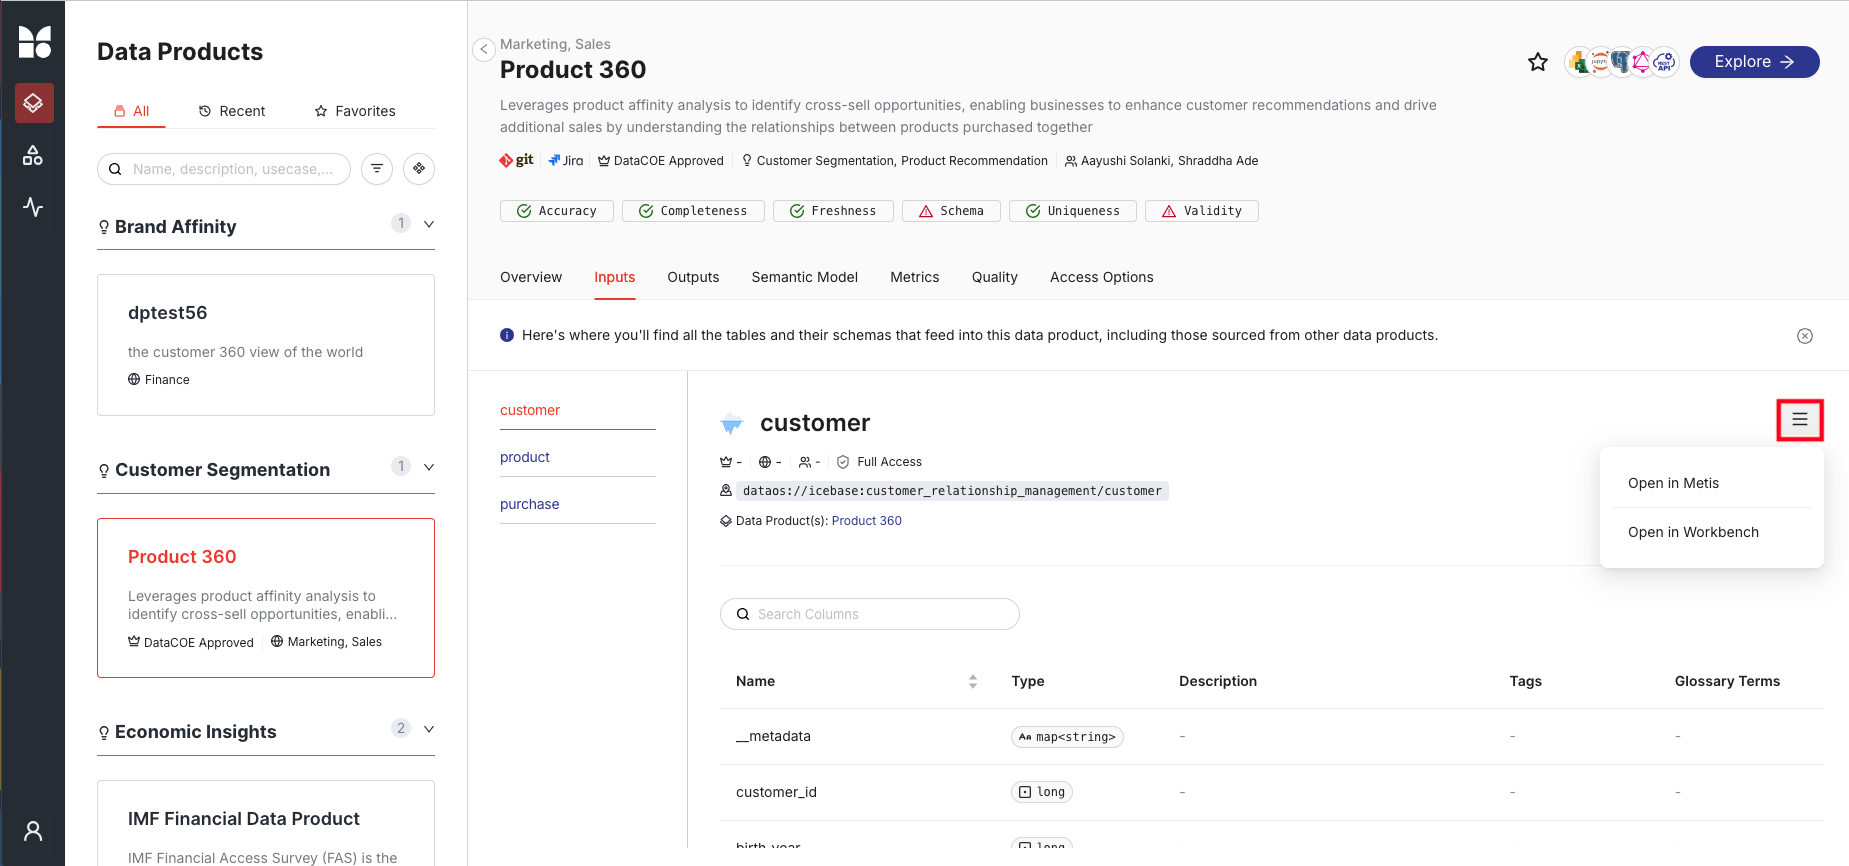
From the Data Product Hub, select Product Affinity to view its metadata, inputs, outputs, and more. For deeper details, open the dataset in Metis to explore schema, quality, lineage, and policies.
Click on the Metis option as shown below:
Step 2: View input dataset metadata in Metis
-
For structured data sources, you will see comprehensive details such as asset type, meta version, last update time, follower count, and various editing options for owner, tier, domain, tags, and description.
-
You will see the DataOS address for your dataset. Within DataOS, each source system is identified by a unique Uniform Data Link (UDL). This address acts as a consistent reference point, regardless of the source system's internal naming conventions and structure. Leveraging the UDL enables access to datasets and seamless execution of various operations.
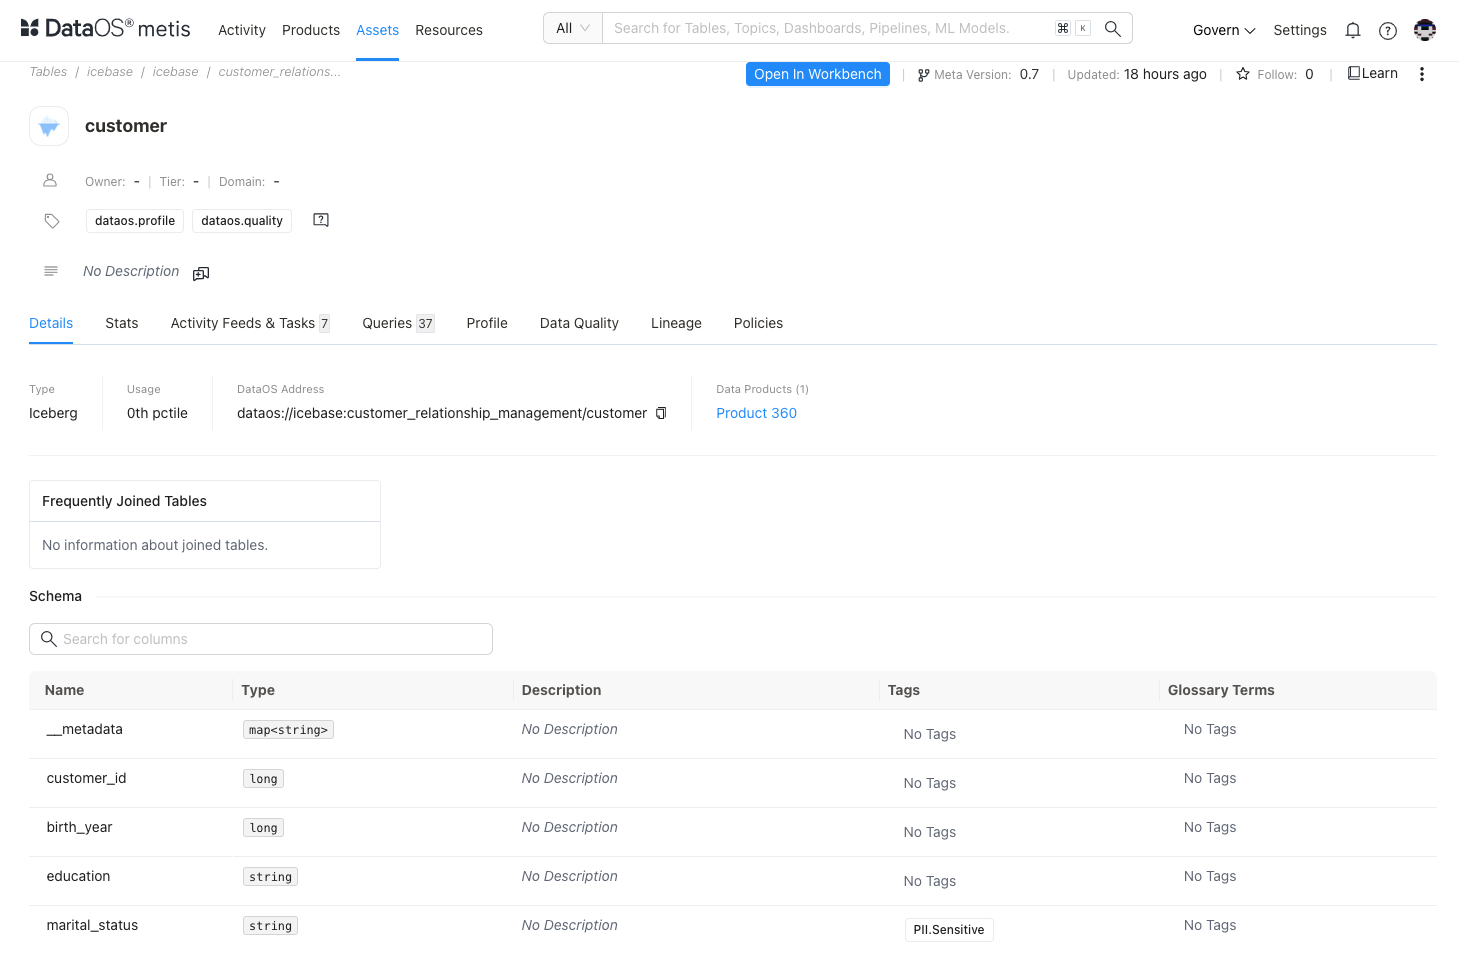
Assess schema and tags
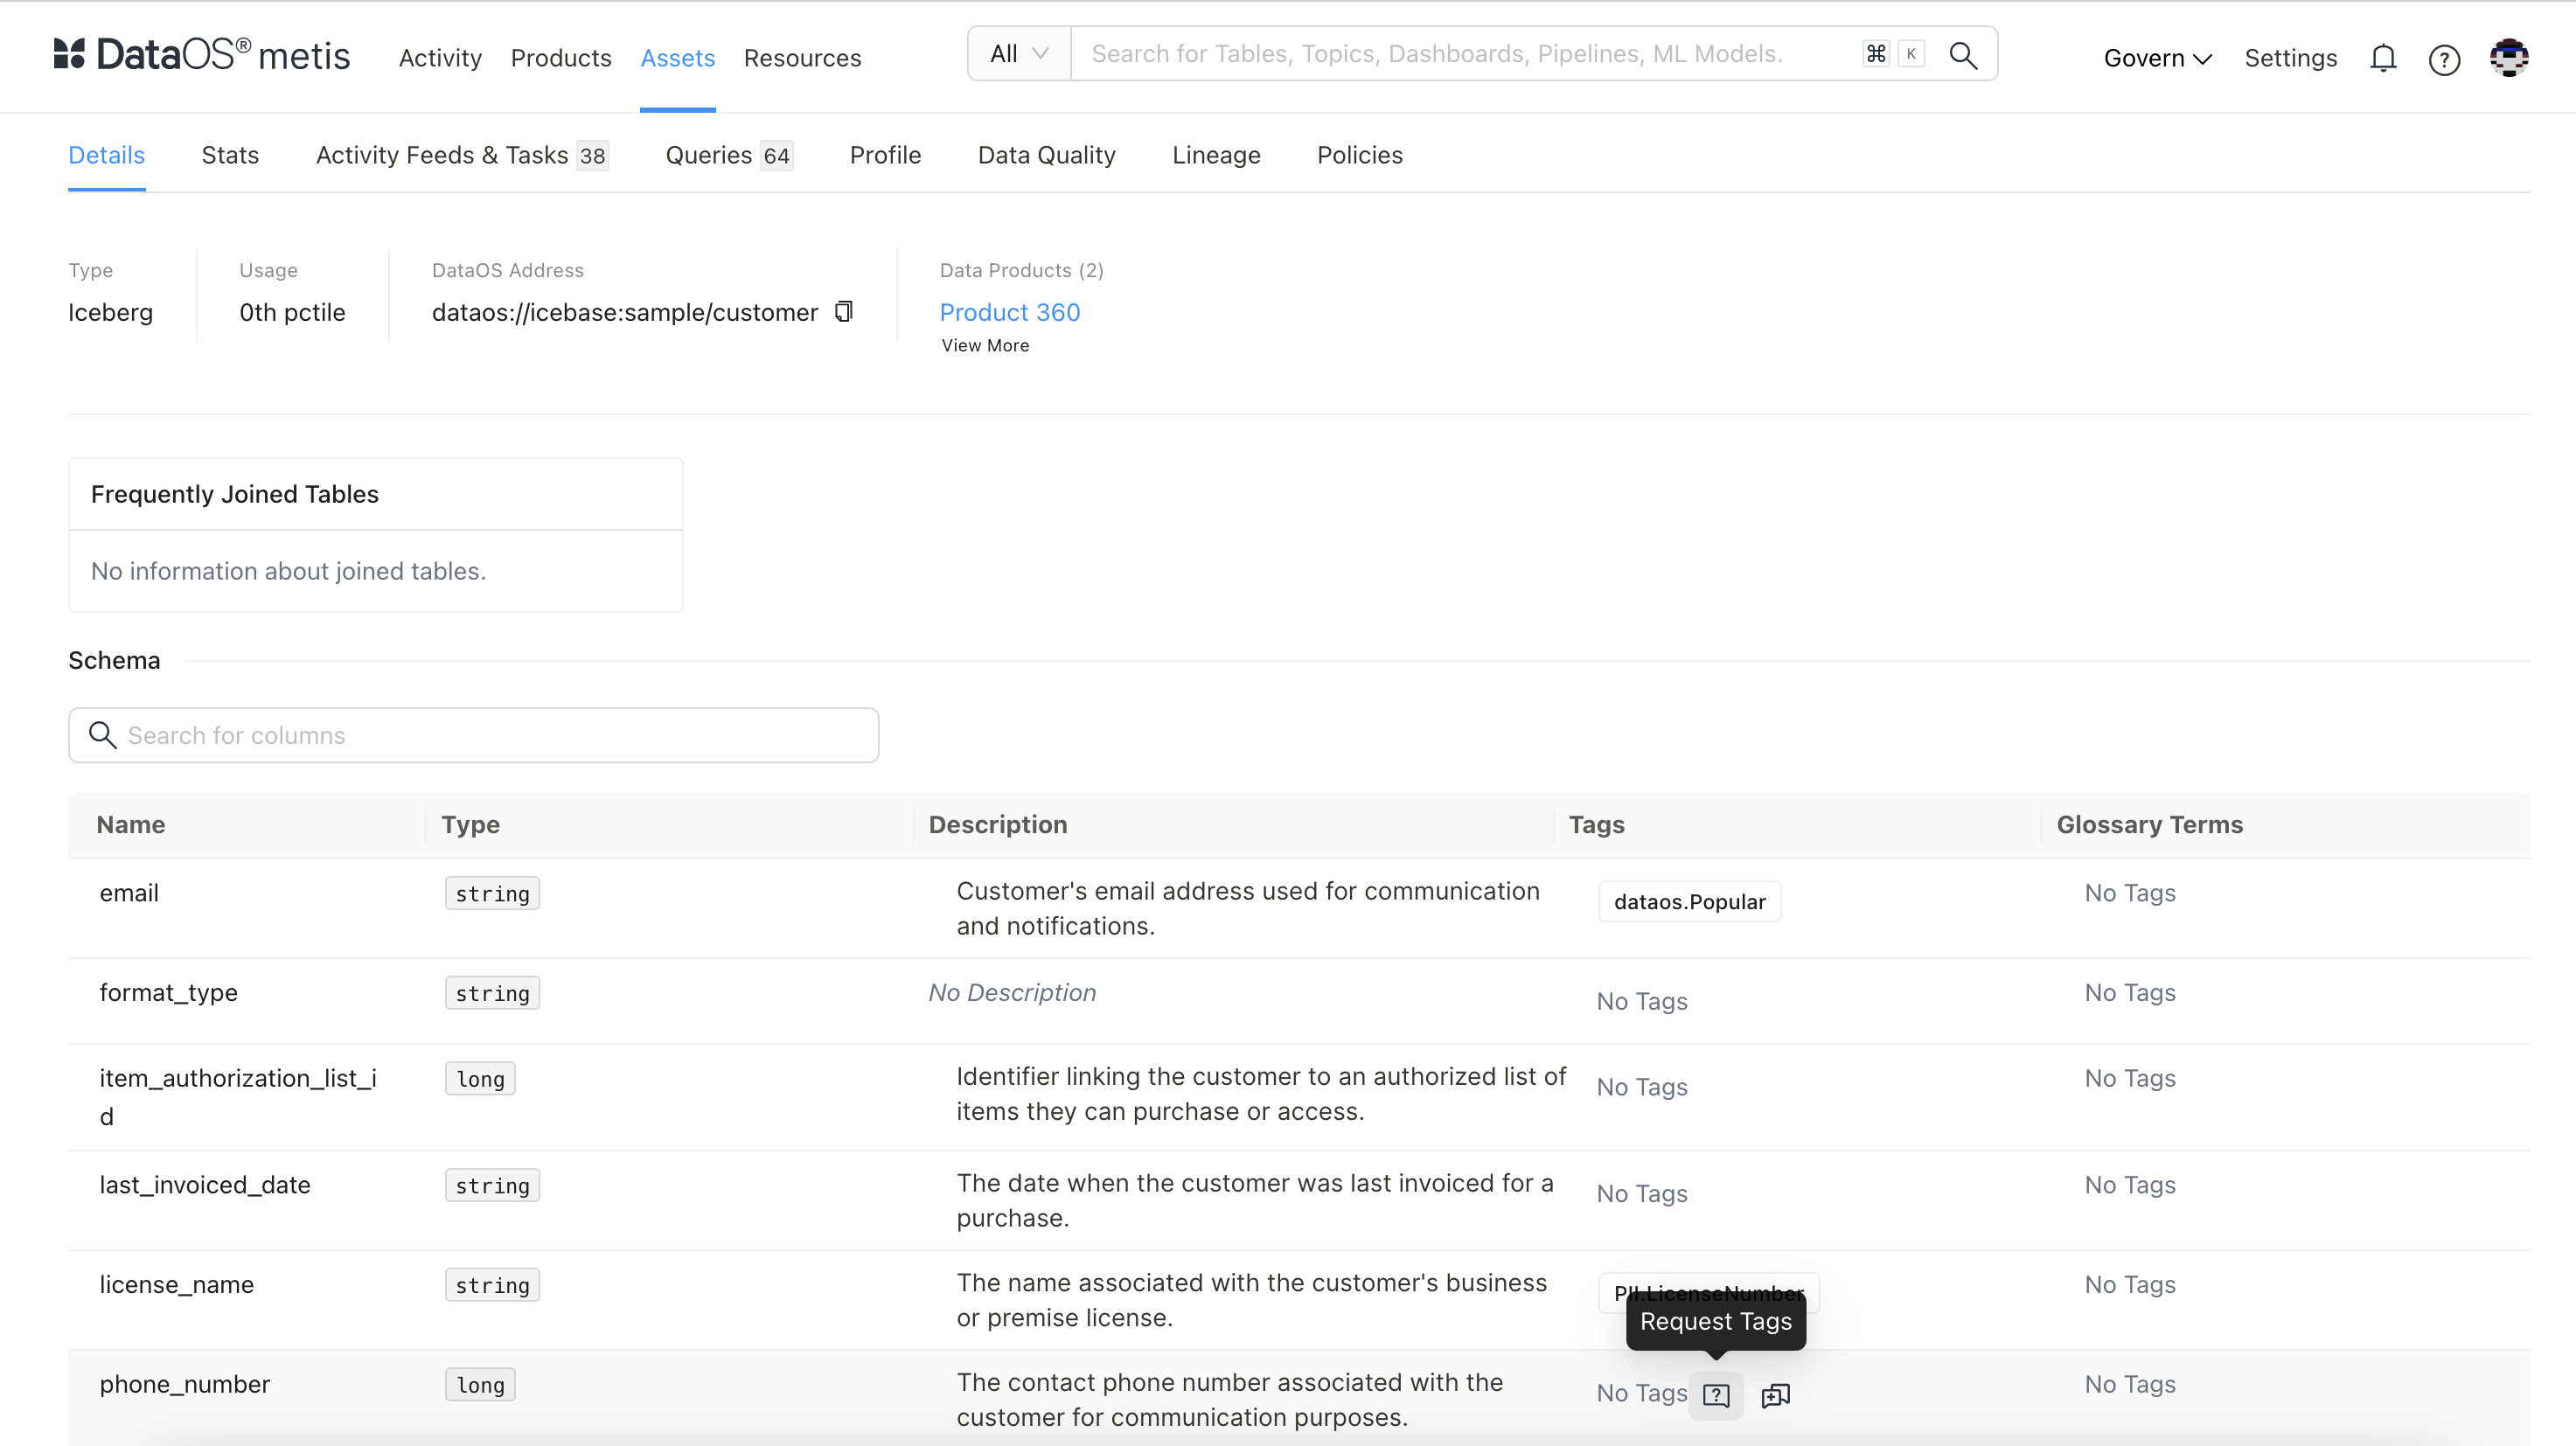
You’ll also find comprehensive schema details, including table and column names, data types, descriptions, constraints, and any applied sensitive tags. In the Schema section, each column’s tags are visible—these help classify and track data elements for compliance and analytical relevance. If certain columns are missing tags, you can request additions based on your specific use case or regulatory needs. Tags play a vital role in ensuring data is properly categorized, governed, and aligned with enterprise standards.
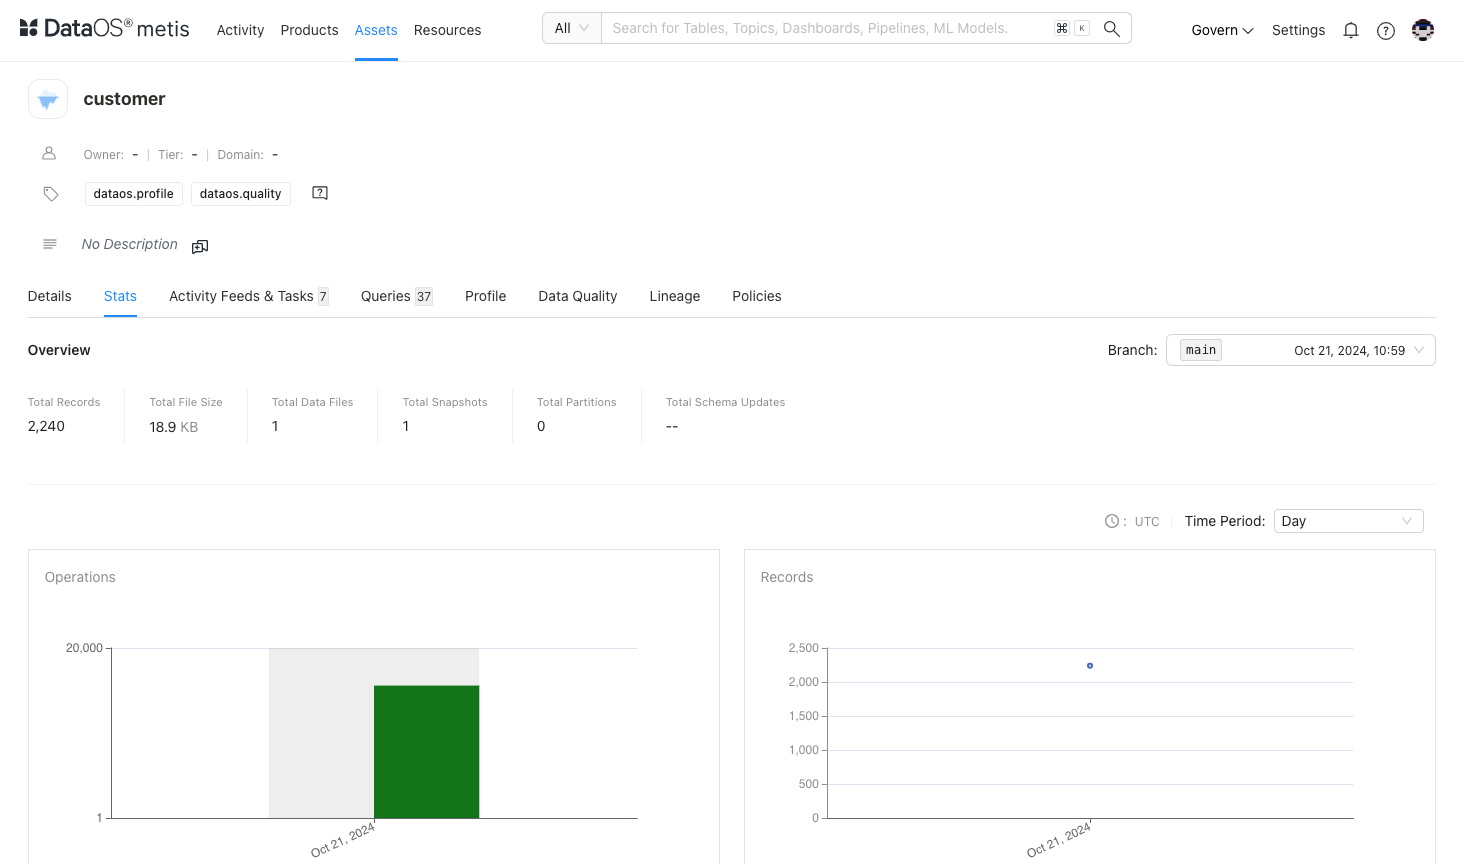
Review stats & activity feeds
Get an overview of the dataset structural information such as, total records, file size, partitions, snapshots, schema updates , etc. Activity feeds gives you an idea about conversations around the dataset and tasks created.
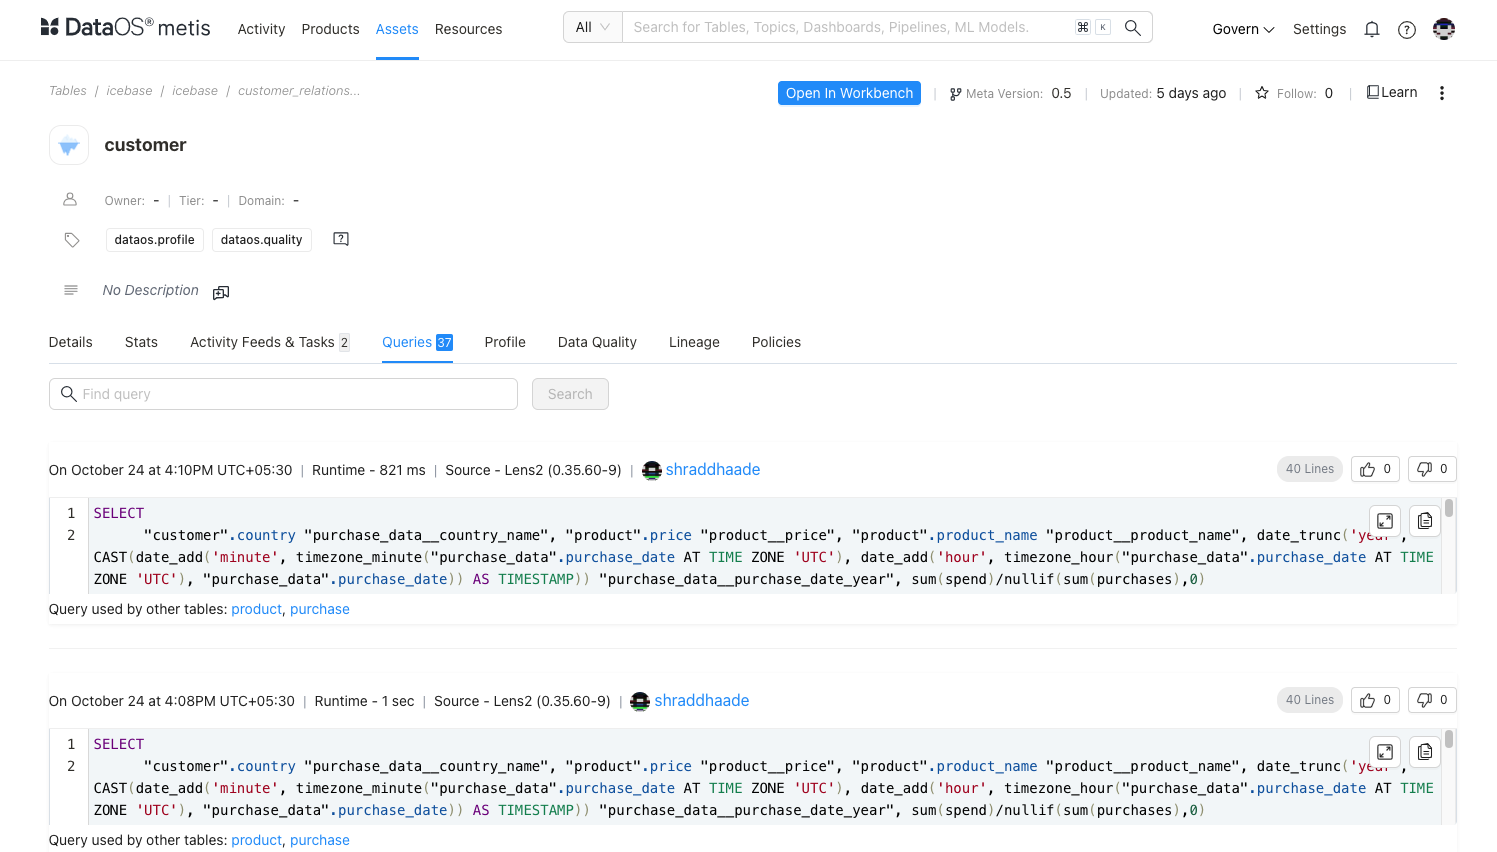
Inspect queries and data profiling
-
The Queries section provides insights into how frequently the dataset is queried, indicating its utility and relevance in real-world scenarios.
-
Data profiling results on Metis show valuable metrics on data distribution and column profiles, helping you know whether the dataset’s structure aligns with your analytical needs.
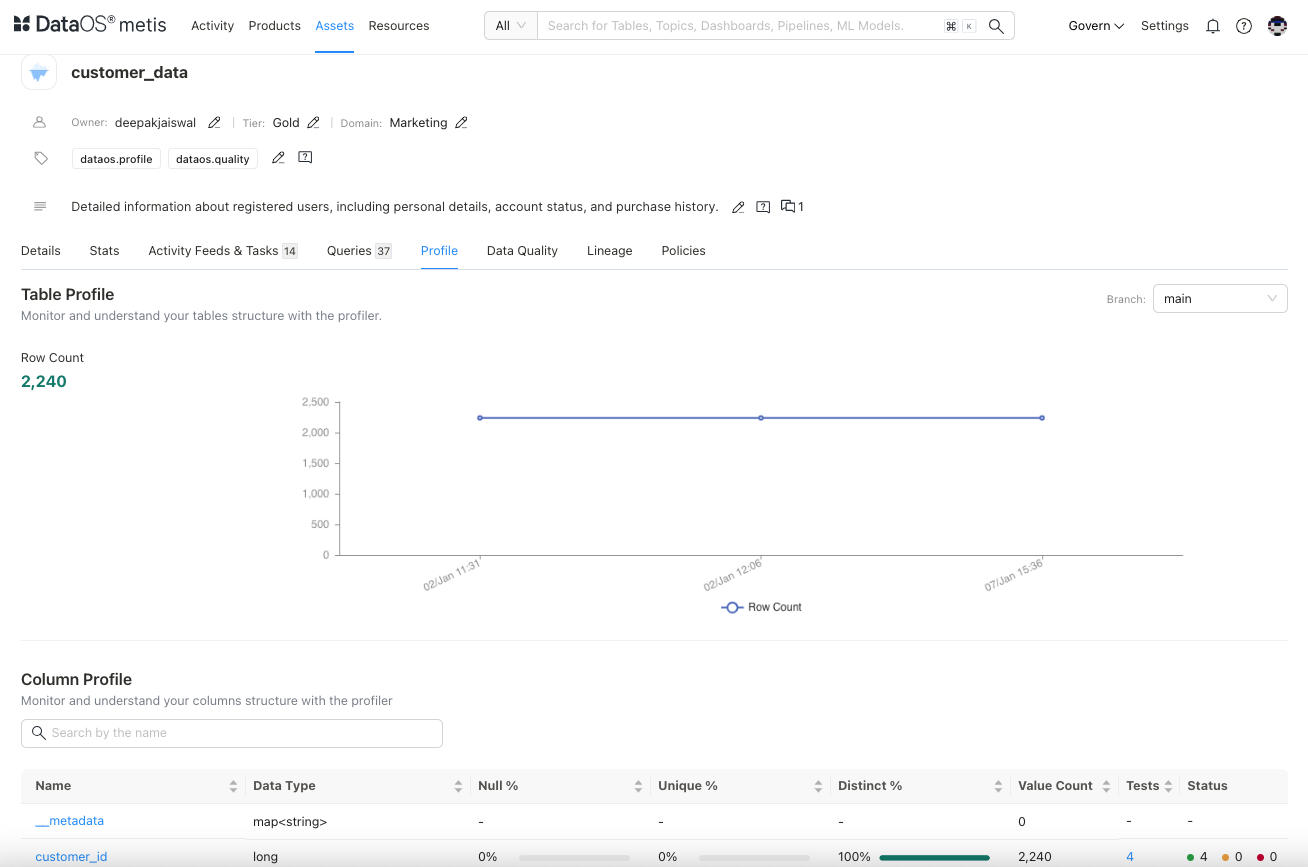
-
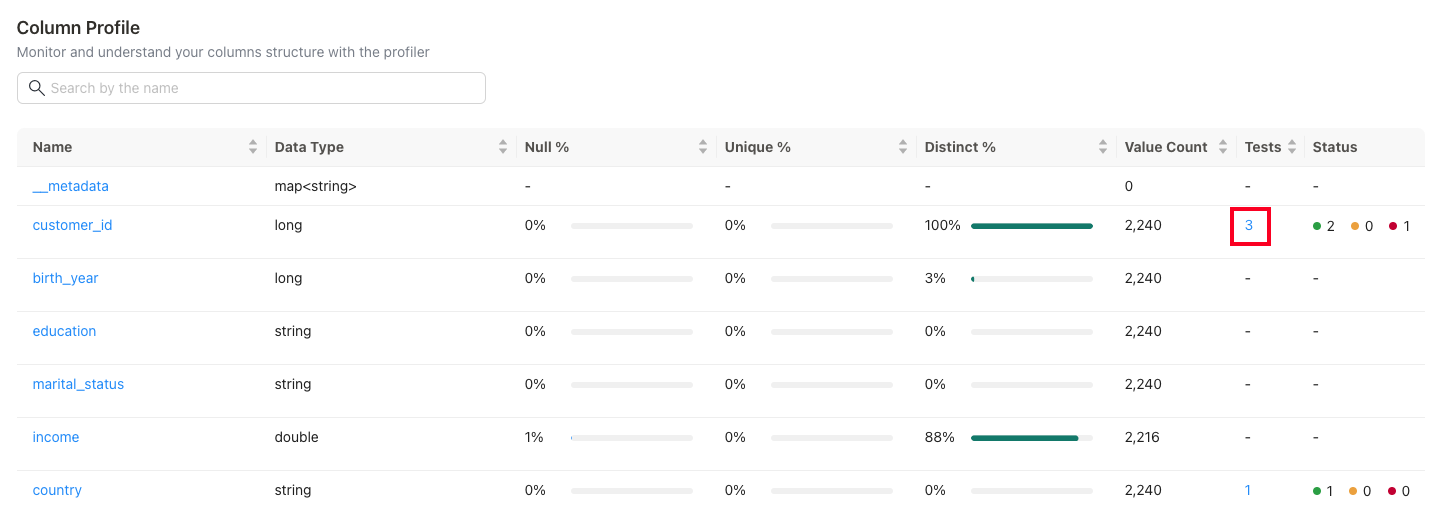
Column profile helps you find the distribution of values within each field, null values, unique values, etc. This can highlight patterns or outliers, indicating anomalies or irregularities that might require further investigation. Understanding these patterns allows you to validate assumptions about the data. For this dataset, there are no missing values for the column of interest.
You can further investigate the quality issues if any, by clicking on the number of tests.
Check Data Quality
The information includes data validation rules for the customer dataset, organized by type (table-level or column-level) and focus area (Schema, Accuracy, Completeness, Validity). Each rule is paired with recent run statuses ('Last 5 Runs') to monitor ongoing compliance.
This information is critical to assess the dataset’s integrity. Monitoring these checks allows quick identification and correction of data issues, improving reliability for downstream processes.
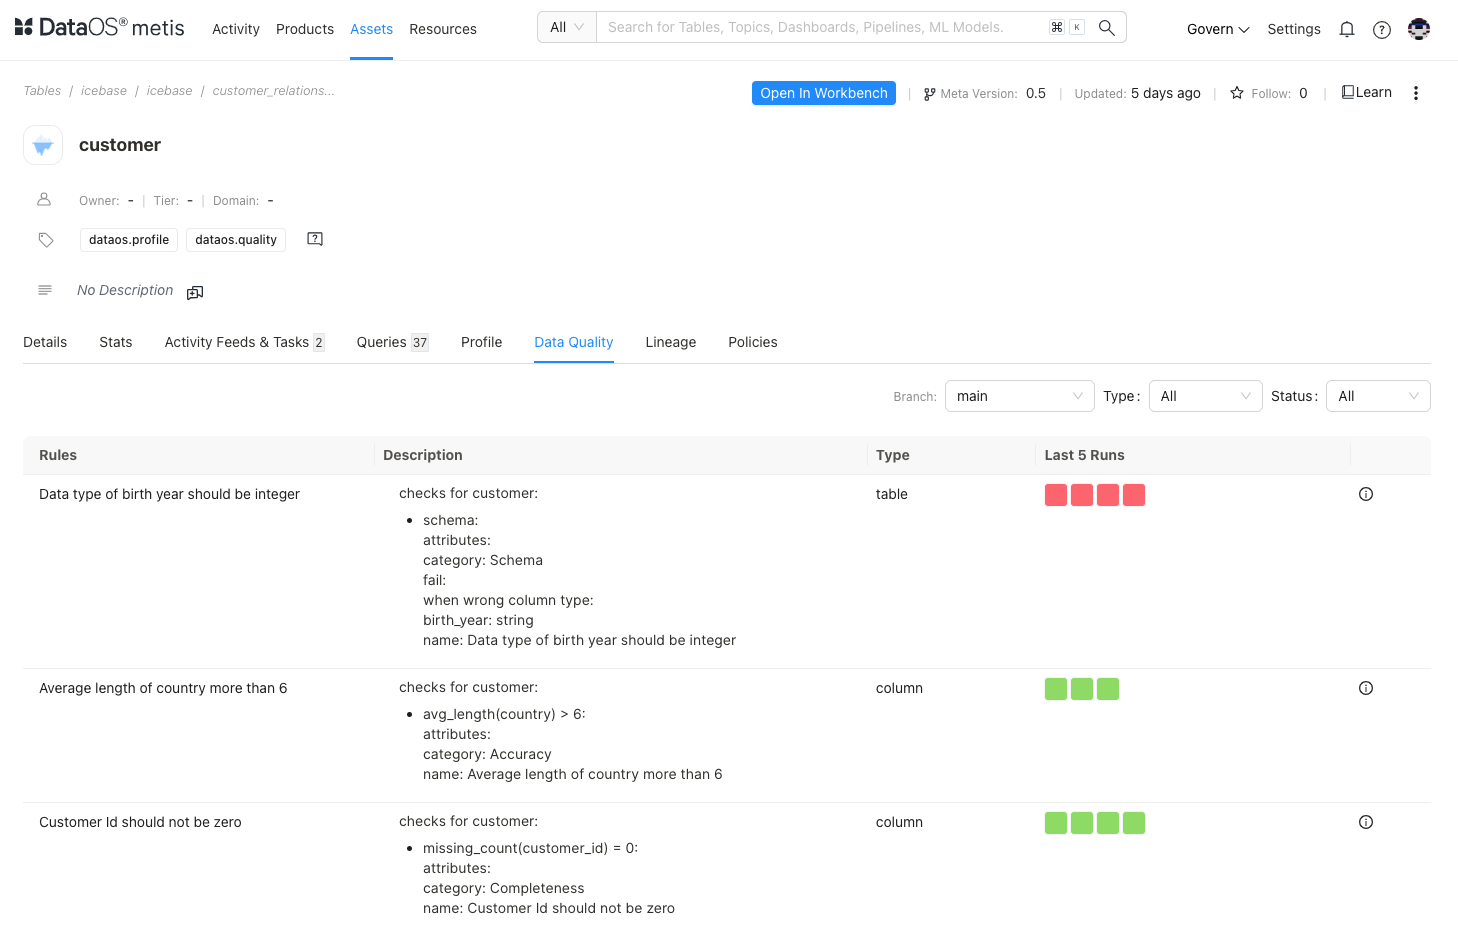
Based on the provided rules and their descriptions, potential quality issues and the probable action are listed :
| Issue | Rule | Description | Action |
|---|---|---|---|
| Data Type Mismatch | Birth year should be integer | Non-integer values in birth_year may cause processing errors. |
Convert to integers and enforce integer format validation during entry. |
| Country Field Accuracy | Avg. length of country > 6 | Short entries in country may indicate incomplete or incorrect names. |
Standardize to full names and apply cleaning to correct abbreviations or incomplete data. |
| Customer ID Completeness | Customer ID should not be zero | Zero values in customer_id may imply missing or placeholder IDs, affecting uniqueness. |
Replace zero values with unique IDs; review processes to prevent zero entries. |
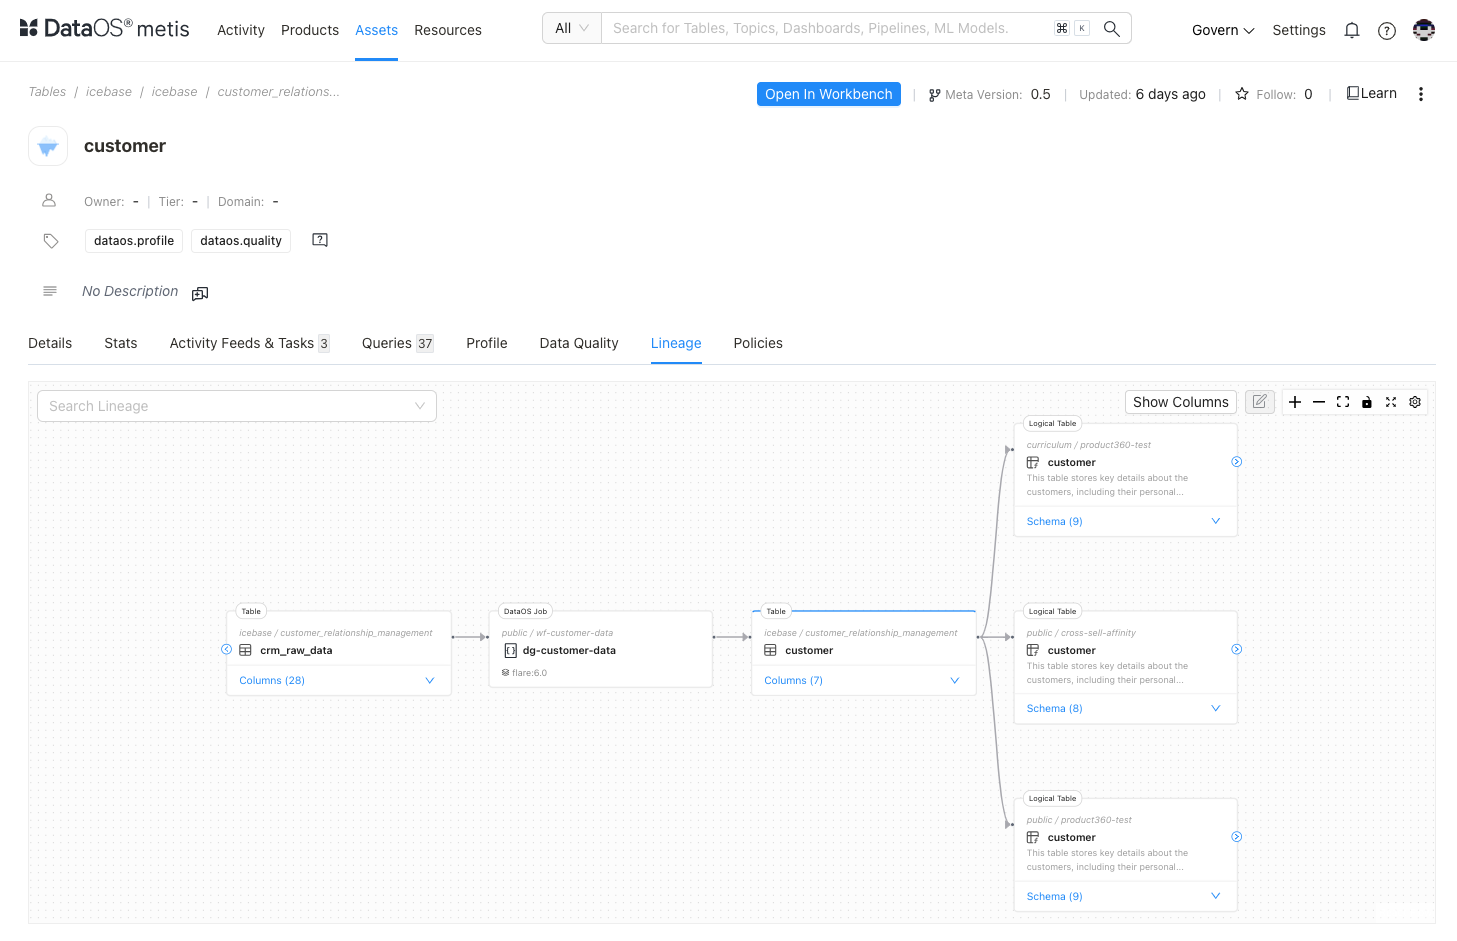
Investigate Data Lineage
View the lineage of the dataset to understand its source, transformations, and dependencies. By checking lineage, you can see the jobs that created and modified the dataset, helping you confirm that the data is prepared and processed to meet your use case requirements.
Confirm compliance policies
Finally, review policies associated with the dataset to ensure compliance with necessary governance and security standards. This ensures the dataset aligns with legal and regulatory requirements, safeguarding sensitive data. If required, you can suggest tags for columns to apply default policies
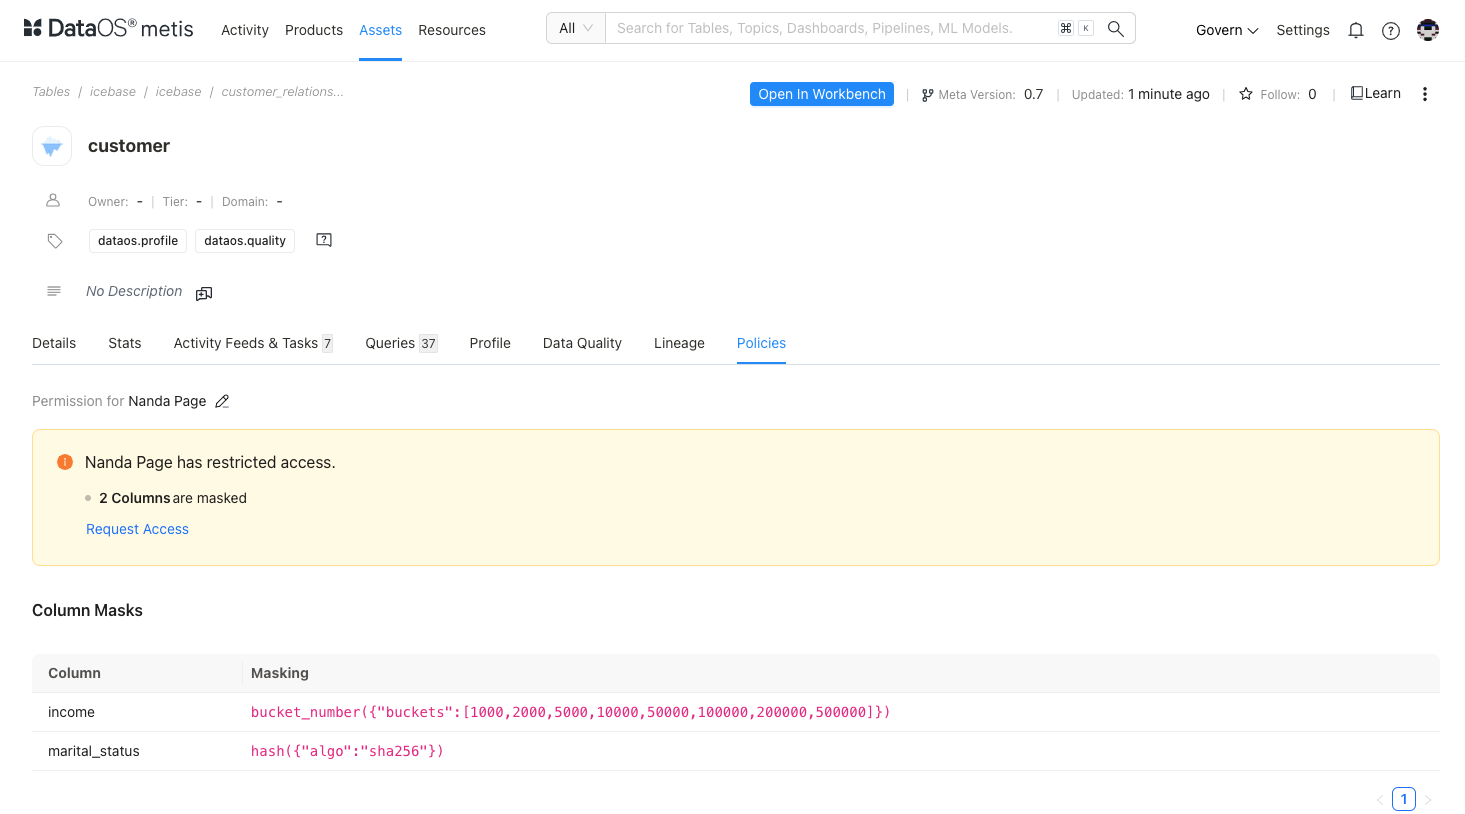
By following these steps, you gain a comprehensive understanding of the dataset’s quality, structure, and usage, ensuring it aligns with your specific analytical and business needs.
Step 3: Performing exploratory data analysis using Workbench
Now, you’re ready to dive into exploratory data analysis on DataOS Workbench. This web-based data exploration tool lets you run both simple and complex queries across a variety of relational databases, storage systems, and lakehouses. By doing this, you can examine the actual data and assess its suitability for your specific use case.
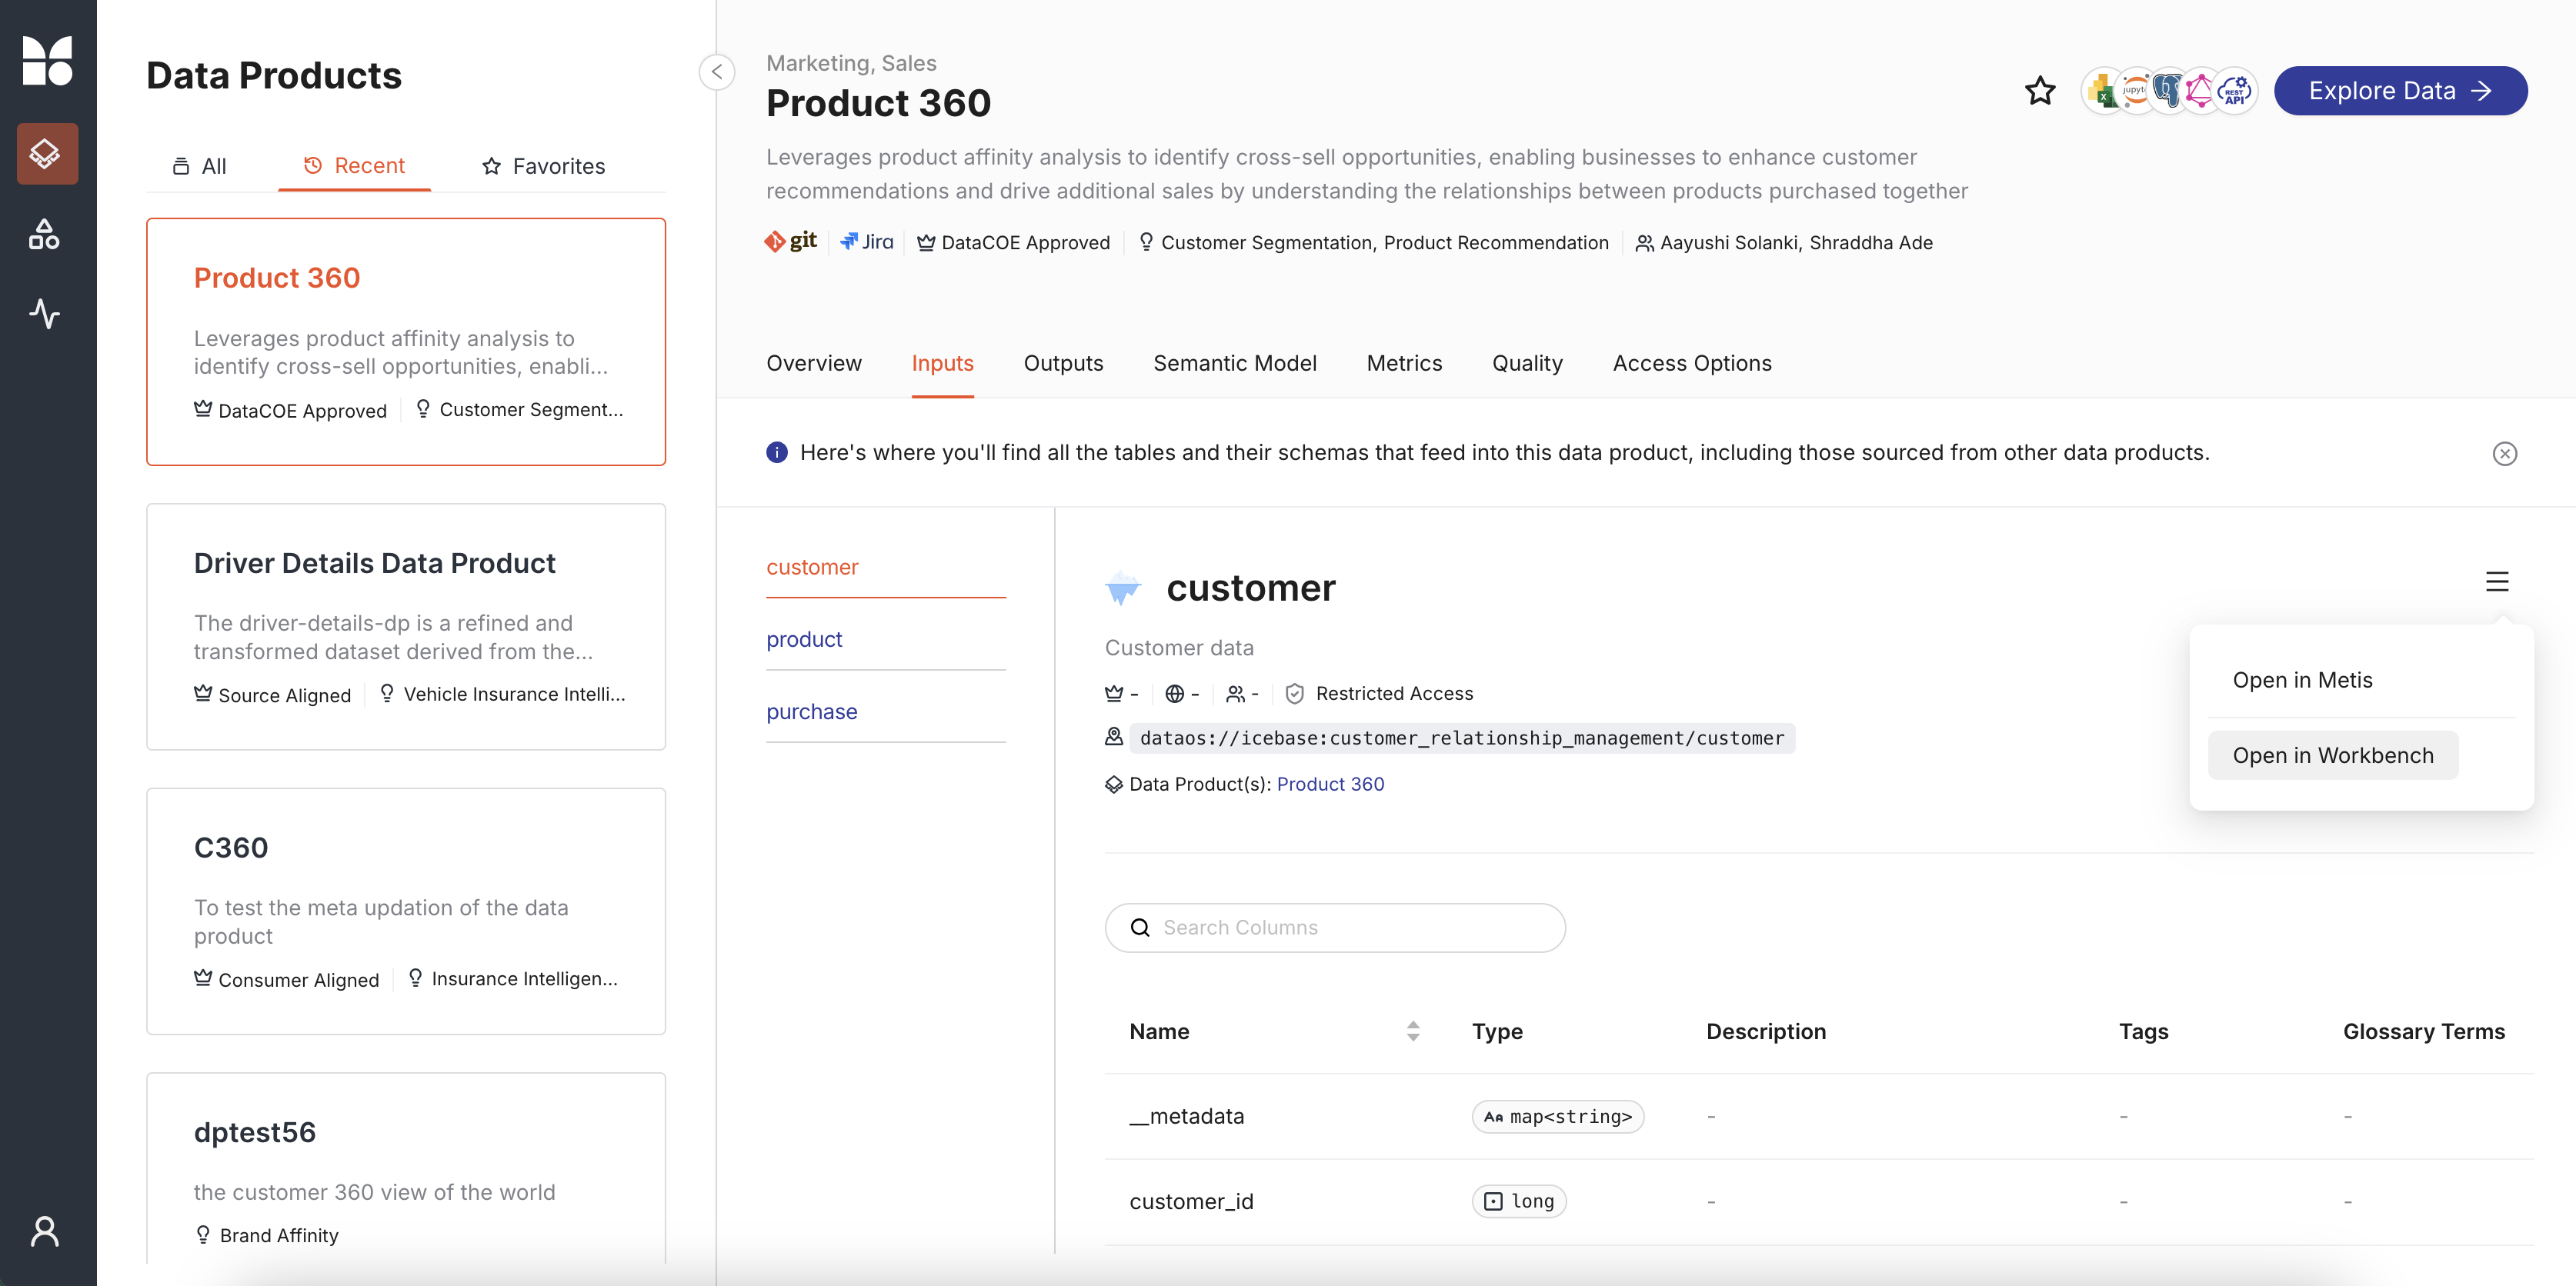
Open Workbench app
In the Data Product Hub, navigate to the Data Product details, select the desired dataset, and click 'Open in Workbench' to begin exploring.
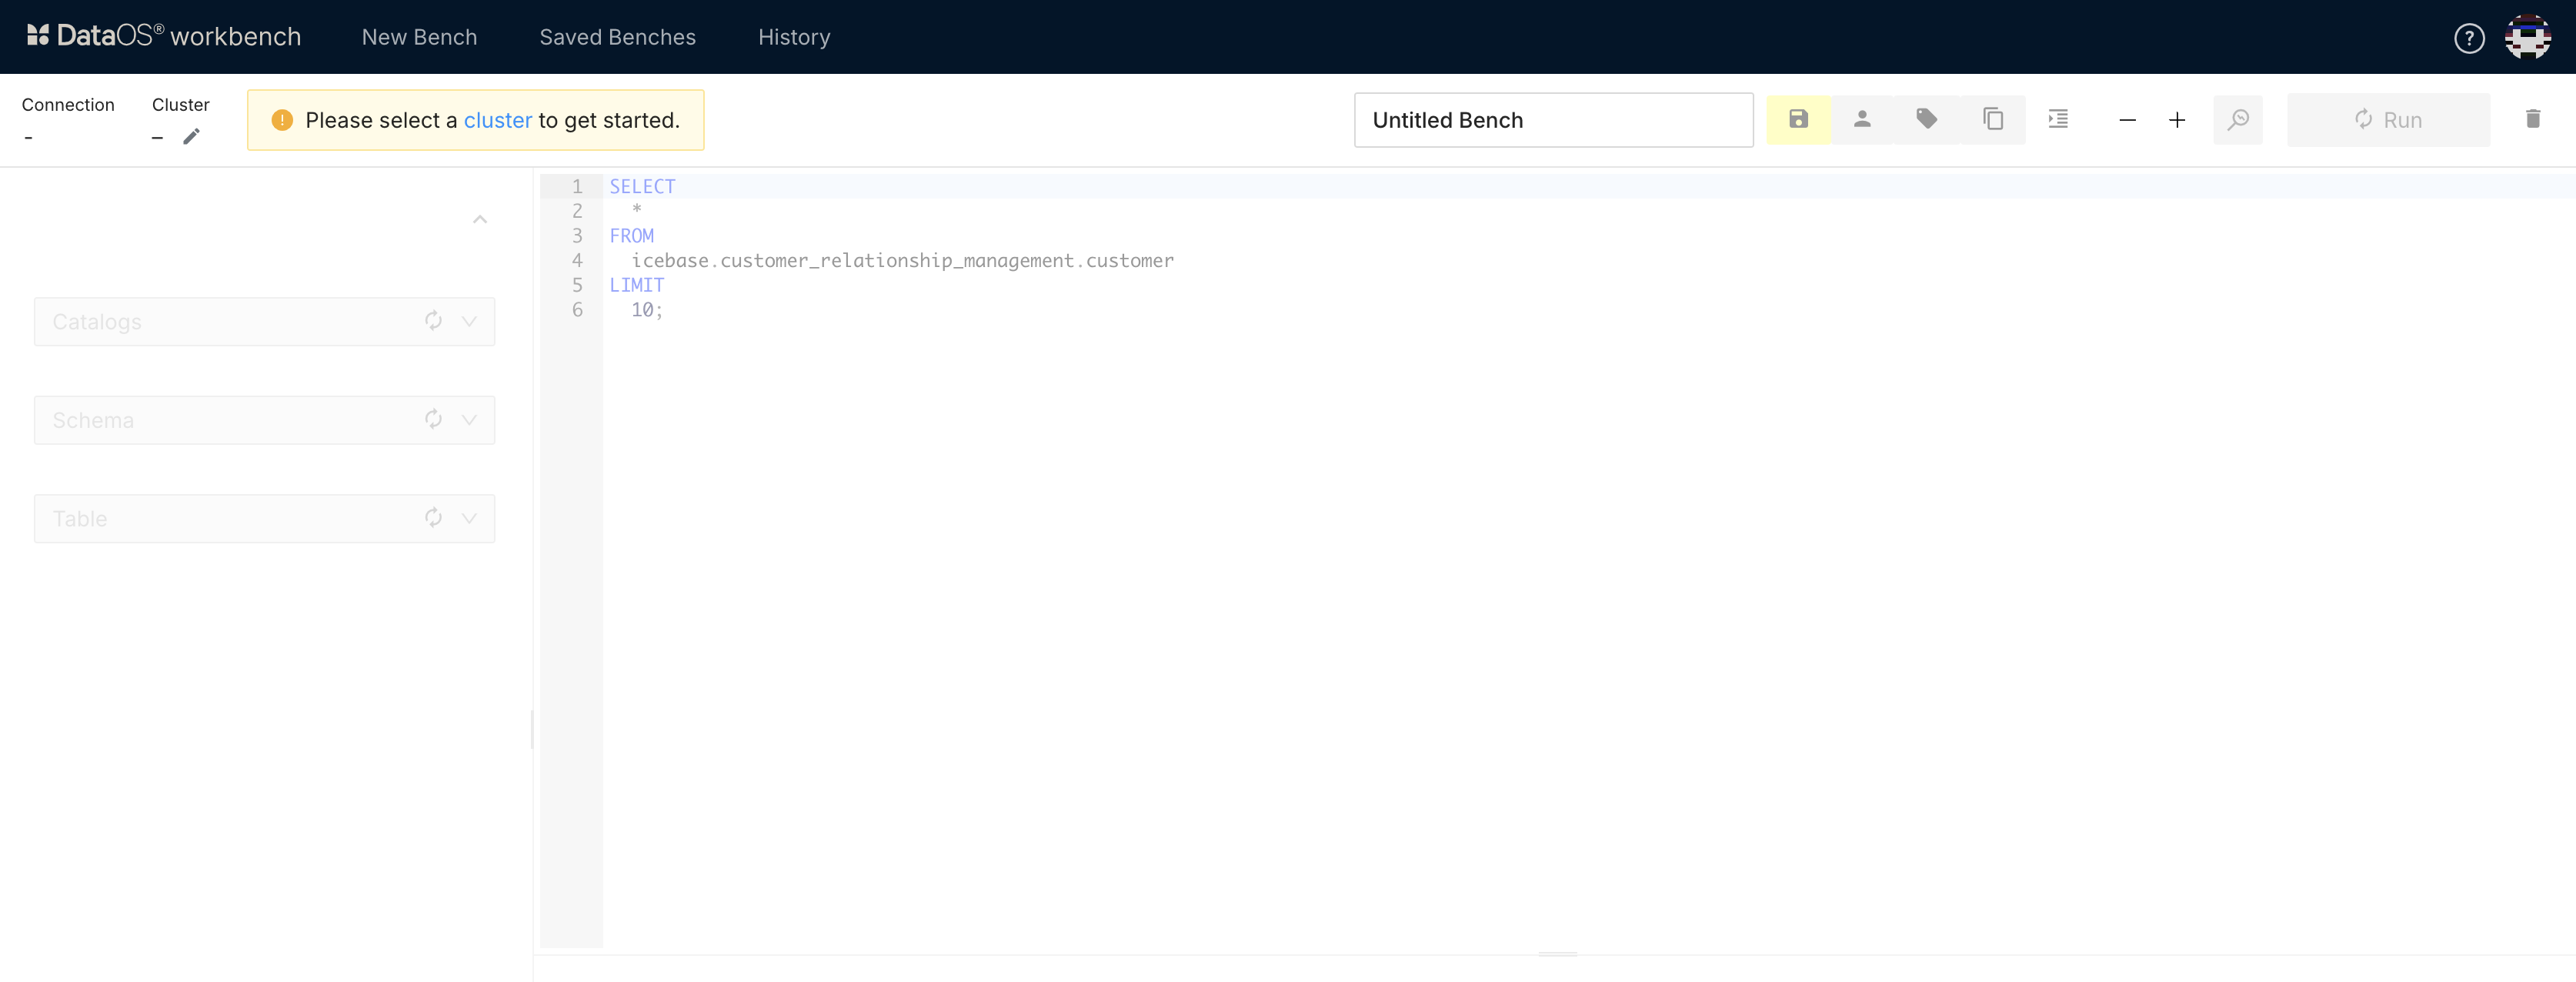
Select a Cluster
When you open the Workbench app, the first step is to select a cluster for your analytics workload. This cluster will handle the execution of your SQL scripts, and you should choose it based on your specific computing requirements.
Write and run your query
Determine what information you need and use a query language like SQL to write commands that retrieve and process your data. Here’s how:
Selecting Data: Use SELECT statements to specify which columns and rows to retrieve, helping you focus on relevant details.
Filtering Data: Add WHERE clauses to narrow down results based on specific conditions, making your data more targeted.
Joining Tables: Combine data across multiple tables with JOIN operations to get a complete view.
Aggregating Data: Apply functions like SUM, AVG, COUNT, MAX, and MIN to perform calculations and summarize insights.
Sorting and Grouping: Organize results with ORDER BY for sorting and GROUP BY for grouping, enabling easy comparison and summarization.
Run your query.
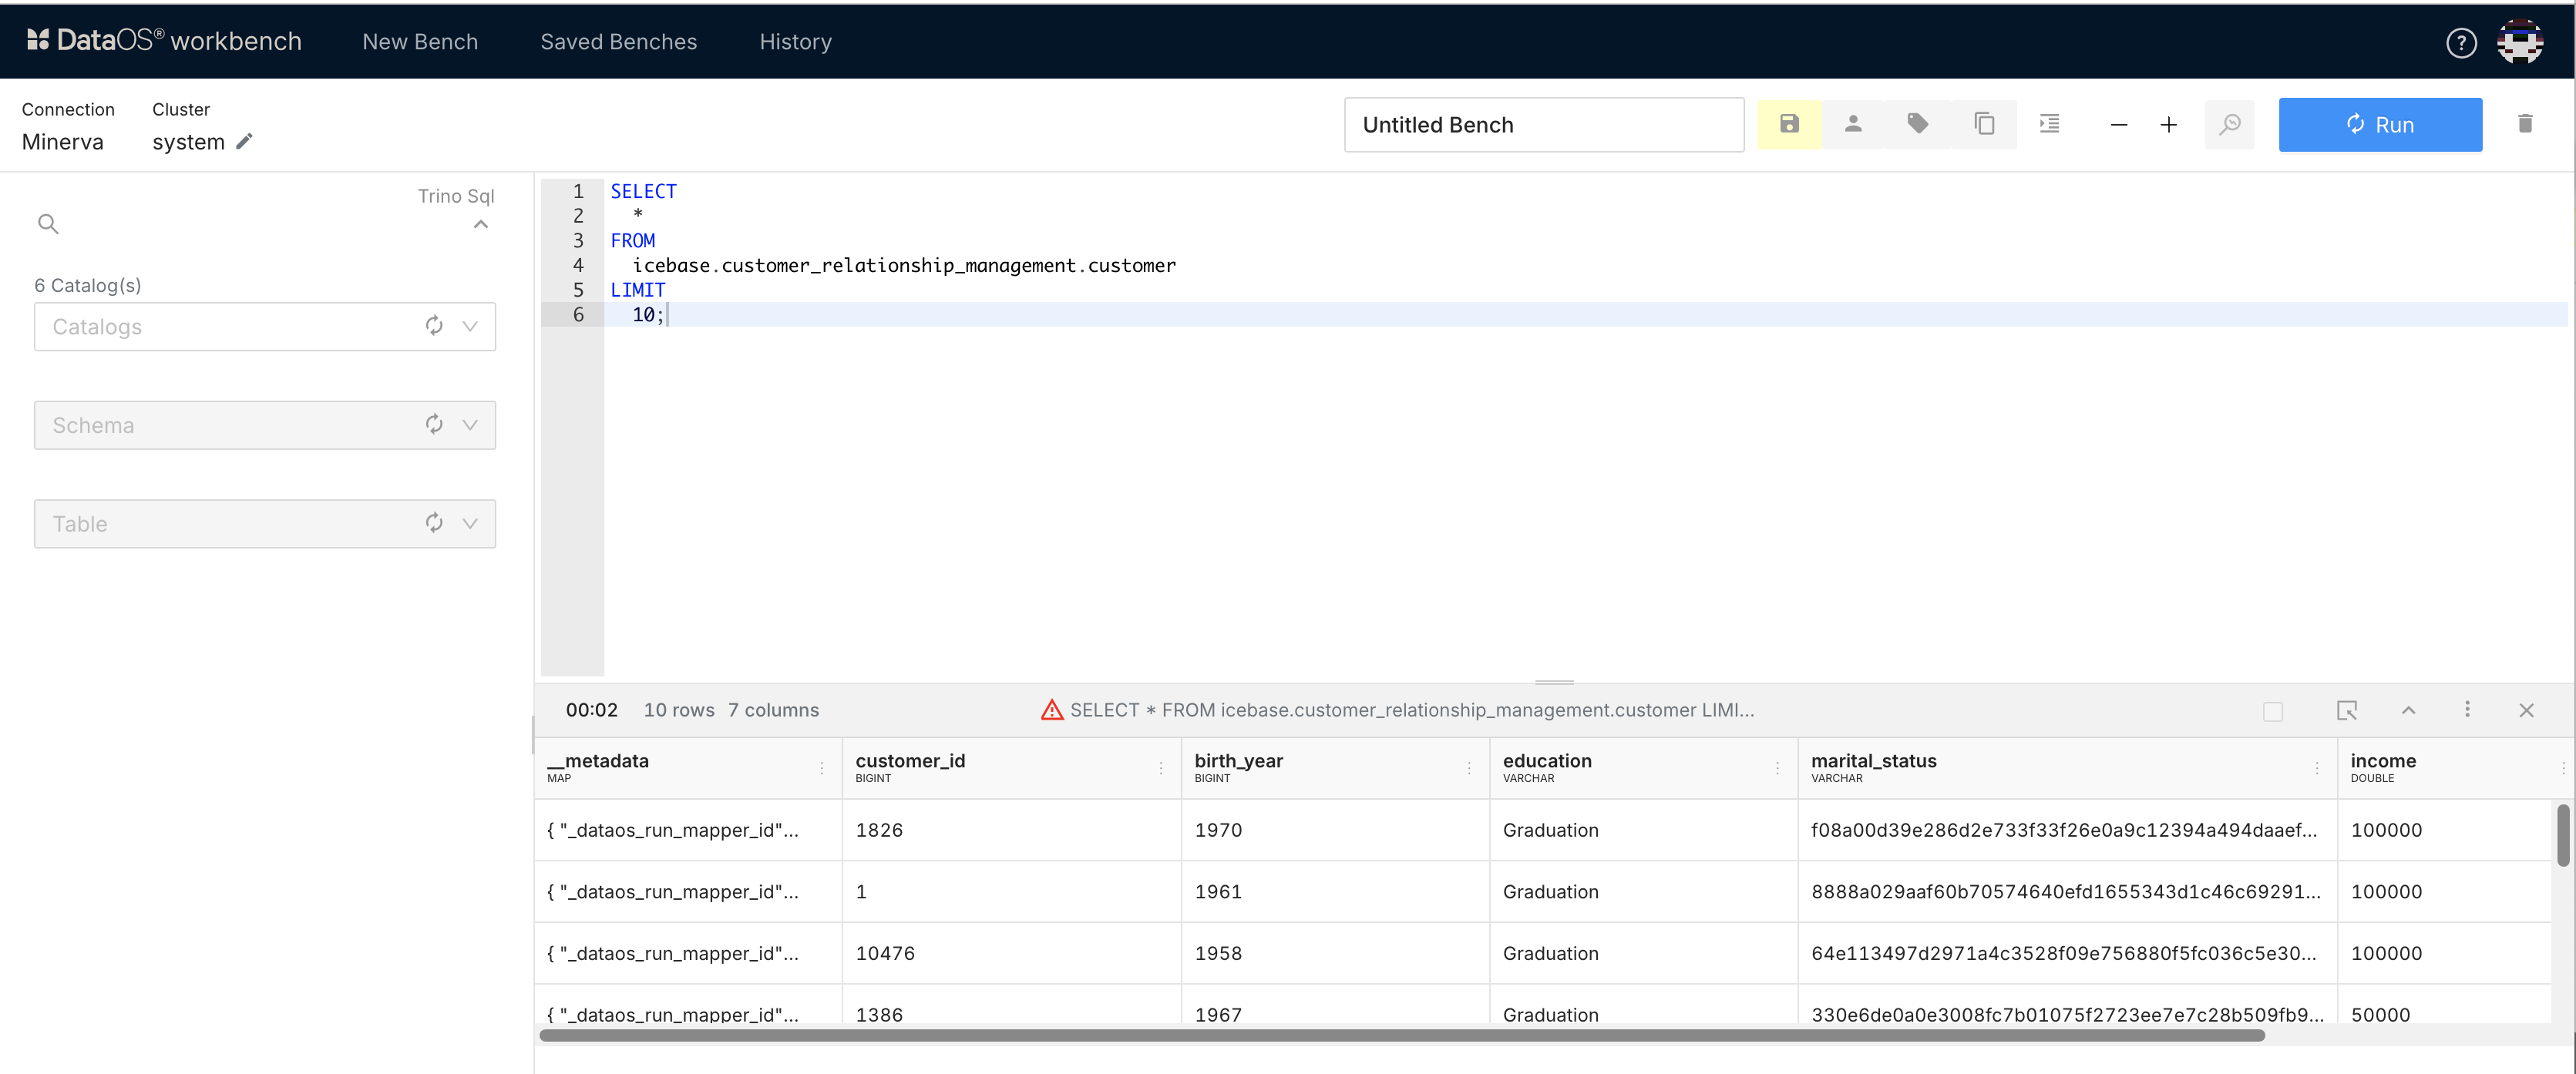
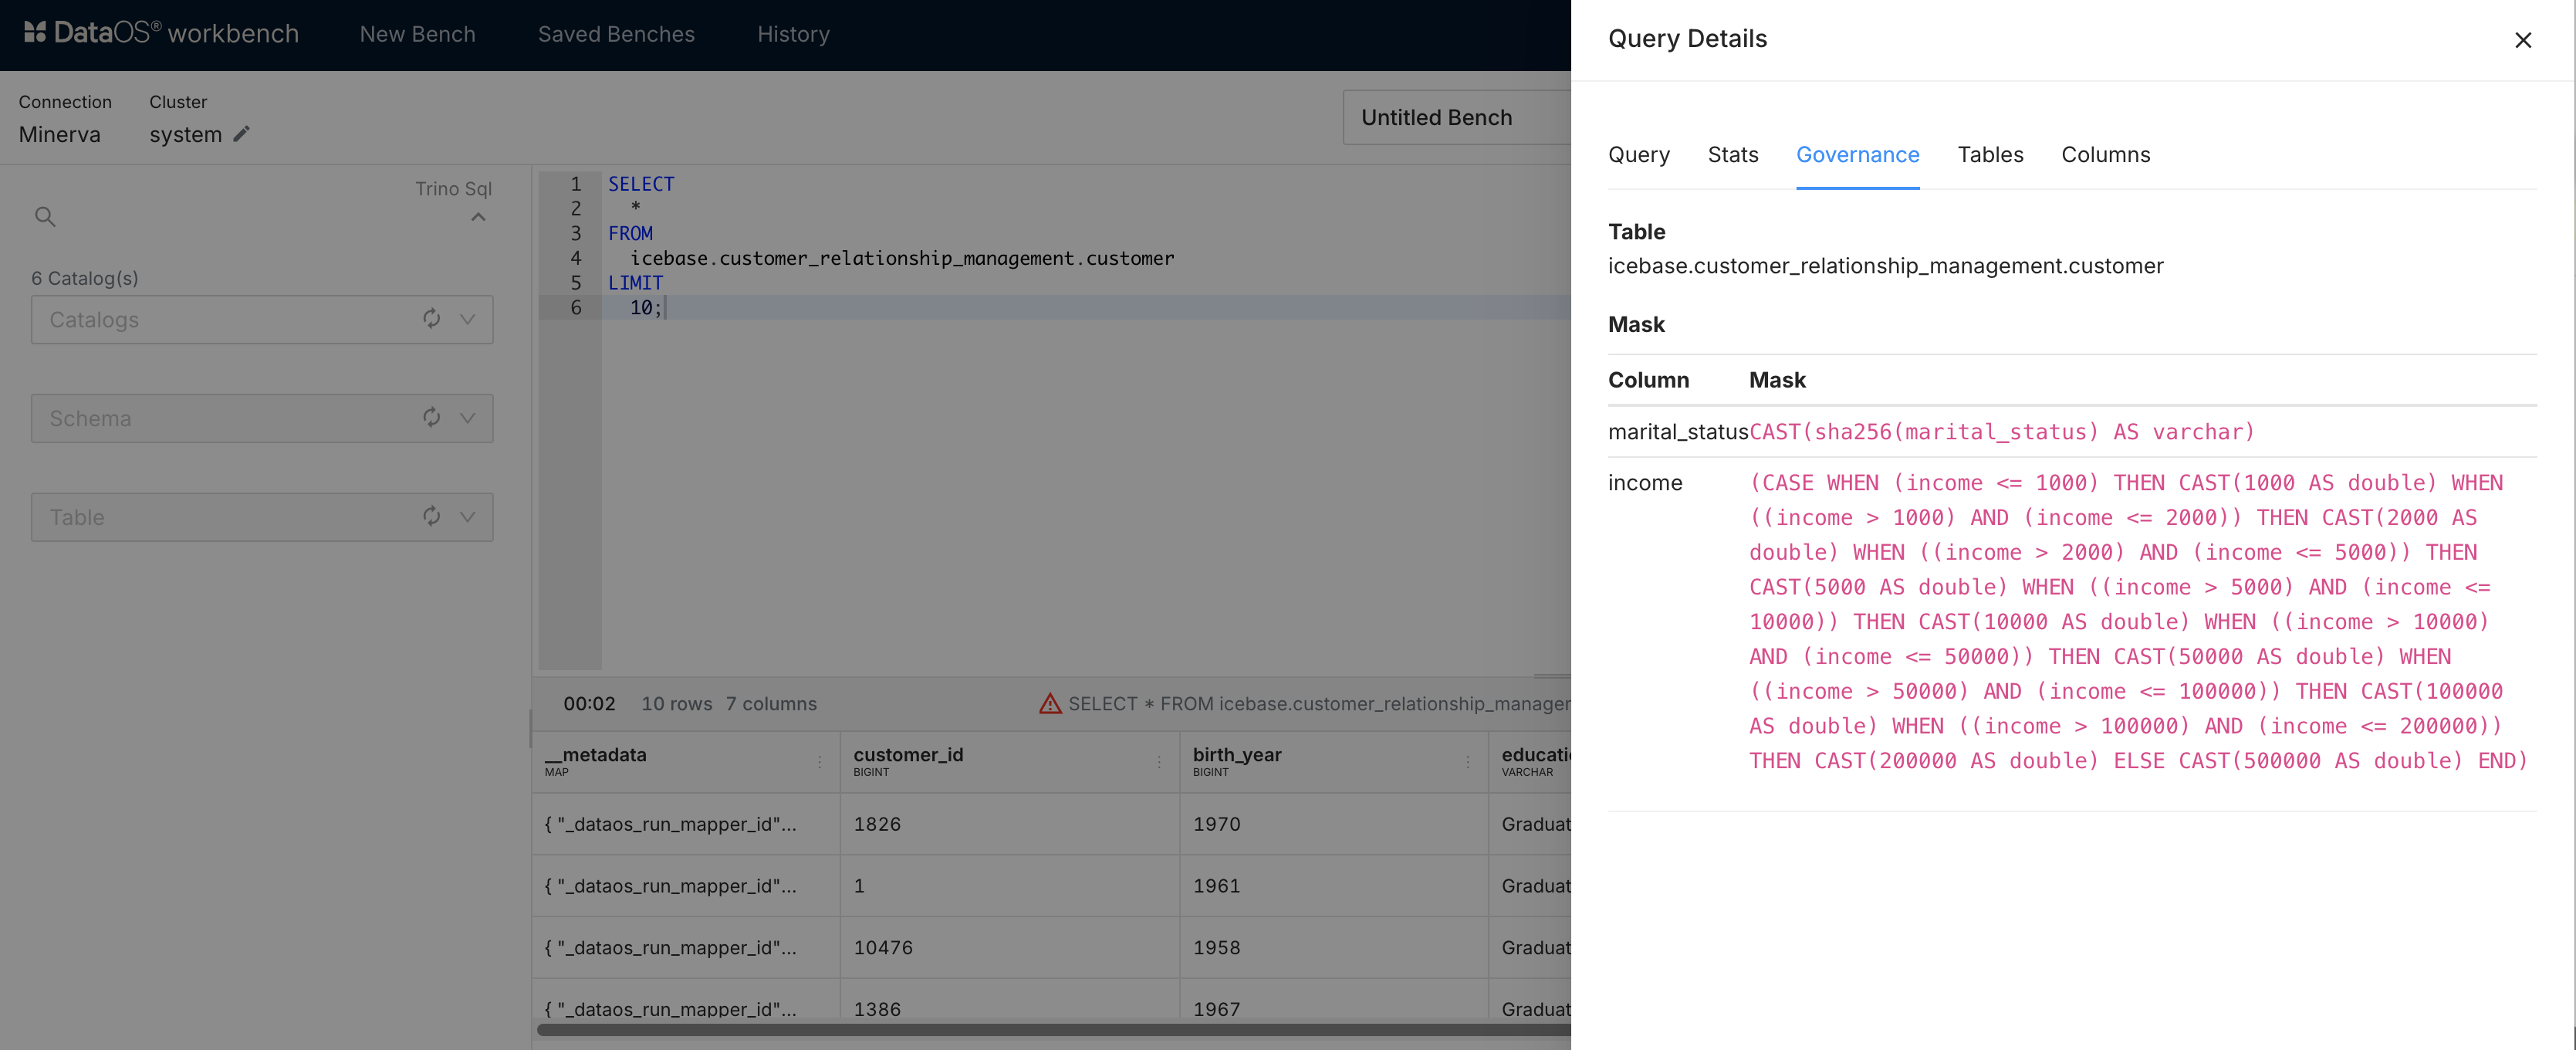
View results and policies
Check the results of your query and review any applied governance policies. The details of the query can be seen after it has run. A cautionary red triangle will appear in the result bar If a governance policy has been applied to the table being queried. Click on it to see the details.
Best practices
-
Assess metadata thoroughly: Check for accurate descriptions of datasets and columns.
-
Evaluate data profiling metrics: Inspect column profiles for null values, unique counts, and patterns. Use this to detect outliers or anomalies early.
-
Investigate lineage and dependencies: Understand data transformations and sources. This information will help you understand whether the dataset meets the use-case requirements.
-
Check governance policies: Know about compliance with regulatory and security standards, especially for sensitive data fields. You can
⚠️ Do’s & Don’ts
| ✅ Do | ❌ Don't |
|---|---|
| Request missing column descriptions | Rely on datasets with failed validations |
| Use lineage to confirm transformations | Overlook untagged sensitive data |
| Validate metrics before analysis | Skip policy reviews |
For instance, the email and phone columns in the following dataset lack tags to identify them as sensitive data, you can request the addition of appropriate tags to ensure their protection.
Self-check quiz
1. Why are column-level tags important in the schema section?
A. They increase dataset size
B. They ensure faster queries
C. They support governance and compliance
D. They add color coding to columns
2. What is the function of a Uniform Data Link (UDL) in DataOS?
A. It formats the schema of datasets
B. It uniquely identifies a dataset across the platform
C. It encrypts the dataset
D. It visualizes the lineage
3. You're exploring the Product Affinity Data Product and notice missing tags for customer email and phone columns in the input dataset. What should you do?
A. Ignore them if the data seems usable
B. Delete those columns from the dataset
C. Request the addition of appropriate tags for compliance
D. Manually edit the schema structure in Metis
4. While reviewing the quality tab of a dataset, you observe the rule “Customer ID should not be zero” has failed in 3 of the last 5 runs. What does this indicate?
A. The dataset is ready for analysis
B. There is a governance policy misconfiguration
C. Some records may contain invalid IDs
D. The dataset size is too large
5. You’re tasked with verifying that a dataset meets specific regulatory requirements. Which of the following would be MOST relevant?
A. Queries tab and record count
B. Schema structure and column order
C. Tags, data quality checks, and policies
D. Owner and tier fields
Next step
Understand relationships and logic behind your data to drive meaningful insights, refer to the next module: