Market Basket Analysis via Explorer
Lens, an ecosystem-enabling entity layer, lets business users consume ontologies in different contexts. Business users and data app developers can use the lens ecosystem to power a variety of use cases.
🗣 Lens apps enable businesses to monitor key metrics, explore ontologies, and segment and activate customer data autonomously.
Once you have the modeled Lens, you can start asking the questions through Lens Explorer or Lens Query. In this section, we will explore how business users can independently use utilities like Lens Explorer and Metrics Explorer to answer business-specific questions.
Let’s delve into the use case.
Use case
Let's continue the use case we discussed while modeling Lens. The product owner can access the modeled lens in the Lens Explorer. Revisiting our use case -
🗣 The Loyalty program plans a winter campaign for one of our best-selling spirit brands. By recommending frequently purchased products alongside top-selling products, the campaign aims to increase the cart value of customers. Additionally, the product owner wishes to analyze the campaign's success/failure after launching it and optimize it further based on those observations.
Lens Explorer will help us identify:
- Product based on the top-selling brand of the season.
- Audiences(Brand Loyal Customers) for running the campaign.
- Frequently purchased products alongside the top-selling product.
- Frequently purchased products with high back order rates.
We track and observe these metrics to analyze a campaign using Metrics Explorer.
- We track the total revenue generated for the recommended brand.
- After finding a dip in revenue, we want to track order cancellations and anomalies for the recommended brand.
We will use the ‘Seasonal Brand Preference’ Lens for this case.
Analysis 1
Our goal is to identify top-selling brands by analyzing brands with high repurchase rates preferred by different accounts during the last winter season. In addition, this will help us identify sales channels where the 'Spirit' category was frequently purchased.
Once we have selected the dimensions and measures in the resulting table, we can filter our results to only include brands belonging to the ‘Spirit’ category sold in the winter of 2021. We can additionally order and limit our results to only show the top 5 brands.

Just a matter of a few clicks, and we have our findings.
Findings
As the top-selling brand primarily sold off-premises, we identified the brand Captain Morgan, having corporate class Rum.’
Analysis 2
Based on the previous analysis, we have narrowed down the product for which we wish to run the campaign. We will now identify the “brand loyal” off-premise accounts(customers) who are frequent purchasers of ‘Captain Morgan’ and prefer ‘Rum.’
In the Options section, we can set filters to achieve whatever level of granularity we want.
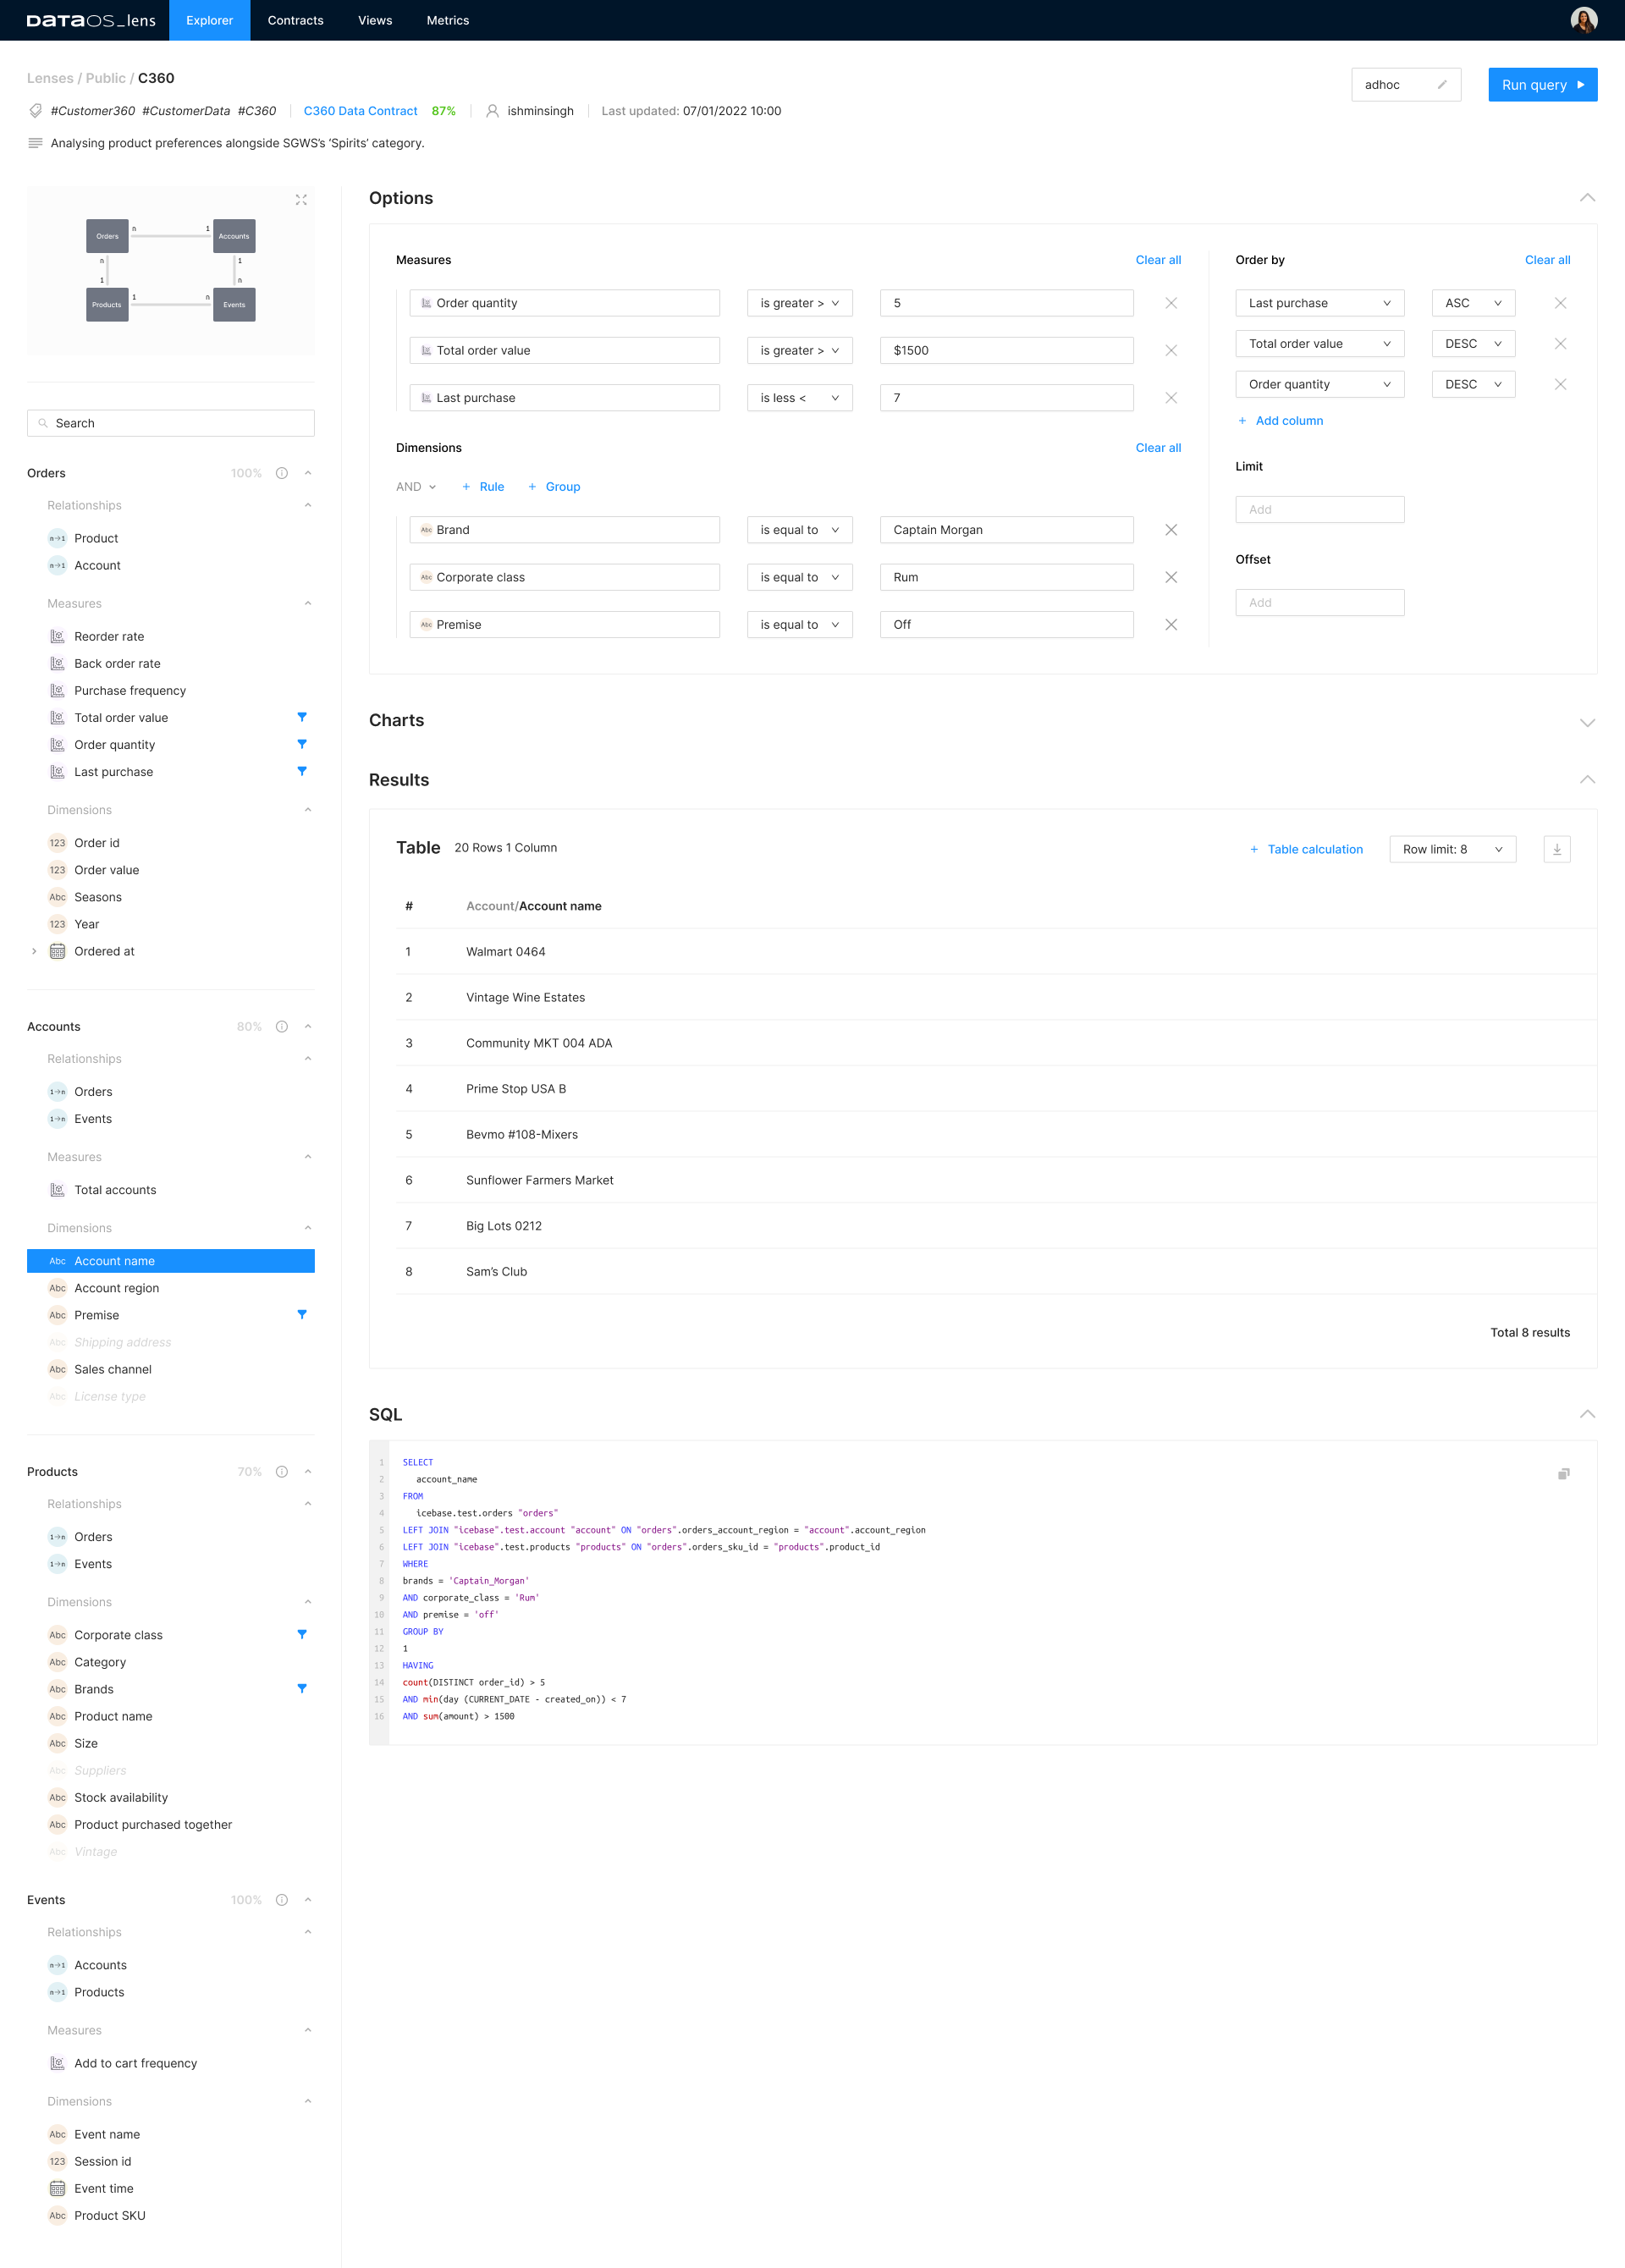
Findings
All the off-premise accounts that prefer Captain Morgan’s Rum Category.
We now have our Audience of loyal brand customers. All we need is the product frequently purchased with the product we identified in our previous analysis.
Analysis 3
After getting our Brand Loyal customers, we now wish to identify the product that is frequently purchased together with ‘Captain Morgan’s Spiced Rum.’ Once we have the frequently purchased product, we can run a recommendation campaign for our Loyal customers.
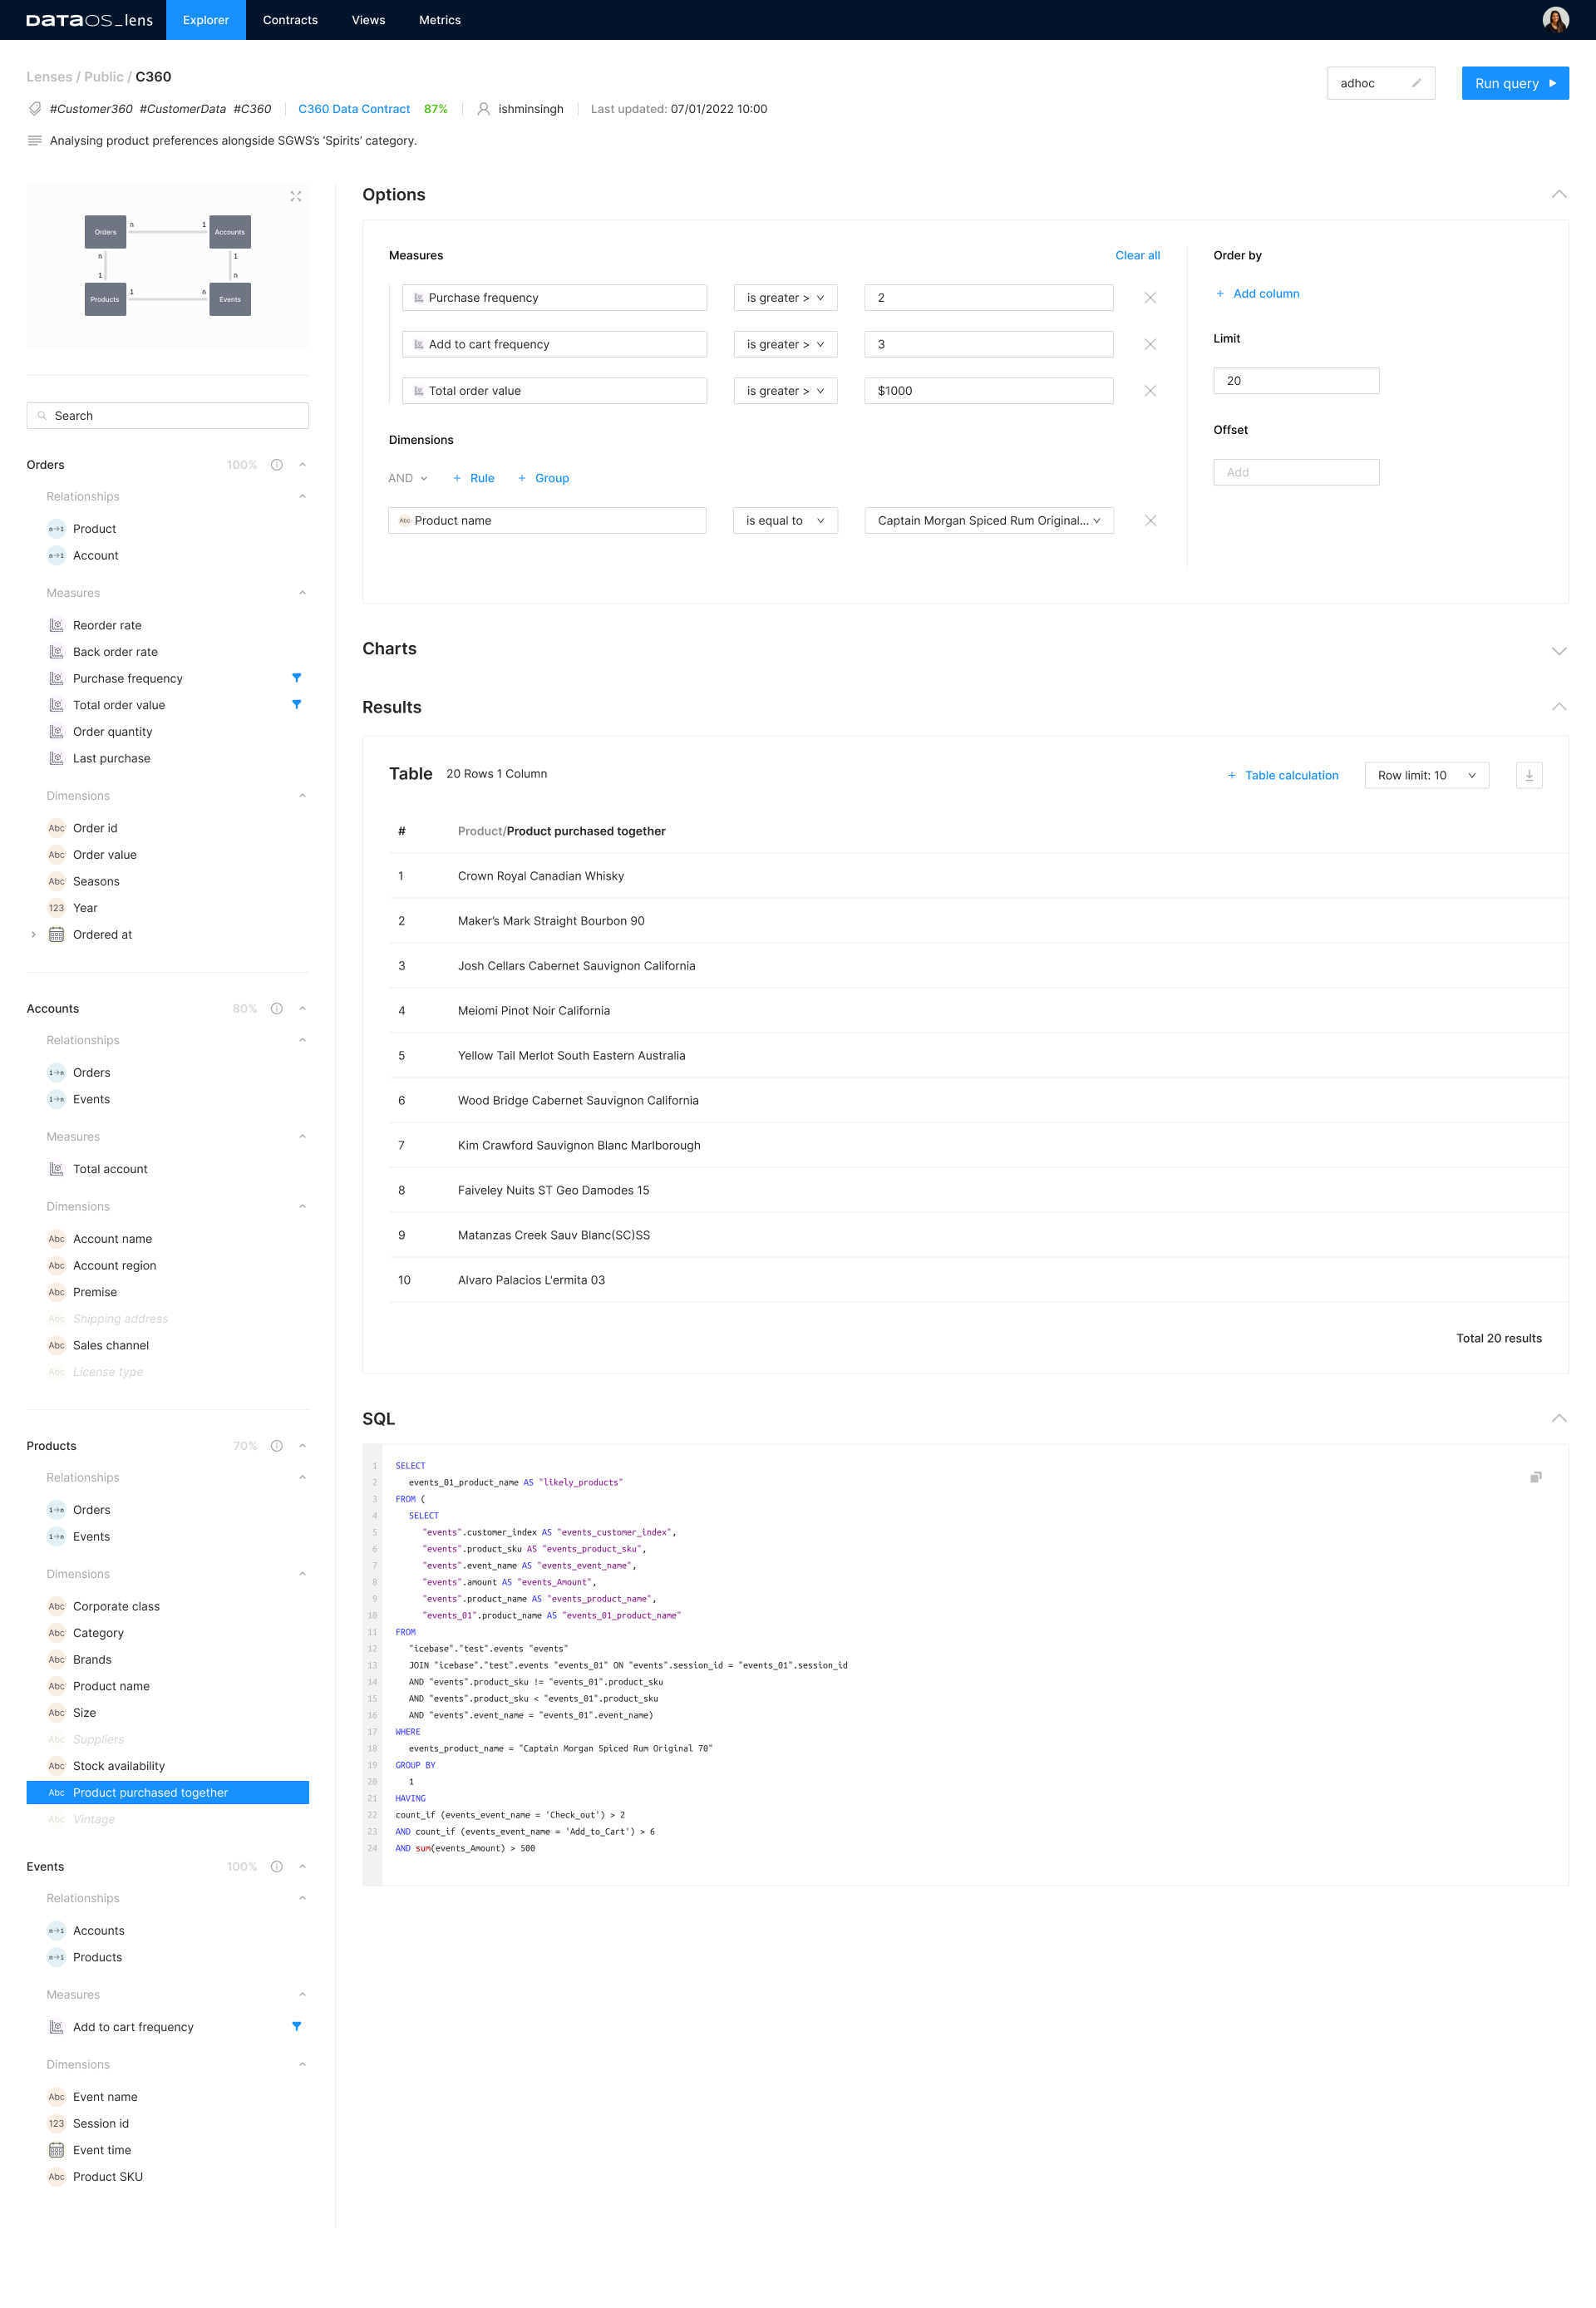
Findings
As a result, 'Crown Royal Canadian Whisky is the most frequently purchased product with 'Captain Morgan's Spiced Rum.’
Now we can run our campaign.
Analysis 4
It’s time to analyze our campaign performance.
After running the campaign, we wish to track Total Revenue metrics that will help us understand if the campaign was a success or a failure. We will observe total revenue for Crown Royal’s corporate class ‘Whisky’ daily for the last seven days.
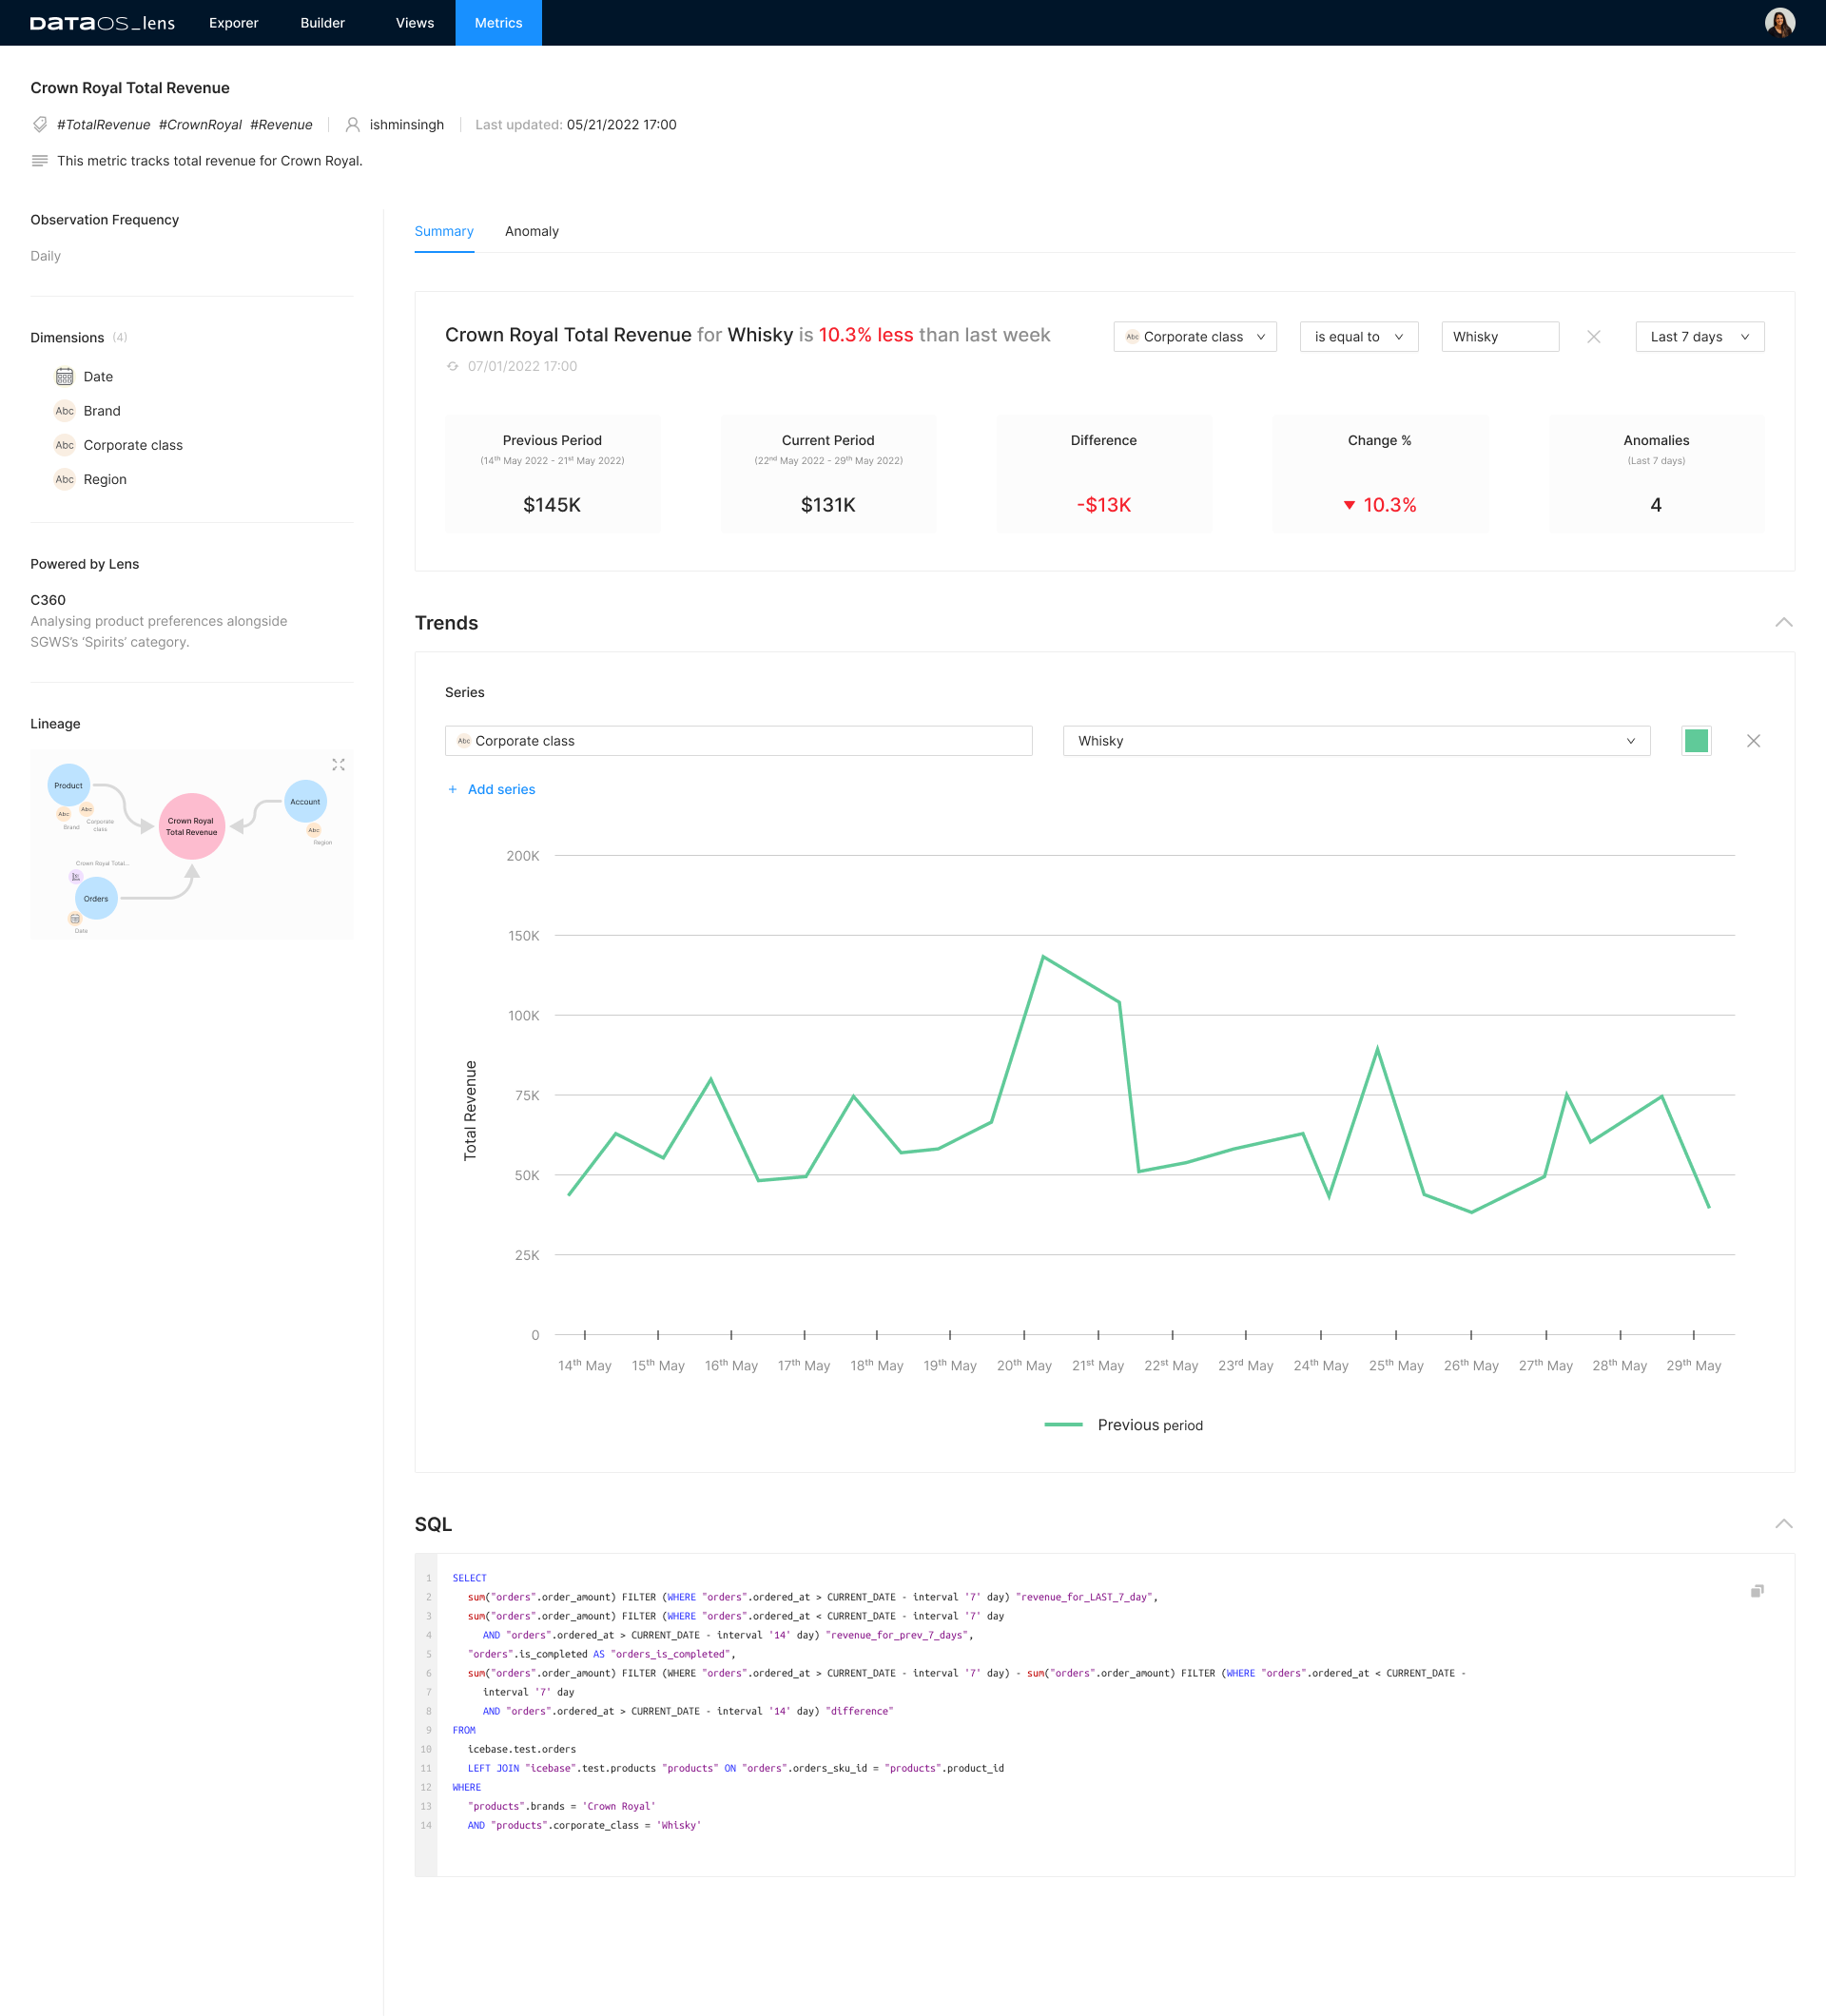
Findings
We observe a dip of 10.3% compared to last week in revenue.
Analysis 5
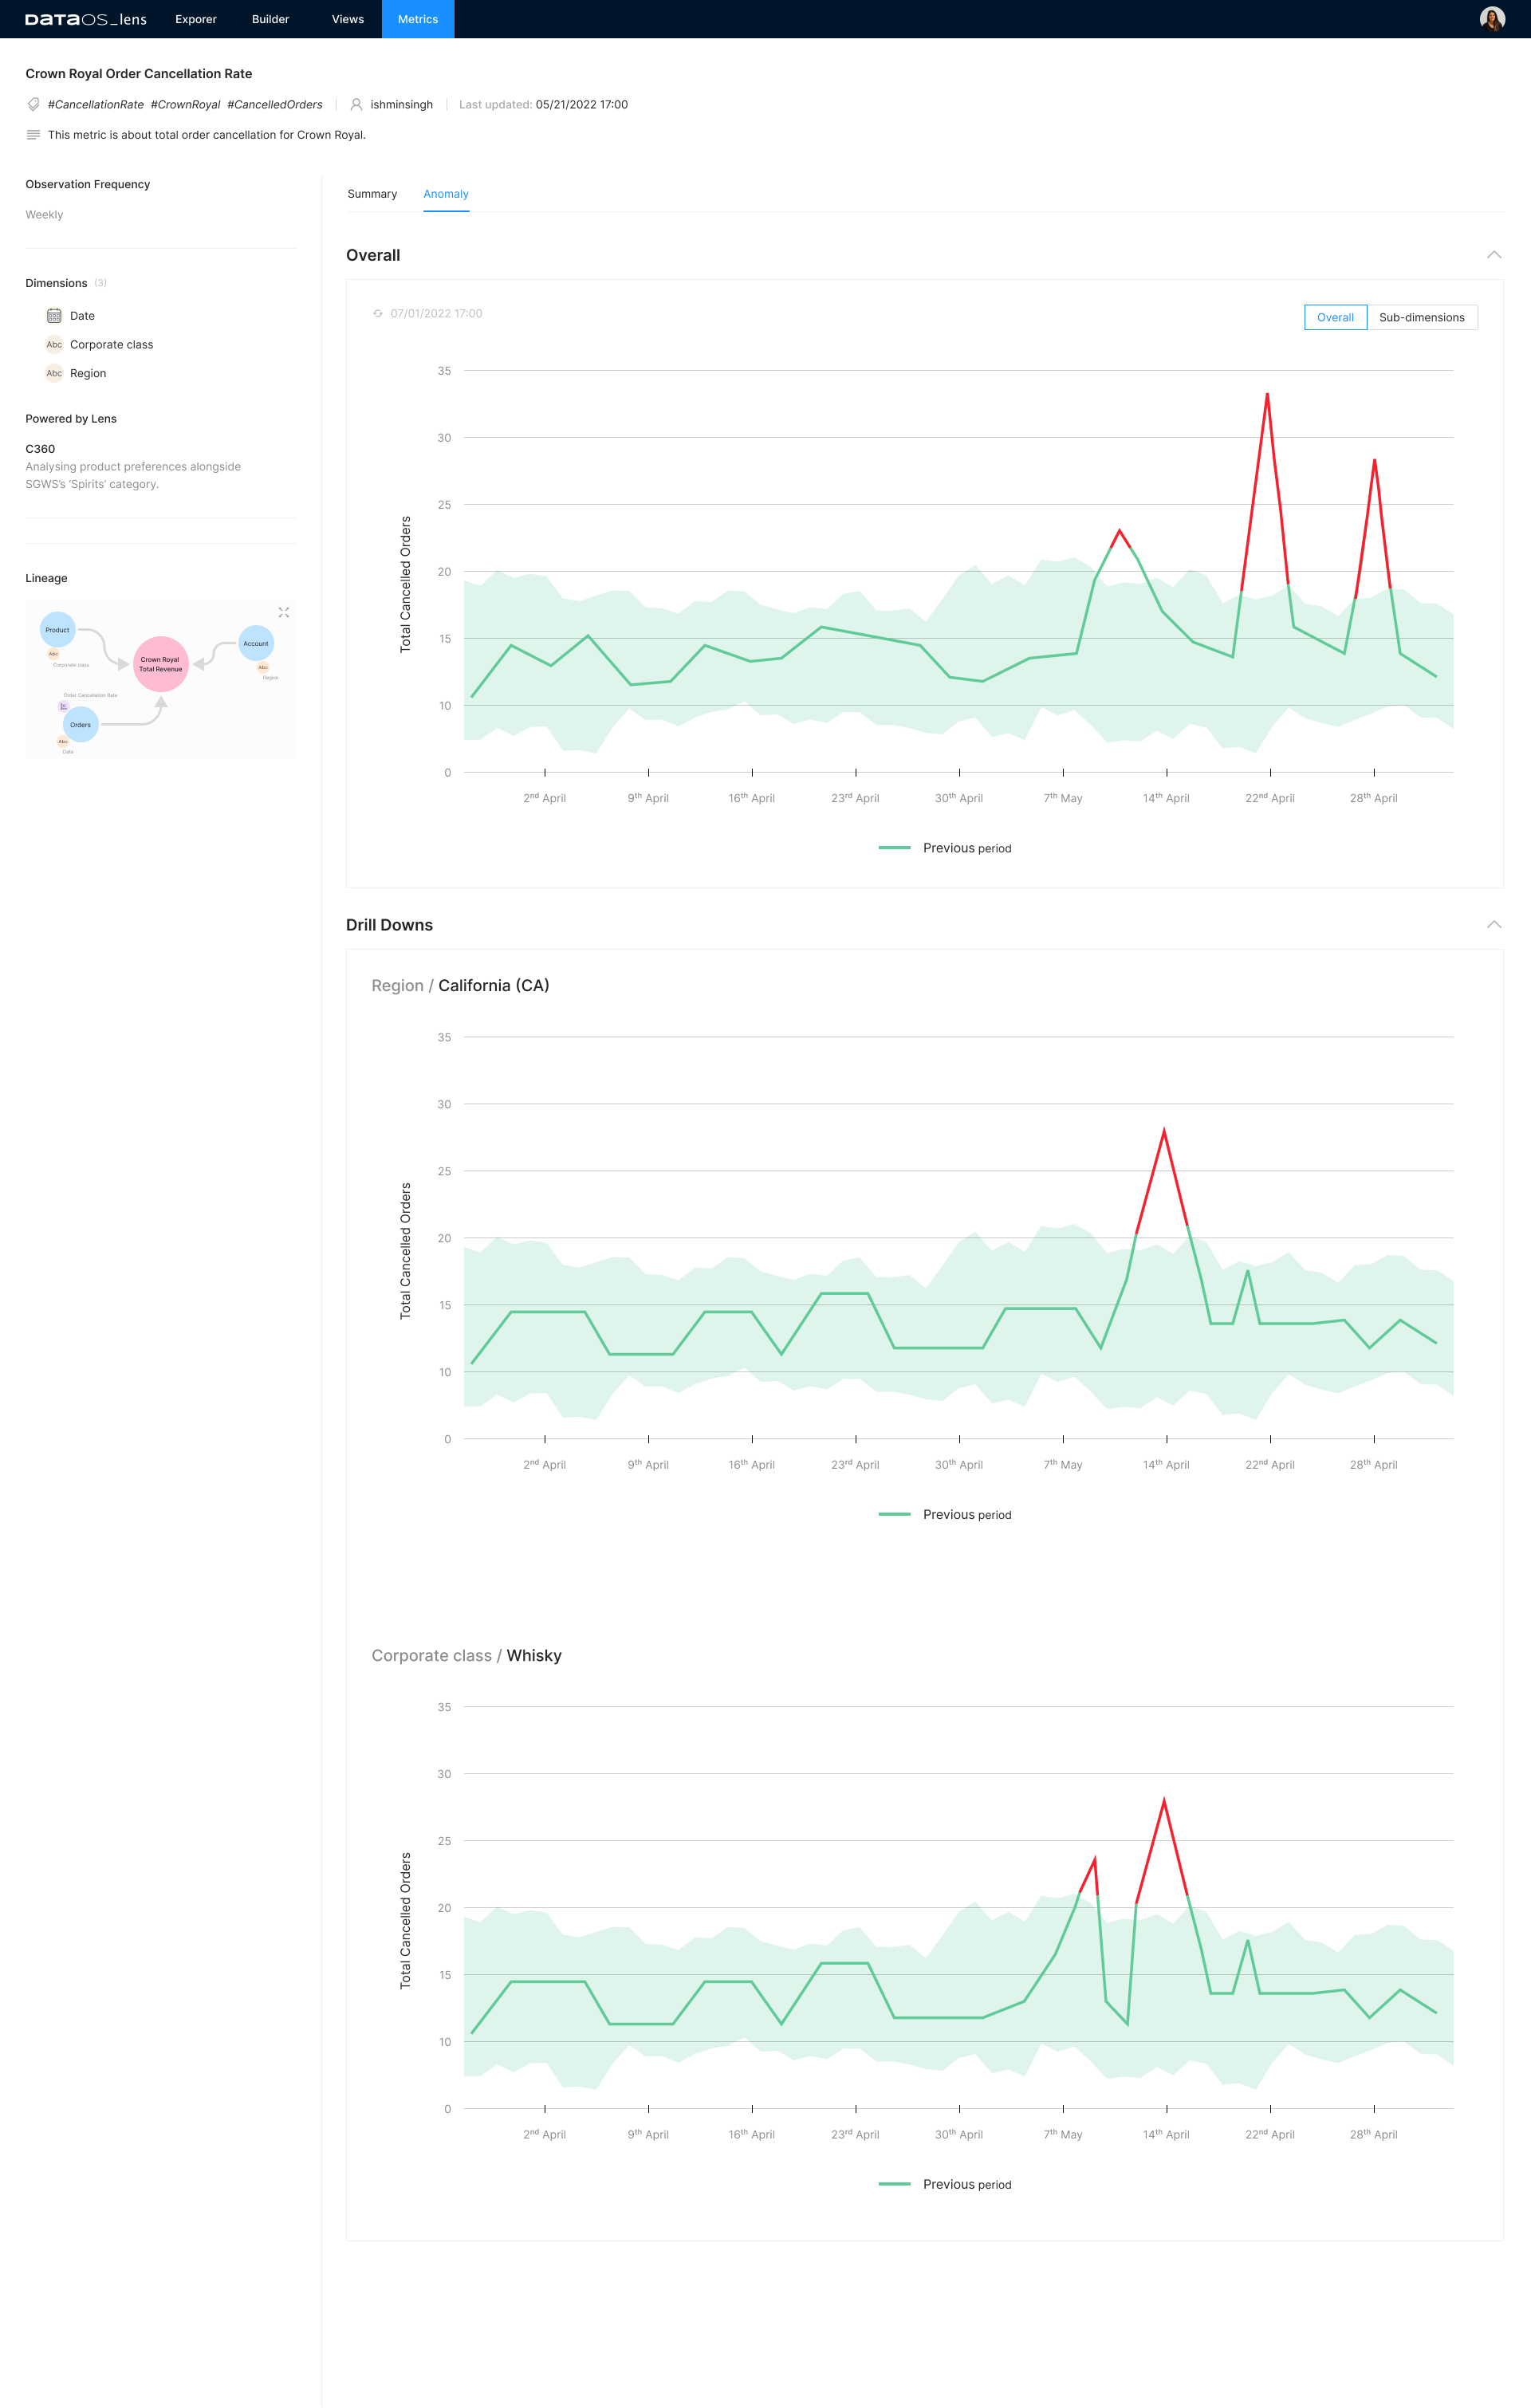
After observing a dip in the revenue despite running the campaign, we would want to track order cancellations to understand the anomalies further.
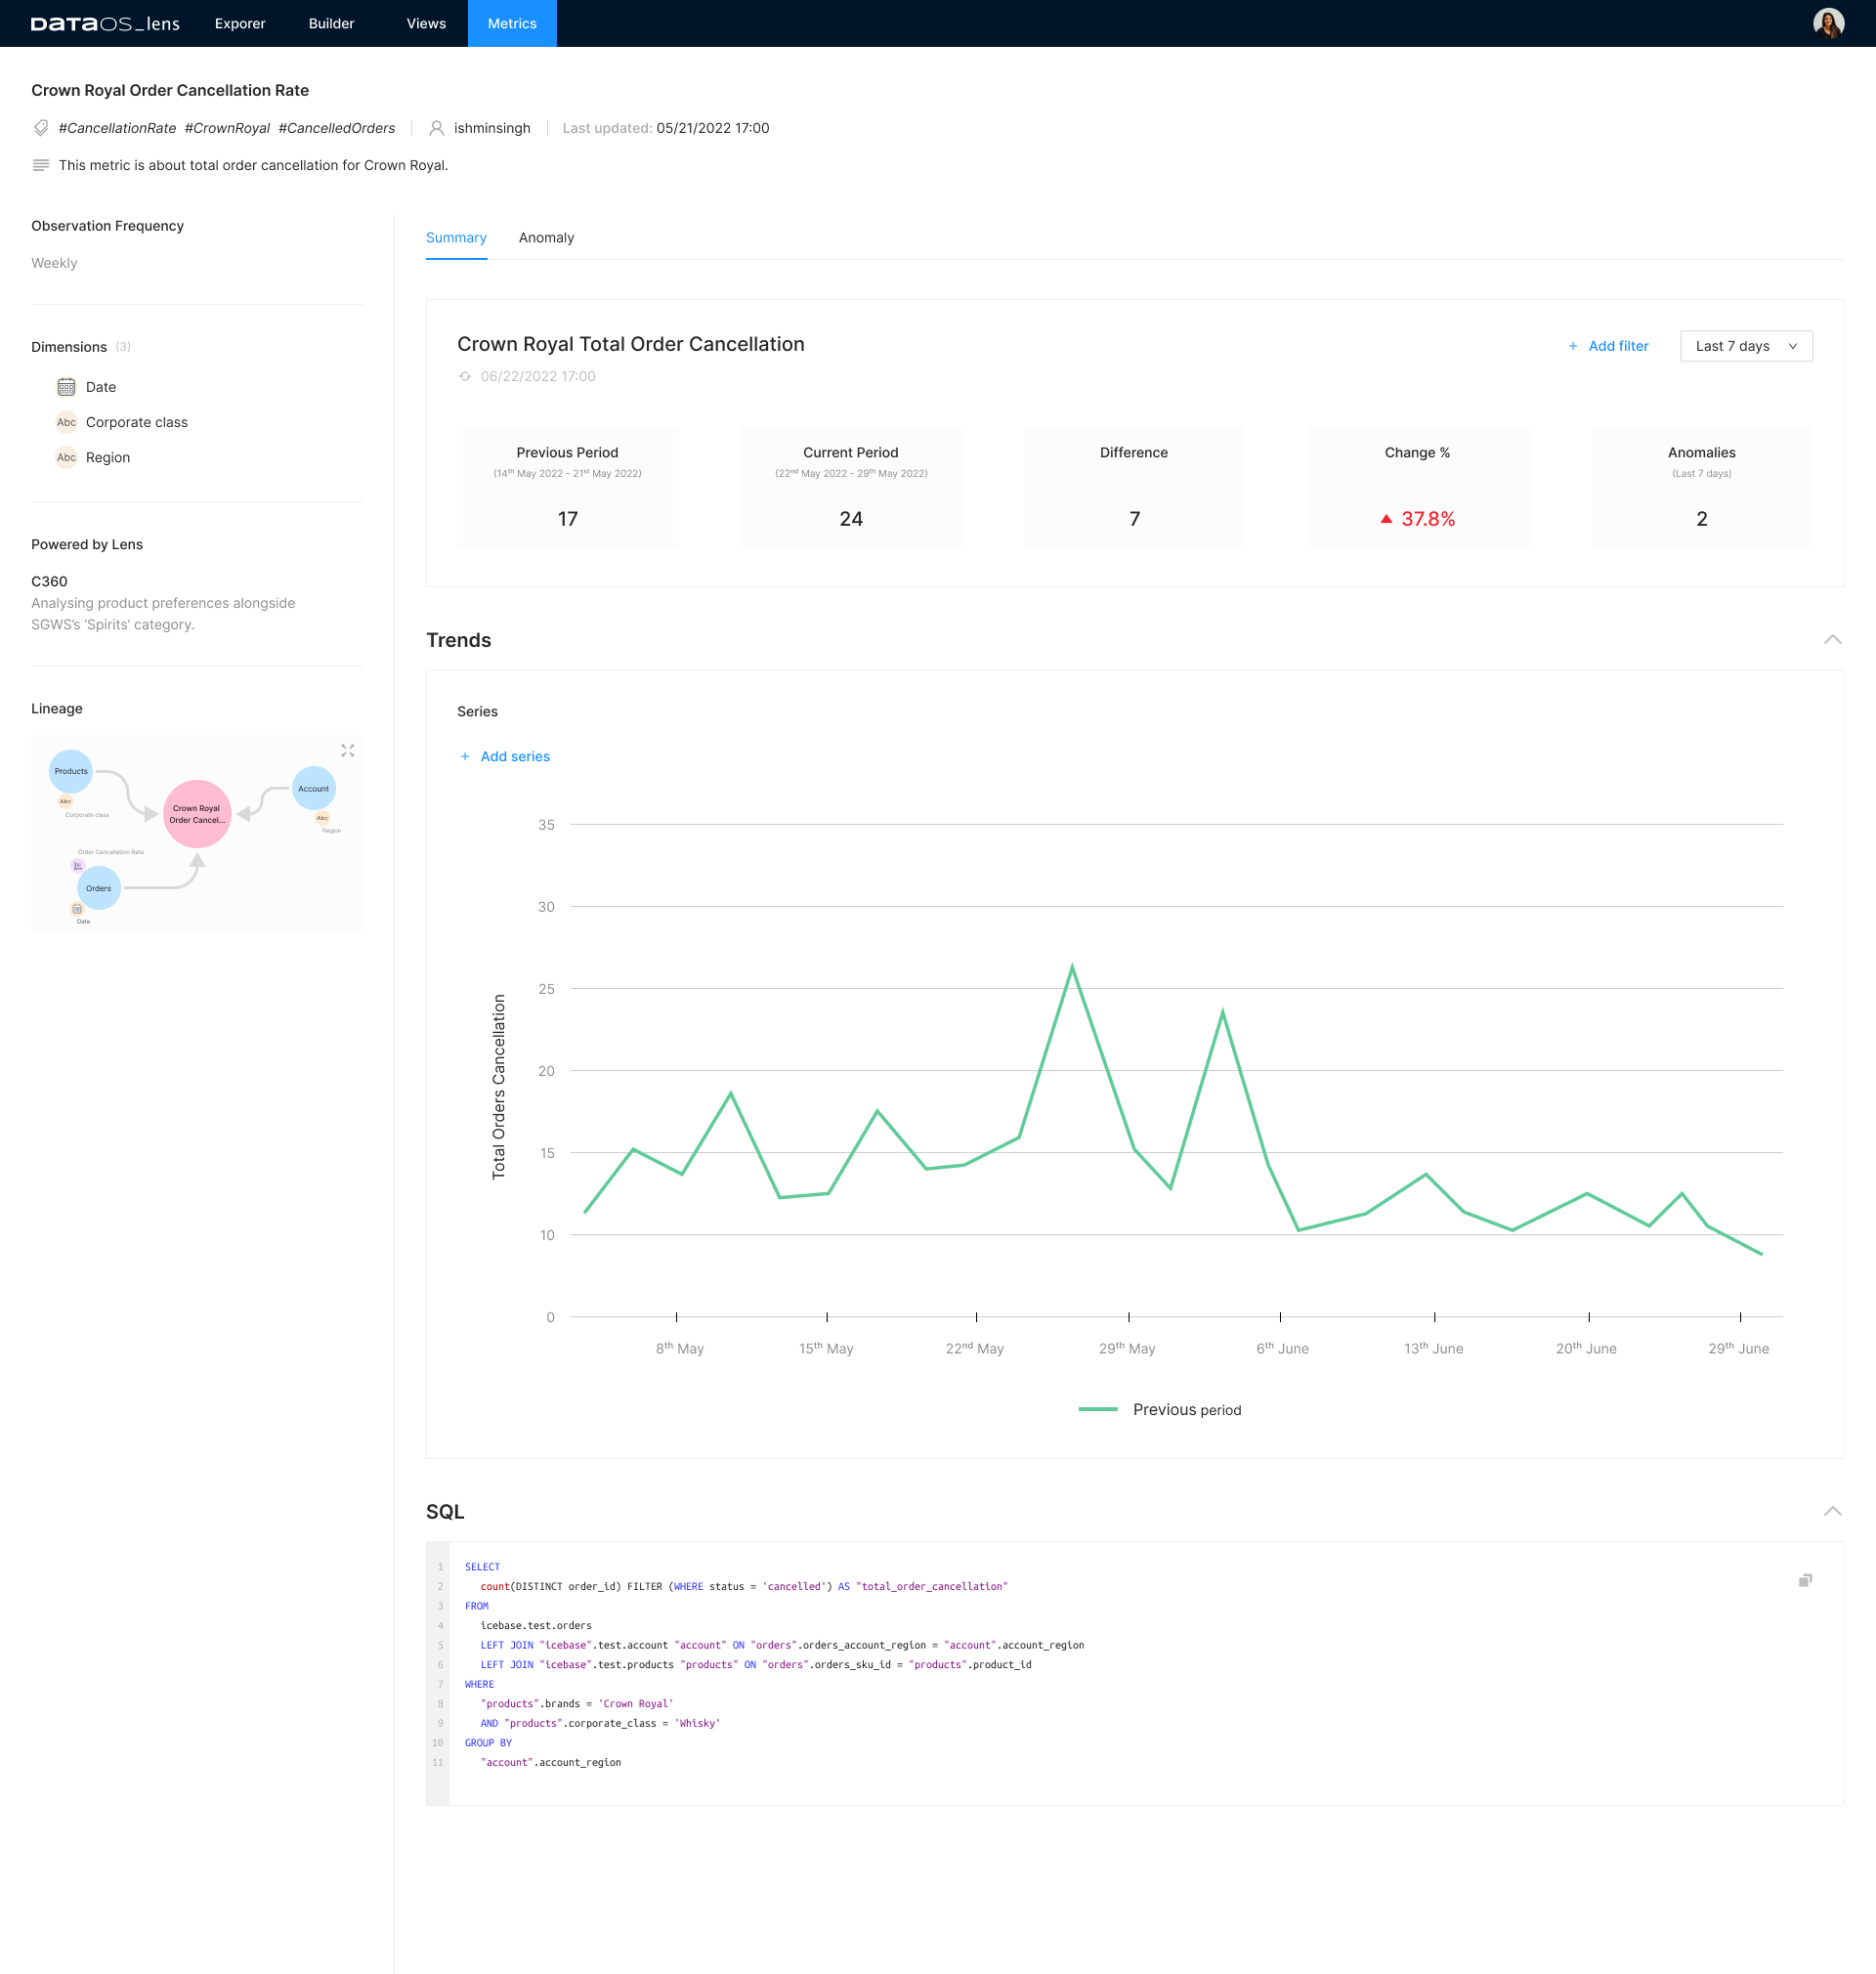
We can further drill down to identify what all dimensions are resulting in these anomalies.
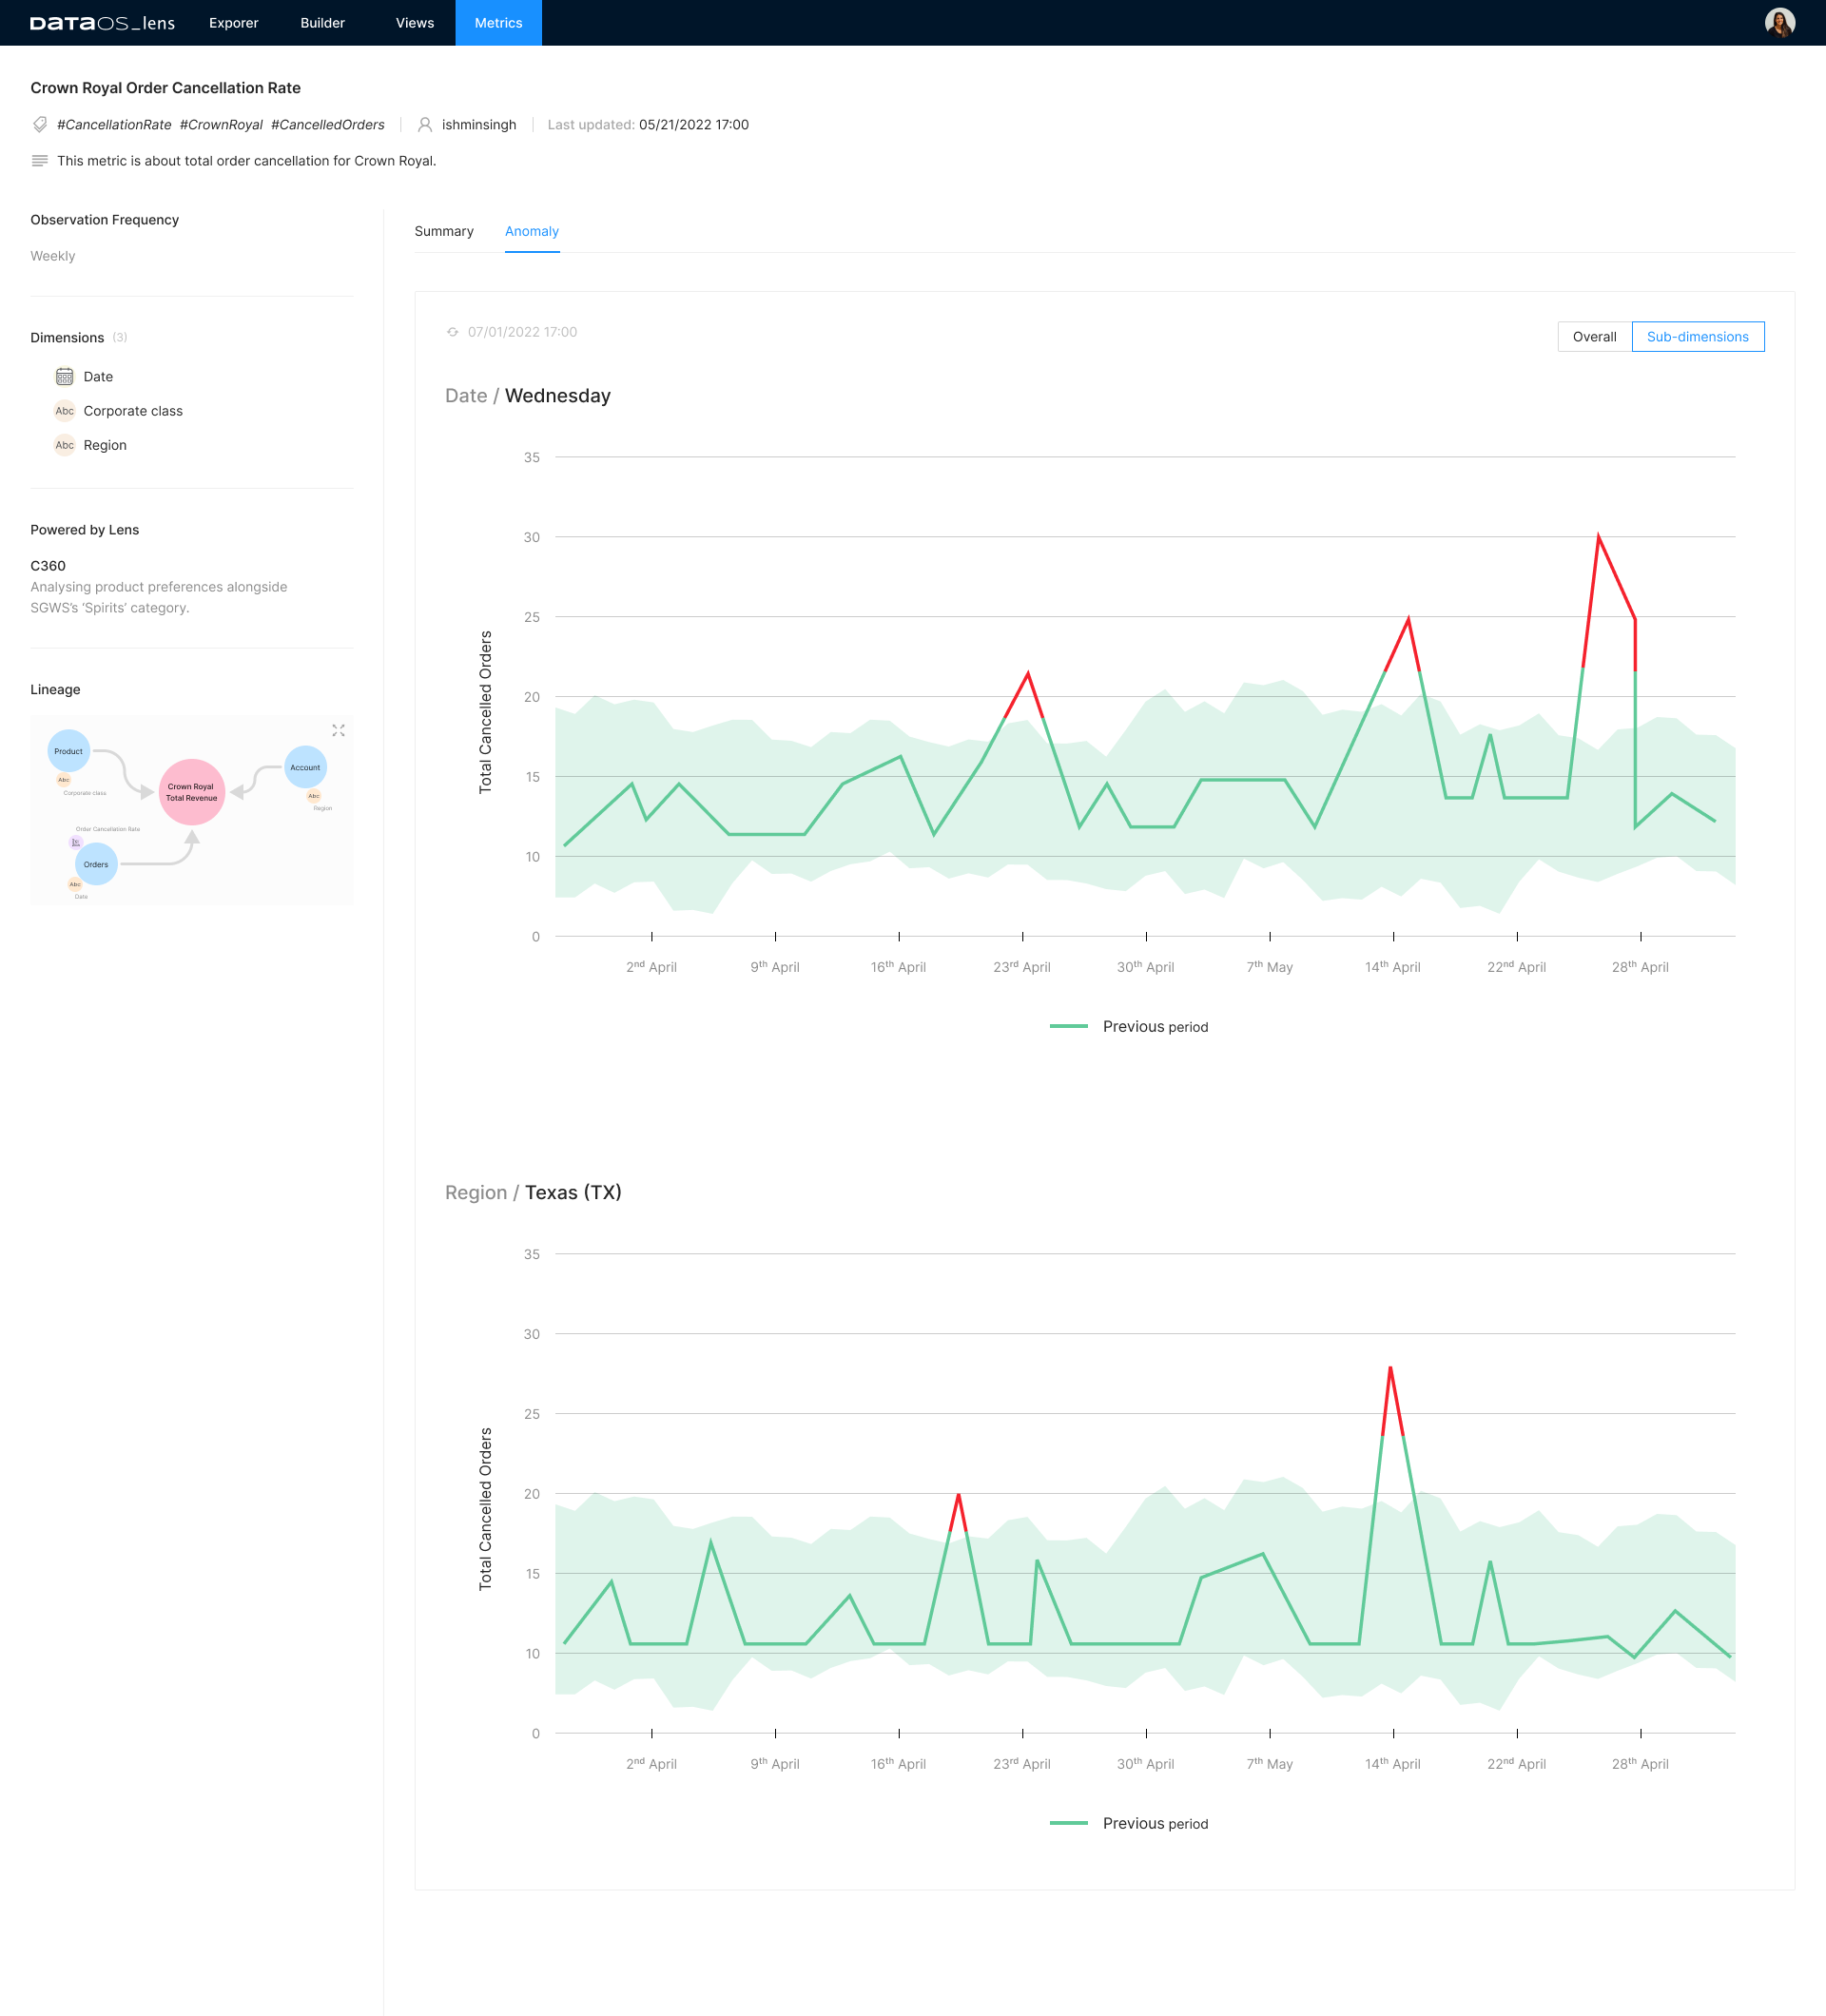
We can also check anomalies for specific dimensions if there are any.
Findings
- There is an increase in order cancellation for the ‘Crown Royal brand.
- The anomalies are detected during the campaign duration and for the corporate class ‘Whisky.’
- For stated sub-dimensions, the order cancellations are not spiked up as for corporate class Whisky.’
Analysis 6
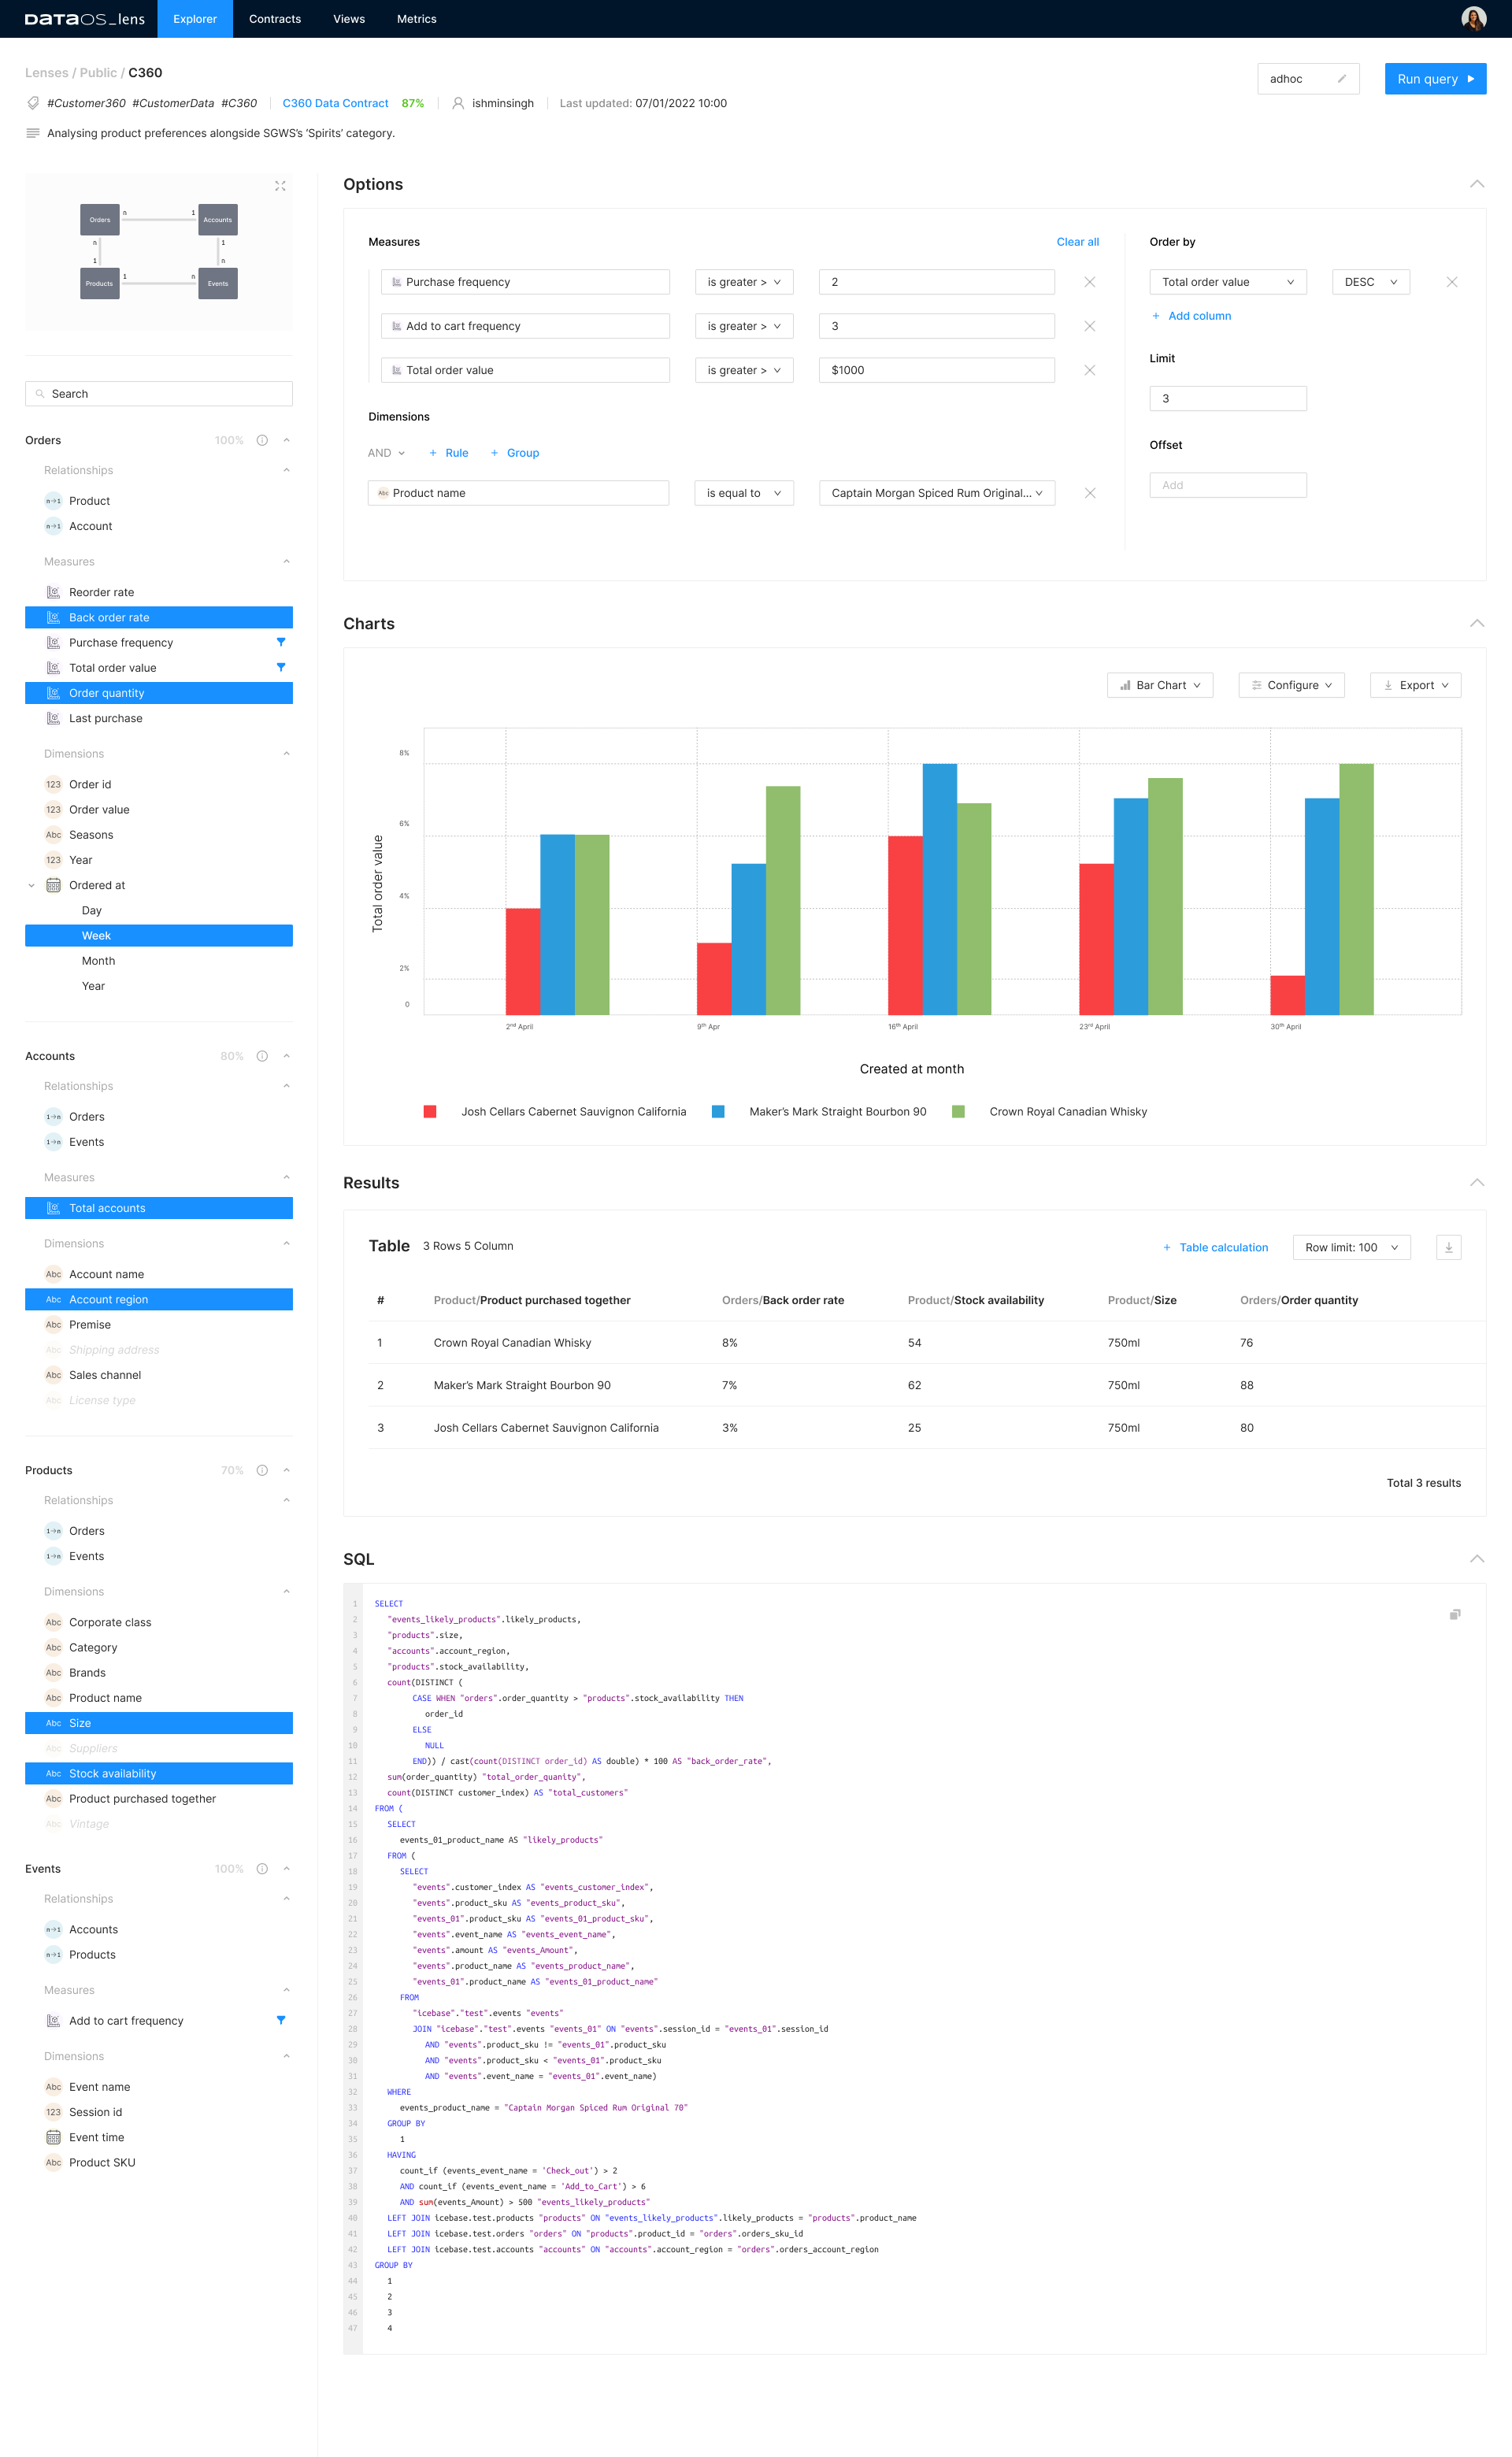
After observing the metrics affecting our campaign, we want to investigate whether increased back order rates are causing order cancellation. If yes, which are the top three brands with high back order rates? Based on the investigation, we will exclude them from our campaign.
Findings
It seems like Crown Royal is badly affected by the high back order rate.
You can power a multitude of use cases through Lens.