How to Monitor Cached Datasets in Flash?
Monitoring cached datasets in Flash is essential for tracking performance and resource usage. To enable monitoring, the ingress attribute must be included in the Flash Service manifest file, as shown below:
service:
  servicePort: ${{8080}}
  servicePorts:
  - name: ${{backup}}
    servicePort: ${{5433}}
  ingress:
    enabled: ${{true}}
    stripPath: ${{false}}
    path: ${{/flash/public:flash-test-6}}
    noAuthentication: ${{true}}
  replicas: ${{1}}
  logLevel: ${{info}}
  compute: ${{runnable-default}}
  envs:
    APP_BASE_PATH: ${{'dataos-basepath'}}
    FLASH_BASE_PATH: ${{/flash/public:flash-test-6}}
  resources:
    requests:
      cpu: ${{500m}}
      memory: ${{512Mi}}
    limits:
      cpu: ${{1000m}}
      memory: ${{1024Mi}}
The ingress attribute allows access to the Flash web app, which enables monitoring of the cached datasets.
Accessing the Flash Service metrics
-
Get the ingress path: Retrieve the ingress path from Metis, as shown below:
.png)
Metis Interface -
Access the metrics: Use the following URL syntax in postman to fetch the metrics endpoint by providing the DataOS API key as the bearer token:
Replace
<DataOS env URL>and the ingress path as needed.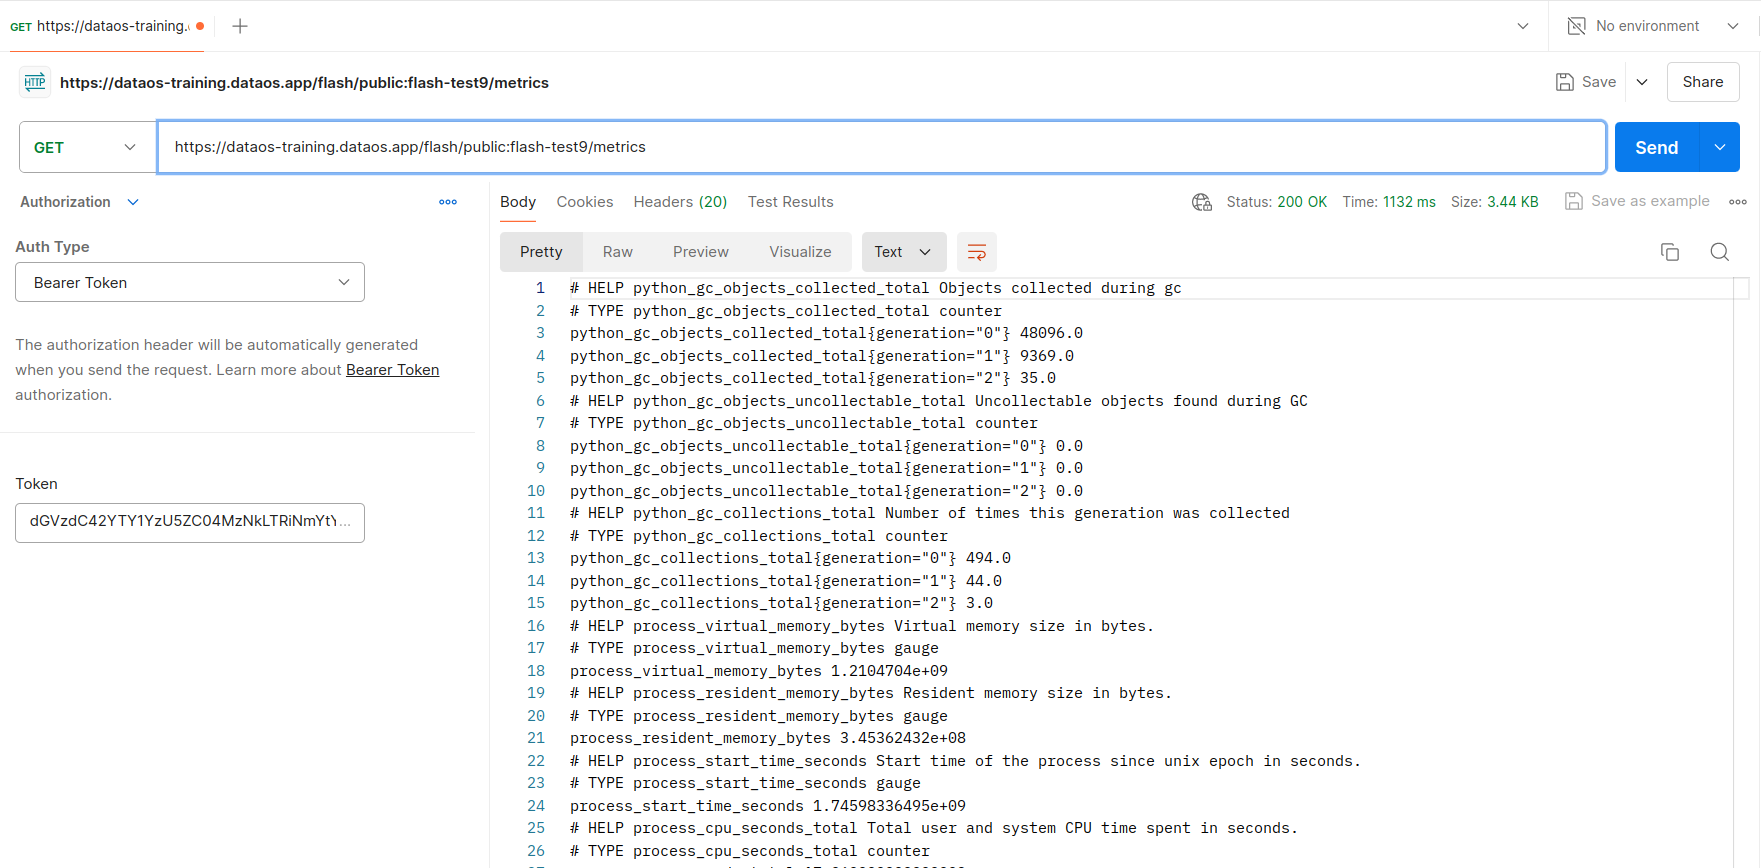
Flash Service endpoint