Core Concepts
Terms
Metric
A quantifiable occurrence used to track and assess the status or performance of specific aspects of a system, process, or business function. These are objective, numerical data points that are collected and analyzed to identify trends, patterns, or deviations from expected norms. For example,
- Average CPU Utilization: Average percentage of CPU usage over a day/month/year.
- Customer Churn Rate: Percentage of customers lost in the past year.
Event
A qualifiable occurrence within a system or process that reflects a specific change, action, anomaly, etc. Unlike metrics, which are quantitative measures, events are discrete and qualitative. They can range from system-generated alerts, such as errors or status changes, to user-initiated actions, like deployments or configuration changes. For example,
- Data Pipeline Failure: A data processing pipeline encounters an error, halting data flow.
- Schema Change in Data Source: A modification is detected in the schema of a source database.
Condition
A user-defined criterion or a set of criteria that must be satisfied by a metric or event for an incident to be generated. For example,
- Average CPU Utilization (metric) exceeds 85% (condition).
- IoT device reports (event) connectivity 'loss' (condition).
Incident
Output generated by the Monitor when a predefined condition, based on metrics or events, is met. For example,
- Output generated when either the Average CPU Utilization (metric) exceeds the predefined condition or an Error 500 occurs (event), indicating a performance issue or critical failure, respectively.
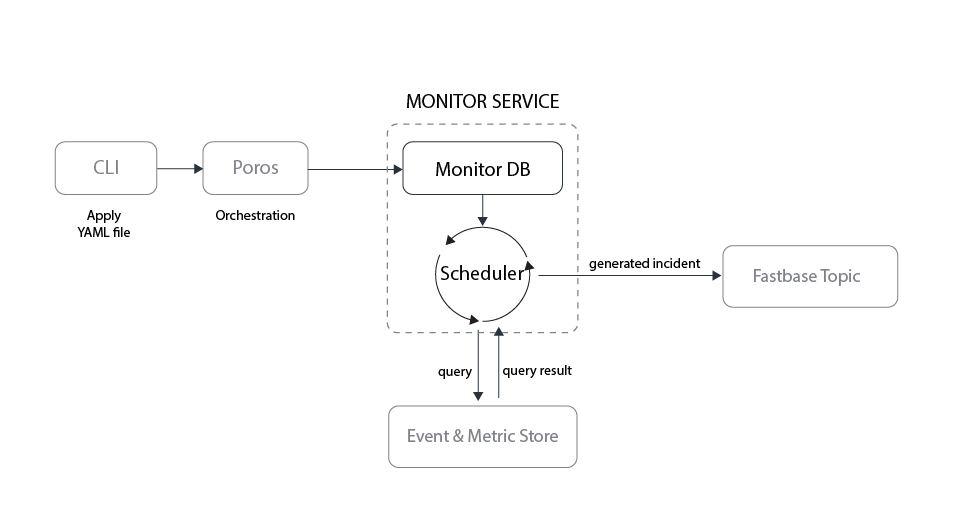
Architecture
The Monitor Service has two major components - Monitor DB and Scheduler. Monitor DB stores the manifest file of each instance of Monitor in its database. The Scheduler reads from this manifest file to query the Metric & Event store. This Metric & Event store is a proxy for any storage system, such as an SQL database, Prometheus DB, a streaming DB or a queryable source of choice.
Monitor Service is responsible for cross-checking the condition declared by the user with an Event/Metric generated in the system. If the condition is fulfilled, it publishes the information mentioned in the manifest file as an incident to a Fastbase topic. This Fastbase topic is a store based on the Pulsar DB system.