Elements of Lens
The data model in Lens transforms raw data into meaningful business definitions, optimizing it for analytical purposes. This model is exposed through a robust set of APIs, enabling end-users to run diverse analytical queries without modifying the underlying data model. Let’s take a sales table as an example, containing the following columns:
sales Table
| order_id | product | amount | city | customer_name |
|---|---|---|---|---|
| 1 | Shoes | 150 | New York | John Doe |
| 2 | Jacket | 200 | San Francisco | Jane Smith |
| 3 | Hat | 50 | Los Angeles | Michael Brown |
| 4 | Shoes | 120 | New York | Emily Davis |
| 5 | Jacket | 220 | Chicago | Sarah Wilson |
To analyze sales data effectively, it is essential to address key business questions, such as:
-
What is the total sales amount?
-
How many orders were placed?
-
What is the average sales amount?
-
How do sales vary across different cities and customers?
Rather than crafting individual SQL queries for each question, the Lens data model provides a robust framework for efficiently organizing and analyzing data to answer business questions. By modeling entities and their relationships, it allows for a structured approach to data analysis. For instance, Lens enables the modeling of entities like sales, orders, and products, ensuring their interactions are clearly defined.
To effectively leverage Lens for data modeling, several core concepts are crucial. These concepts help convert raw data into actionable business insights, facilitating the extraction of meaningful results. The following sections outline the foundational components of the Lens data modeling approach, designed to optimize your analytical workflows.
Table
A table is a logical construct used to define a real-world entity such as customer, product. It contains information about joins (relationships), dimensions, measures, and segments. Each table is defined in a separate YAML file.
We'll use a sample database with two tables, owner and contacts to illustrate the concepts.
owner Table
| id | owner_name | owner_email | city |
|---|---|---|---|
| 1 | Alice Johnson | alice@example.com | New York |
| 2 | Bob Smith | bob@example.com | San Francisco |
| 3 | Charlie Brown | charlie@example.com | Los Angeles |
| 4 | David Williams | david@example.com | Chicago |
| 5 | Emma Davis | emma@example.com | Miami |
contacts Table
| contact_id | owner_id | contact_name | contact_email | phone_number |
|---|---|---|---|---|
| 1 | 1 | John Doe | john.doe@example.com | 123-456-7890 |
| 2 | 2 | Jane Smith | jane.smith@example.com | 987-654-3210 |
| 3 | 3 | Michael Brown | michael.b@example.com | 555-123-4567 |
| 4 | 4 | Sarah Johnson | sarah.j@example.com | 444-222-3333 |
| 5 | 5 | Robert Wilson | robert.w@example.com | 777-888-9999 |
Example
In the example below the owner the table is defined for a sales analytics Lens:
tables:
  - name: owner
    sql: {{ load_sql('owner') }}
    description: Table containing information about the owners.
    public: true
You can also use the tables attribute to accommodate more complex SQL queries:
Within each table, dimensions, measures, and segments are defined. Joins are used to define relations between tables.
Attribute
The table declaration involves the following attributes:
| Property | Description | Possible Value | Best Practice |
|---|---|---|---|
name |
Specify the name of the table: - Should start with a letter only - Can only contain letters, numbers, and underscores |
^[a-zA-Z][a-zA-Z0-9_]*$ |
Use snake_case. For example: sales_insight |
sql |
Add a reference to the SQL file to map data to the table. SQL mapping is maintained in a separate file | NA | Keep SQL clearly named for easy maintenance. |
description |
Description of the table's purpose | NA | Provide a concise yet informative description to aid understanding |
public |
Controls visibility of the table, i.e., whether the table is visible to all users or hidden | True, False | Use True for tables that should be widely accessible and False for those that are sensitive or irrelevant to most users |
joins |
Define the relationship with other tables. Left joins are created. The table within which the join is defined is on the left. | NA | Use joins judiciously to avoid transitive join issues |
dimensions |
Dimensions associated with the table for slicing and dicing data | NA | Define dimensions that are frequently used in filtering and grouping data |
measures |
Aggregation over a dimension | NA | Focus on measures that provide key business insights. |
segments |
An array of segments can be defined. Segments are to filter data based on specific criteria | NA | Create segments that represent filter groups used in common business queries to enhance usability |
Joins
The joins attribute is used to define relationships between multiple tables(entities), enabling users to access and compare fields from two or more entity tables at the same time.
Key characteristics of Joins:
-
Join Type: All joins are generated as
LEFT JOIN. The entity that defines the join serves as the main table, while any entity referenced within thejoinsproperty is incorporated in theLEFT JOINclause. -
INNER JOIN Semantics: INNER JOIN behavior can be achieved by applying additional filters, such as checking if a column value is NOT NULL. For instance, using a filter not null ensures this requirement is met.
-
Unsupported Join Types:
-
RIGHT OUTER JOIN: To achieve RIGHT OUTER JOIN semantics, define the join from the other side of the relationship.
-
FULL OUTER JOIN: For simplicity in join modeling, full outer joins cannot be directly declared. However, they can be constructed using the SQL parameter within a Lens. These are often used for data blending or similar use cases. In such scenarios, creating a dedicated Lens specifically for the operation is recommended.
There are three types of join relationships (one_to_one, one_to_many, and many_to_one) and a few other concepts.
-
one_to_one: -
This relationship means that each row in the declaring table corresponds to exactly one row in the joined table.
-
one_to_many: -
This indicates that one row in the declaring table can be linked to multiple rows in the joined table.
-
many_to_one: -
This is the reverse of a
one_to_manyrelationship. In this case, multiple rows in the declaring table can match a single row in the joined table.
Attributes
| Property | Description |
|---|---|
name |
Candidate target table for joining with the base table |
relationship |
Type of join relationship with other tables - one-to-one, one-to-many,many-to-one |
sql |
Join clause Syntax: base_table.key = target_table.key |
Example:
In this example, we define the base table and outline its relationship with another table. Specifically, multiple transactions can reference the same product, establishing a many-to-one relationship between the transactions table and the products table. In this context, the placeholder {TABLE} refers to the base table, which is the transactions table.
tables:
  - name: owner
    sql: {{ load_sql('owner') }}
    description: Table containing information about owner records.
    joins:
      - name: contacts
        relationship: one_to_many
        sql: "{TABLE.owner_id} = {contacts.owner_id}"
Dimensions
Dimensions represent the properties of a single data point in the table. They are descriptive attributes, often text values, that provide context to the data in a fact table. For example, in a sales database, attributes like product_name, category, and region, are called dimensions of that table which help to categorize and provide context for the sales table. The dimensions serve as the guidelines for data analysts to view the information from different angles and apply different filtering criteria.
For example, in the following YAML code snippet, the owner table is defined, with unique attributes such as id and email categorized as dimensions.
tables:

  - name: owner
    sql: {{ load_sql('owner') }}
    description: Table containing information about owner records.

    dimensions:
      - name: owner_id
        type: string
        description: Unique identifier for each owner.
        sql: owner_id
        primary_key: true
        public: true

      - name: email
        type: string
        description: Email address of the owner.
        sql: email
The dimension declaration involves the following properties:
| Property | Description | Possible Value | Best Practice |
|---|---|---|---|
name |
Unique identifier of the dimension | ^[a-zA-Z][a-zA-Z0-9_]*$ | Use snake_case. For example: order_date |
title |
Human-readable title of the dimension. Use ‘title’ to change the display name | String | Provide a clear and concise title for better readability and user understanding |
description |
Description of the dimension's purpose | String | Provide a detailed description to explain the dimension's business value |
column |
References the column defined in the table’s SQL. While custom SQL can be defined in a table’s dimension, best practice suggests that it should be defined in the table’s SQL. | ||
public |
Controls visibility of dimension, i.e. whether the dimension is visible to all users or hidden. If not mentioned explicitly, by default this property is true | True, False | Set to True for key dimensions that should be visible by default |
primary_key |
The key on which the join relationship will be defined | Column name | Ensure each dimension has a unique primary key to maintain data integrity |
type |
The data type of the dimension | string, number, time, boolean |
Choose the appropriate data type to ensure proper sorting and filtering |
meta |
Ensures sensitive data is masked for specified user groups. | Key-value pairs | Use metadata to provide additional context about the dimension, such as tags, or custom attributes |
sub_query |
Sub-query for the dimension. Set the flag to reference a measure of one table in dimension of another | Use to define complex dimensions using sub-queries |
Measures
Measures are quantification, representing fields such as order subtotal, quantity of items purchased, or duration spent on a specific page. They encompass any measurable numerical value on which statistical calculations can be applied, including sum, average, and variance. For instance, with a measure such as the quantity of items purchased, operations can include calculating the average quantity ordered, sorting by descending quantities, summing all quantities, and performing various statistical analyses. For instance, consider the following YAML definition:
tables:
  - name: sales
    sql: {{ load_sql('sales') }}
    description: Table containing sales records with order details.

    measures:
      - name: total_orders_count
        type: count
        sql: id
        description: Total amount of orders.
    #....
This snippet defines a table named sales, representing sales records with order details. Within the measures block, a measure called total_orders_count is created. This measure, of type count, uses the id column to calculate the total number of orders.
When this measure is requested via an API, Lens will generate and execute SQL similar to the following:
When a city dimension is applied to the measure to answer the question "Where are customers based?", Lens generates SQL with a GROUP BY clause, such as:
You can include multiple dimensions in your query to perform grouping as needed.
The measure declaration involves the following properties:
| Property | Description | Possible Value | Best Practice | Usage |
|---|---|---|---|---|
name |
Unique identifier of the measure | ^[a-zA-Z][a-zA-Z0-9_]*$ | Use snake_case. For example: total_revenue |
|
sql |
SQL expression to define the measure | In SQL, custom SQL expressions can be defined. - Useful for specifying formulas. - Helps calculate other measures in SQL. |
||
title |
Human-readable title of the measure | String | Provide a clear and concise title for better readability and user understanding | |
type |
The data type of the measure | time, string, number, boolean, count, sum, count_distinct, count_distinct_approx, avg, min, max |
Choose the appropriate type to match the measure's calculation method | |
description |
Description of the measure's purpose | String | Highlight Purpose and Usage | |
public |
Controls visibility of the measure | True, False | Set to True for key measures that should be visible by default |
|
filters |
Filters applied to the measure | SQL conditions | To aggregate a measure for a specific category, apply a filter. For example, apply a filter for product category. |
Syntax: {table.dimension_name} = 'dimension_value'e.g. sales.product_category = 'Electronics' |
meta |
Custom metadata |
tables:
  - name: owner
    sql: {{ load_sql('owner') }}
    description: Table containing information about owners.

    measures:
      - name: count
        sql: customer_id
        type: count_distinct
        description: Total number of owners.
Calculated Measures
To answer the question 'What is the average sales amount per order?', you’ll need to calculate the average amount for all orders. This can be done by defining a measure that calculates the average of the amount field. Here’s how you can define this in YAML for your sales table:
measures:
 - name: total_sales_amount
   sql: SUM(amount)
   type: number
   description: Total sales amount across all orders.

 - name: total_order_count
   sql: order_id
   type: count
   description: Total number of orders.

 - name: average_sales_amount_per_order
   sql: "{total_sales_amount} / NULLIF({total_order_count}, 0)"
   type: number
   description: The average sales amount per order.

# .....
Here we defined a calculated measure average_sales_amount_per_order, which divides the total sales amount by the total number of orders. The NULLIF function prevents division by zero in case there are no orders.
This example shows how you can reference measures inside other measure definitions. When you request the average_sales_amount_per_order measure via an API, the following SQL will be generated:
As with other measures, average_sales_amount_per_order can be used with dimensions.
Measure Additivity
Additivity is a property of measures that tells us if we can break down or combine measure values across different categories. In simpler terms, it means that if we have a measure for a group of dimensions (like sales for different regions), we can add or combine these values to get a measure for a smaller subset of those dimensions (like sales for a specific region).
The additivity of a measure depends on its type. Only measures with the following types are considered additive: count, count_distinct_approx, min, max, and sum. Measures with all other types are considered non-additive.
Segments
Segments are pre-defined groups of filters.
The segment declaration involves the following properties:
| Property | Description | Possible Value |
|---|---|---|
name |
Specify the name of the dimension. | NA |
public |
Controls visibility of dimension, i.e. whether the dimension is visible to all users or hidden | True, False |
sql |
Add filter criteria: table.= “dimension_values” |
NA |
meta |
Custom metadata. This is also used to define secure sub property |
NA |
In the below example, we define a filter for active owners. Similarly, we can create a filter for non-active owners to differentiate.
Since the segments attribute type is an array, you can apply as many segments as required.
segments:
  - name: sanfrancisco_sales
    sql: "{TABLE} = 'San Francisco'"

  - name: losangeles_sales
    sql: "{TABLE.city} = 'Los Angeles'"

  - name: chicago_sales
    sql: "{TABLE.city} = 'Chicago'"

 #....
A more thorough introduction can be found in Working with Segments.
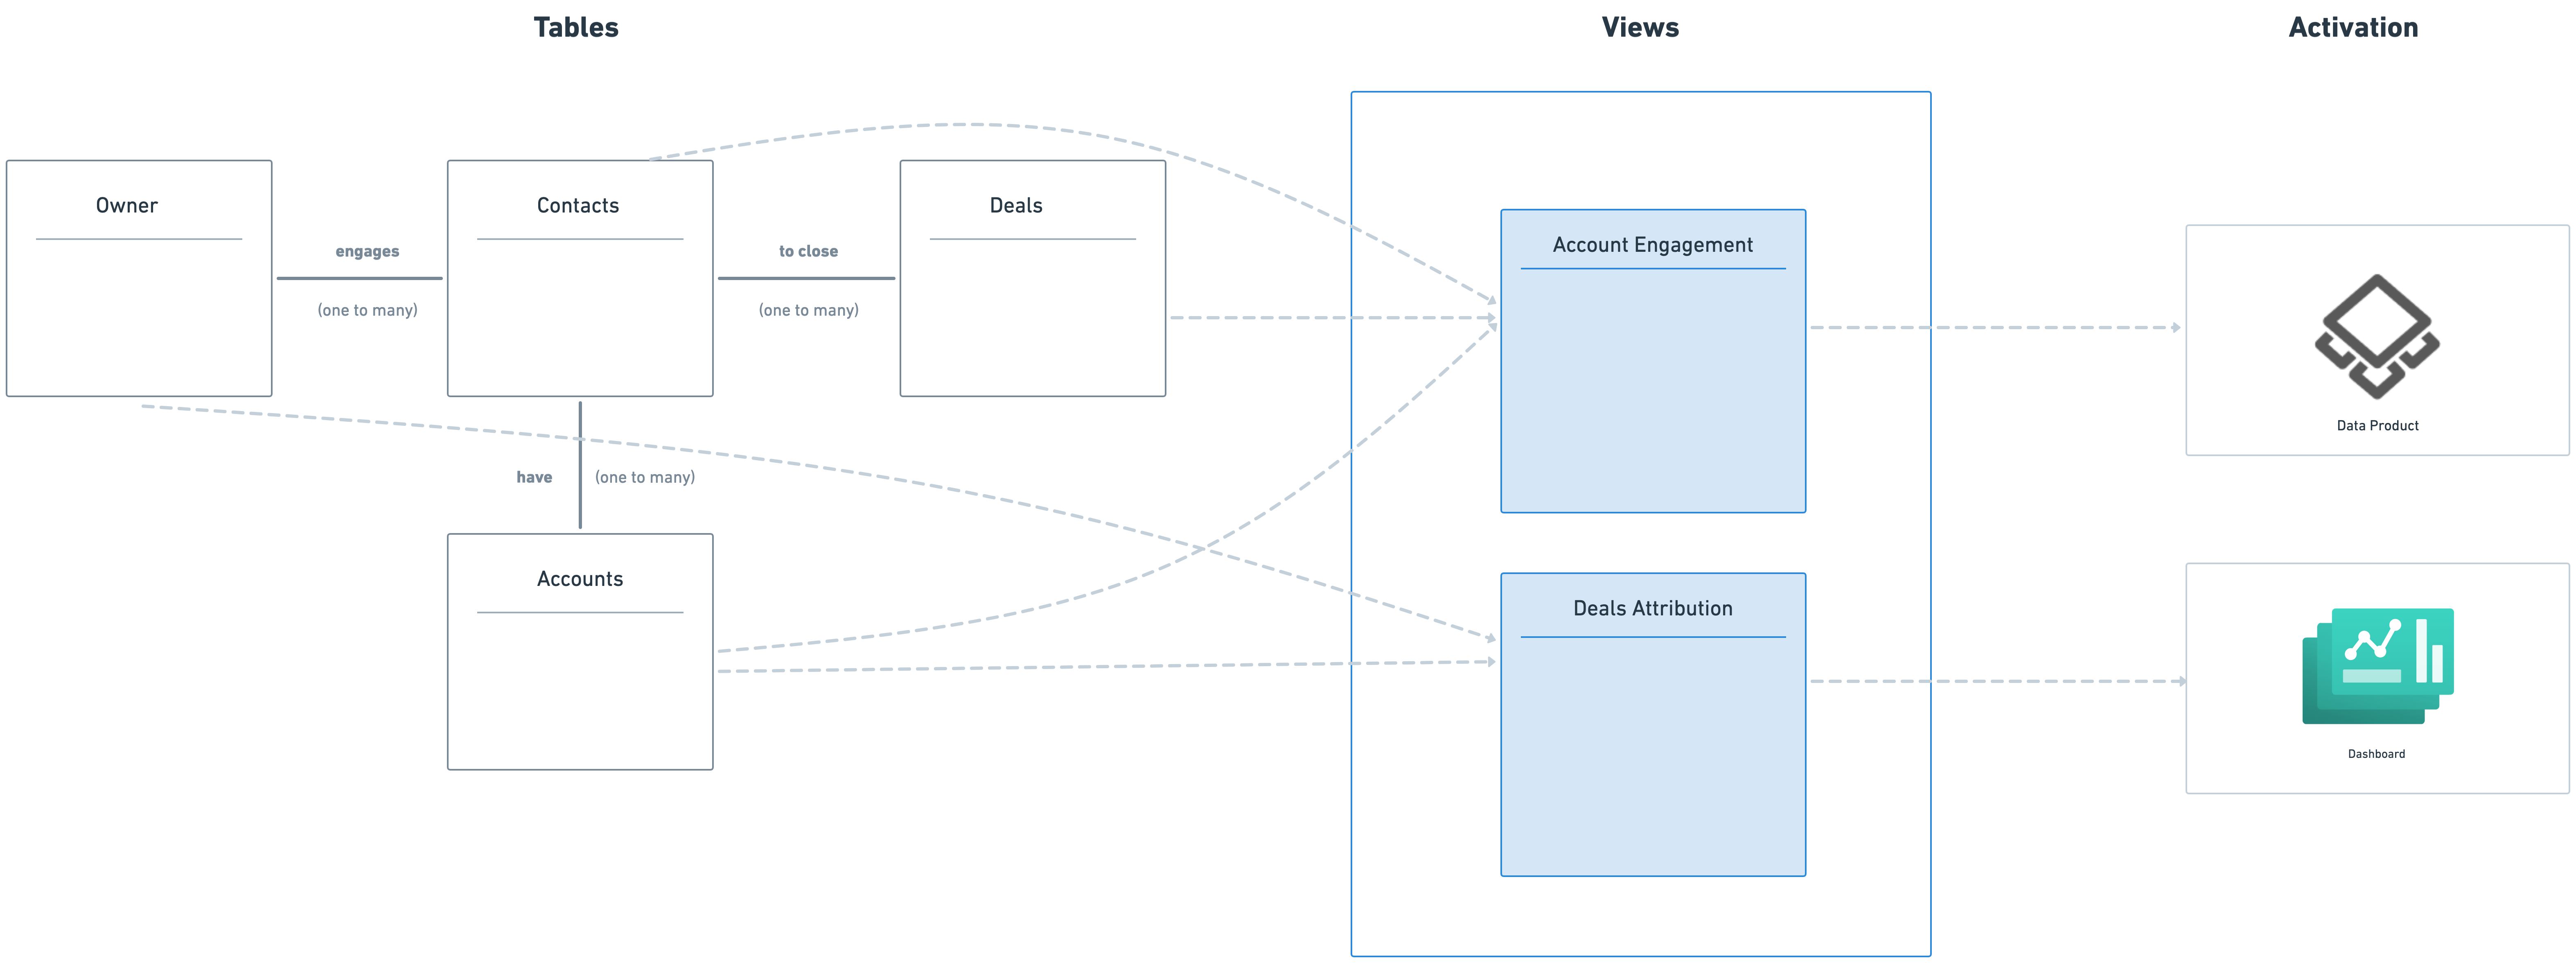
Views
Views sit on top of the data graph of Lens and create an abstraction of the whole data model with which data consumers can interact. They serve as a layer for defining metrics, providing a simplified interface for end-users to interact objectively with key metrics instead of the entire data model. A view reference serves as a way to access dimensions, measures, and segments from multiple logical tables. It does not define any measures, dimensions, or segments on its own.
The view declaration involves the following properties:
| Property | Description | Possible Values | Best Practice |
|---|---|---|---|
name |
Unique identifier for the view. | ^[a-zA-Z][a-zA-Z0-9_]*$ | Use snake_case. For example: owner_contact_analysis |
description |
Brief explanation of the view's purpose and the data it represents. | String | Provide a clear and meaningful description for better understanding. |
public |
Defines the visibility of the view—whether it is accessible to all users or restricted. | True, False | Set to True for widely used views, and False for internal or restricted views. |
tables |
List of tables included in the view and their associated configurations. | List | Ensure all necessary tables are included for a complete dataset. |
join_path |
Specifies the table(s) from which data is pulled for the view. | Table name | Define a logical join path to maintain referential integrity. |
prefix |
Indicates whether column names from the table should be prefixed with the table name to prevent conflicts. | True, False | Use True when including multiple tables with similar column names. |
includes |
Lists specific columns from the table to be included in the view. | Column names | If a measure is calculated using a dimension, ensure that the corresponding dimension is also included in the view. |
In the example below, we create the transaction_analysis view which includes selected members from transactions, and products tables:
views:
  - name: owner_contact_analysis
    description: View containing detailed information about owners and their associated contacts
    public: true

    tables:
      - join_path: owners
        prefix: true
        includes:
          - owner_id
          - owner_name
          - owner_status
          - owner_value
          - owner_city

      - join_path: contacts
        prefix: true
        includes:
          - contact_id
          - contact_name
          - contact_email
          - contact_phone
          - contact_owner_id
A more thorough introduction can be found in Working with views.