Customize SQL and Aggregations with Studio
Information
In this quick guide, we'll explore the Studio feature of DataOS Workbench. Studio is designed to simplify the process of writing complex SQL queries.
Explore advanced techniques for customizing SQL statements and aggregations using the Studio feature. Whether you're a seasoned SQL pro or just getting started, Studio's intuitive interface will help you craft powerful SQL statements with ease.
Suppose you need to analyze sales data to identify trends over time. Instead of manually writing out SQL queries, Studio allows you to select the desired aggregates (like sum, average) and measures (like sales amount, quantity sold) from drop-down menus and generates SQL based on selection.
Key Steps
Here are the essential steps to leverage the Studio feature.
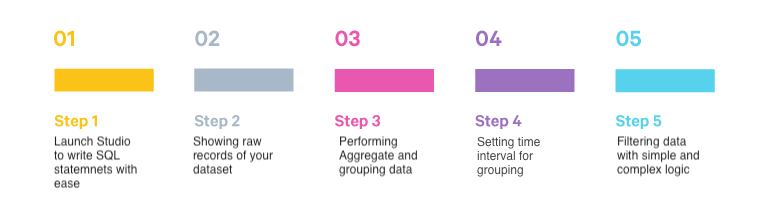
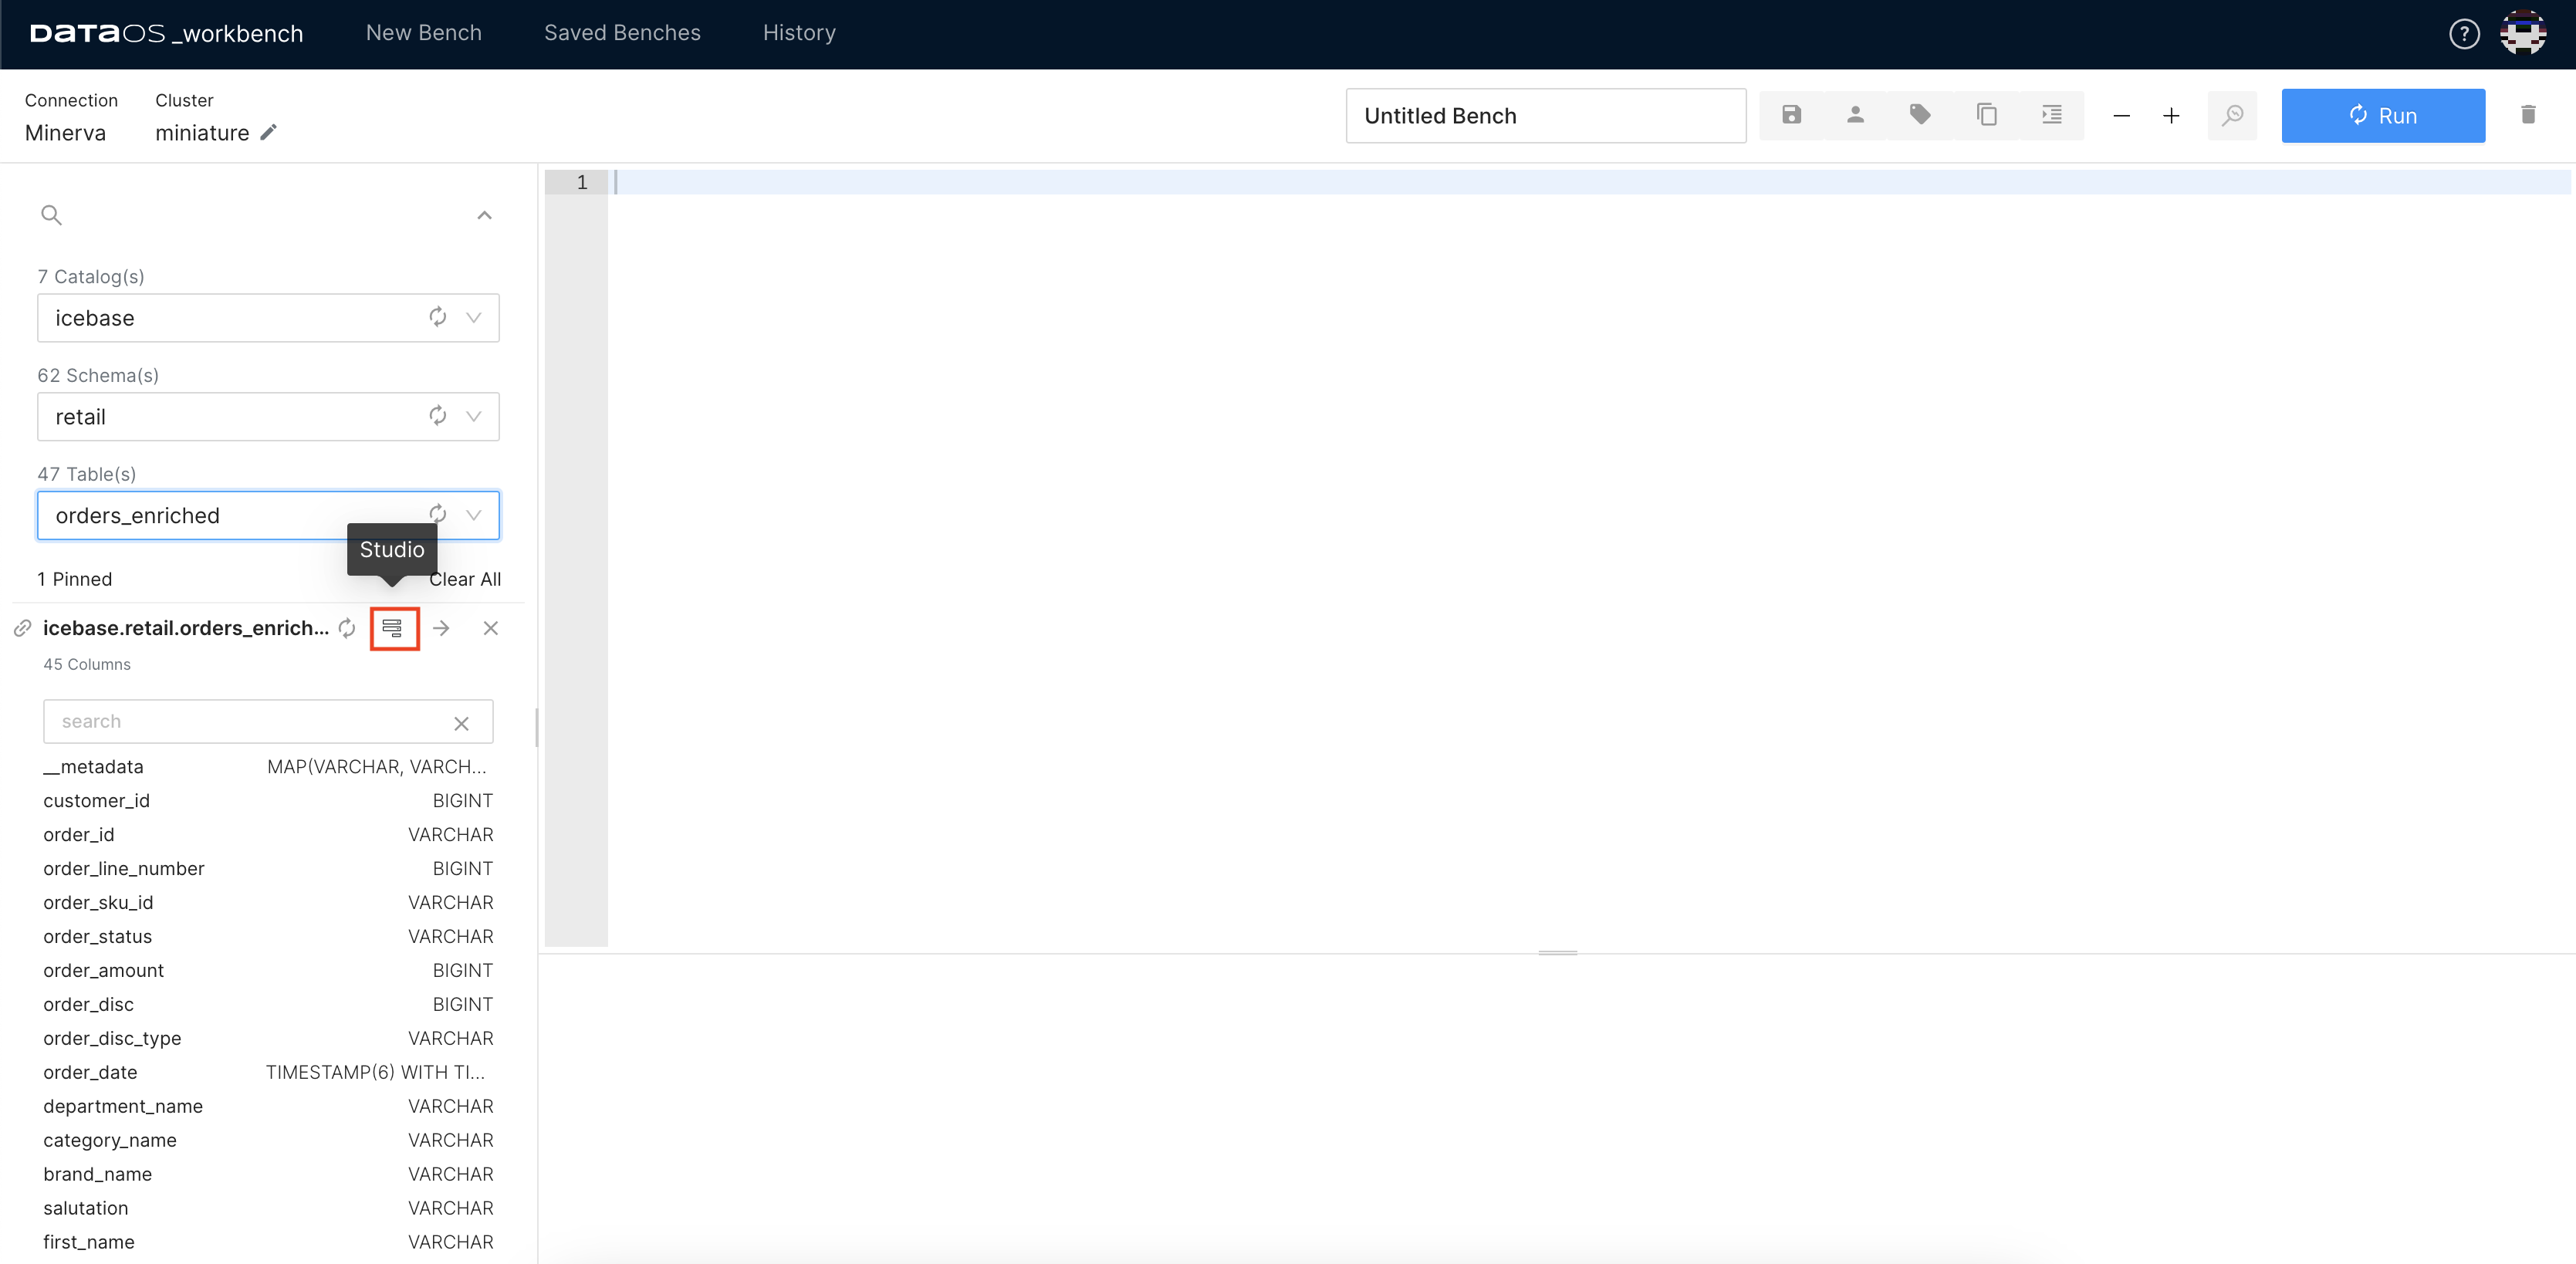
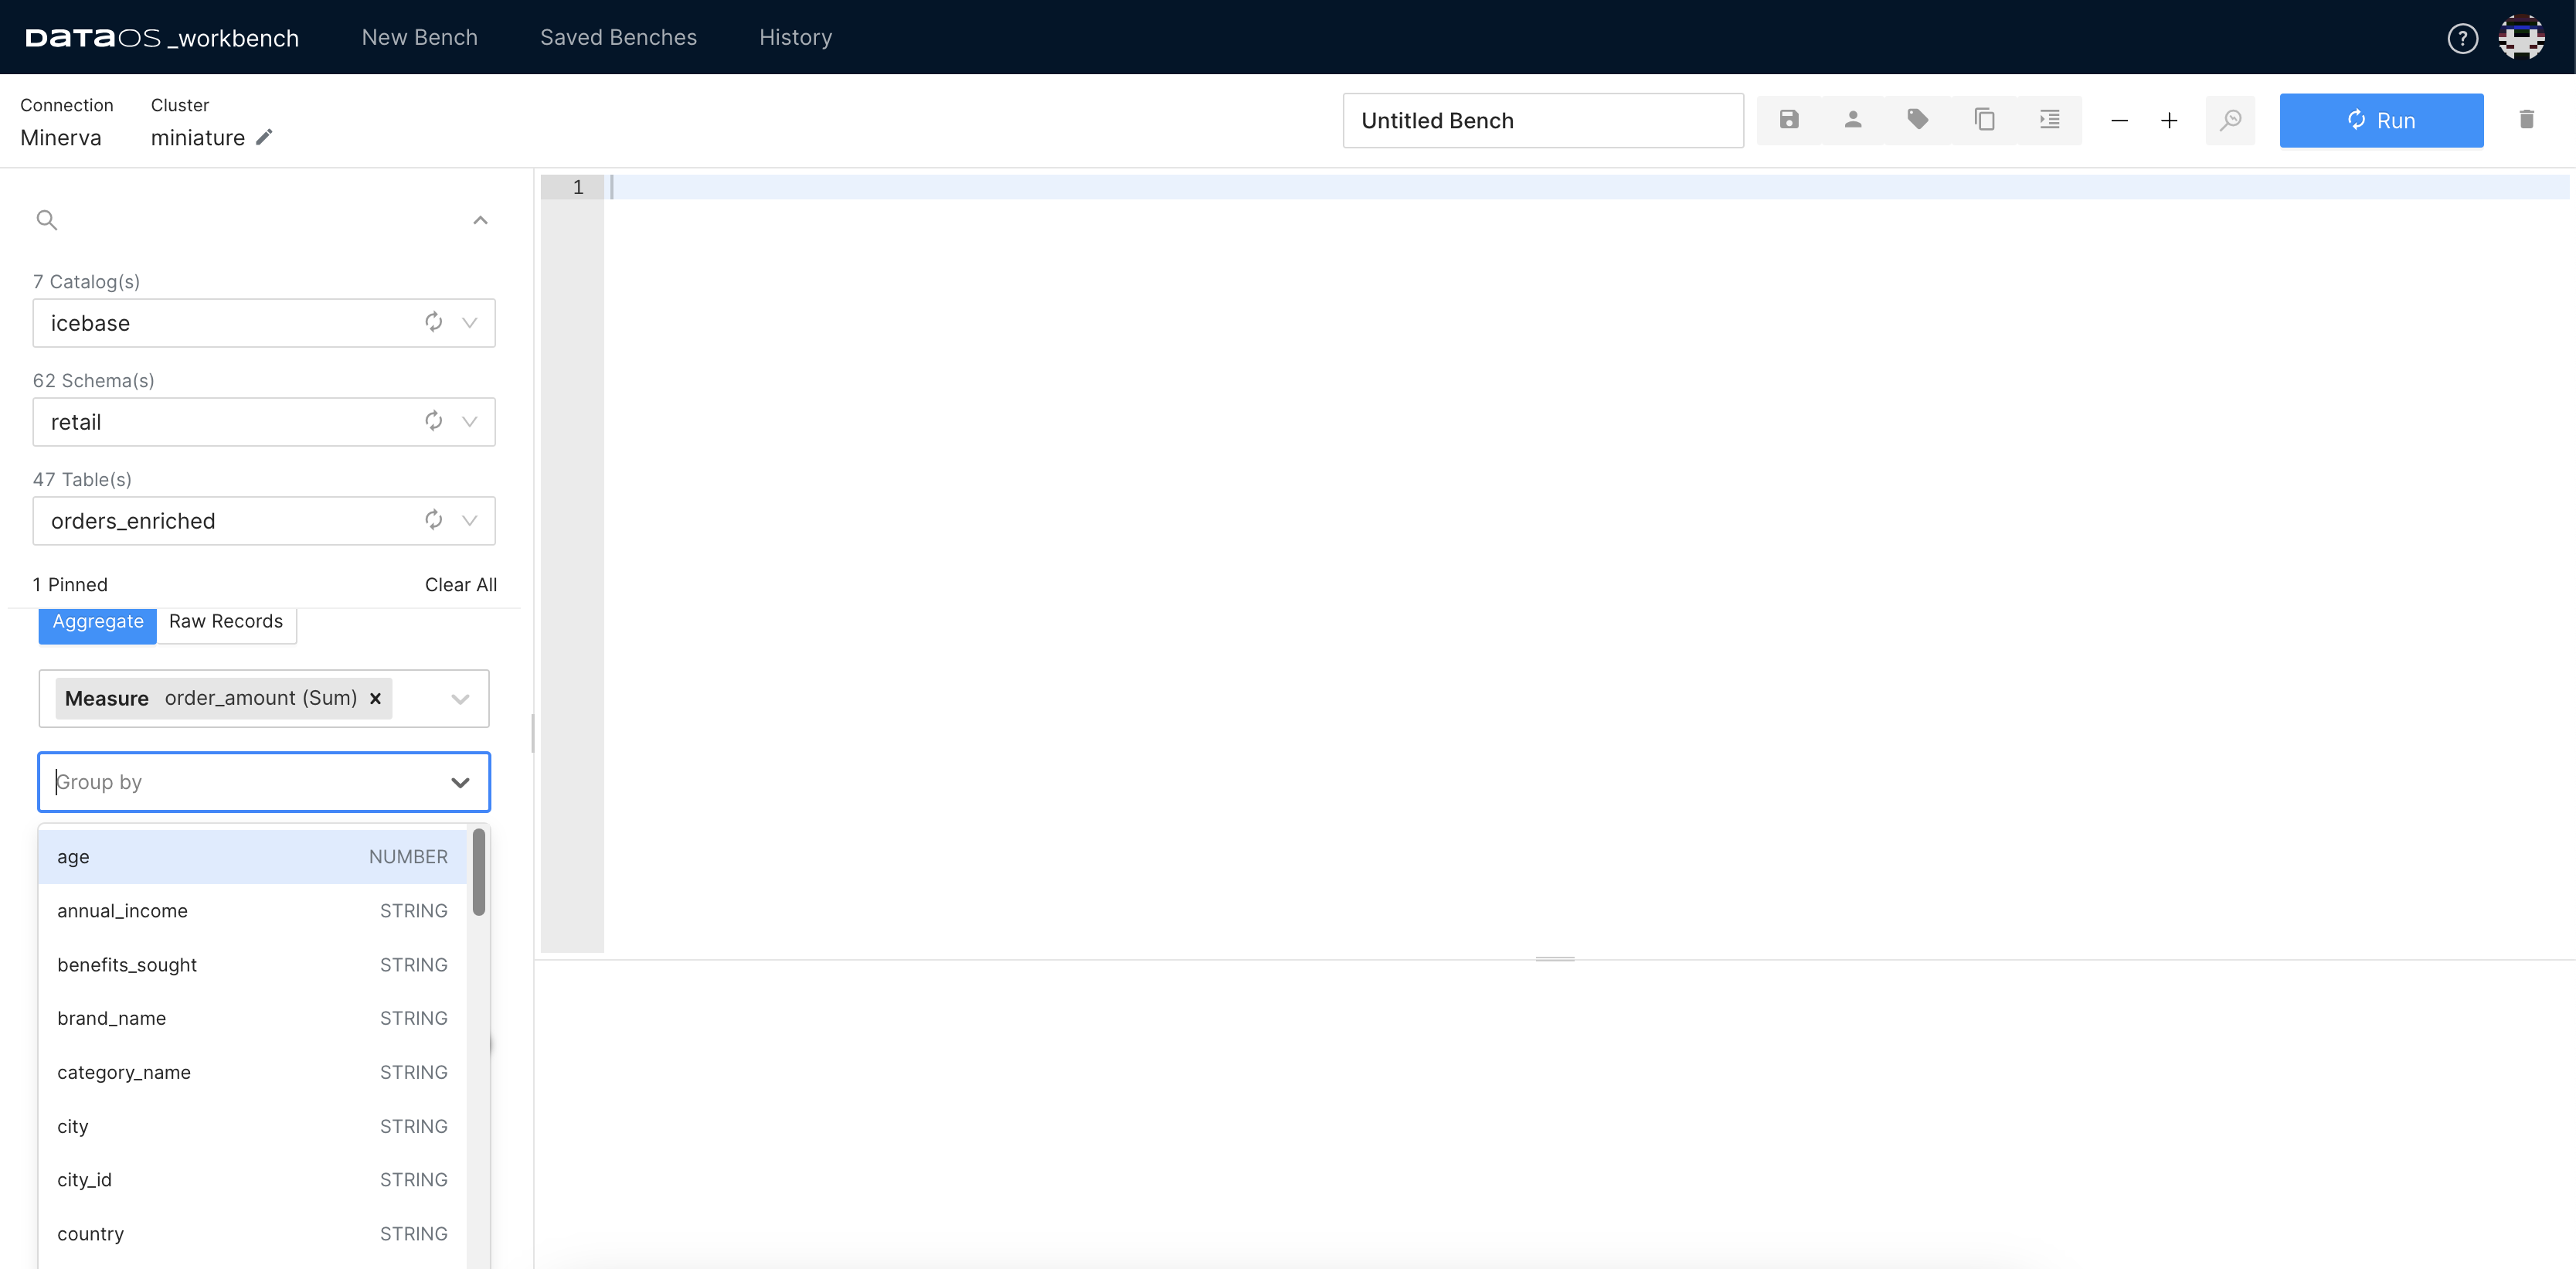
Step 1: Launching Studio
Let's get hands-on with Studio! Start the Workbench App from DataOS Home and select the catalog, schema, and desired table. Click on the Studio icon, and in a moment, you will see its interface.
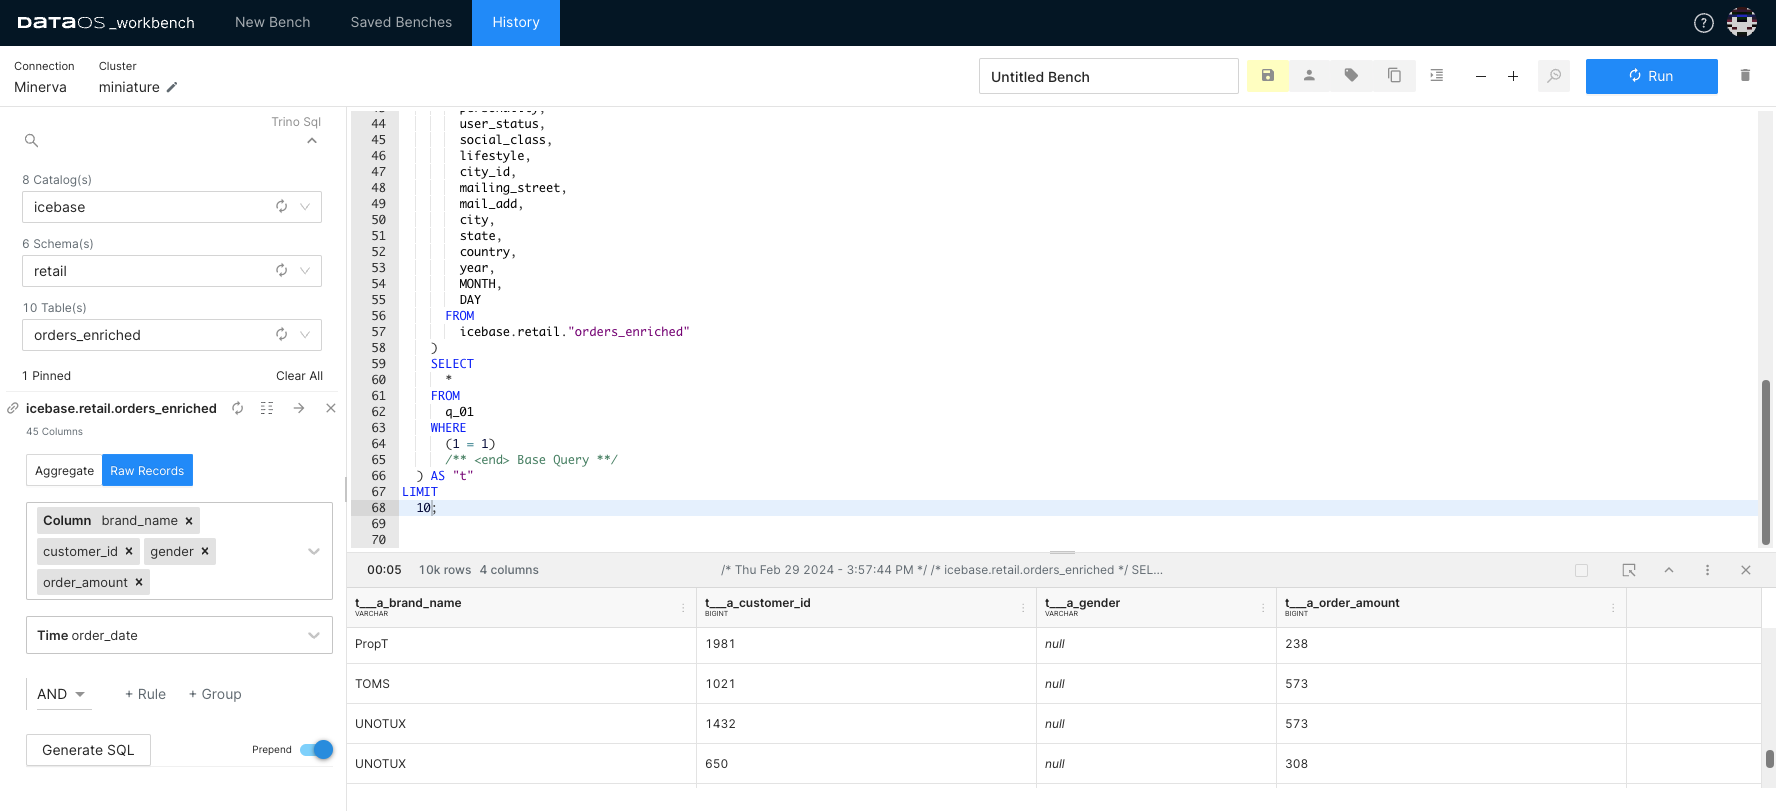
Step 2: Showing Raw Records
Raw records represent the individual data entries in your dataset, containing raw, unprocessed information.
Suppose you're analyzing a dataset containing Order data for a retail company. Examining the raw records in Studio lets you to view detailed information about each transaction, including the date, customer ID, product purchased, and order amount. This granular view will enable you to identify specific data for further analysis.
- Click on Raw Records.
- Select the columns of interest.
- Click on the Generate SQL button. Studio will generate the SQL query for you.
- Run the query to view the result.
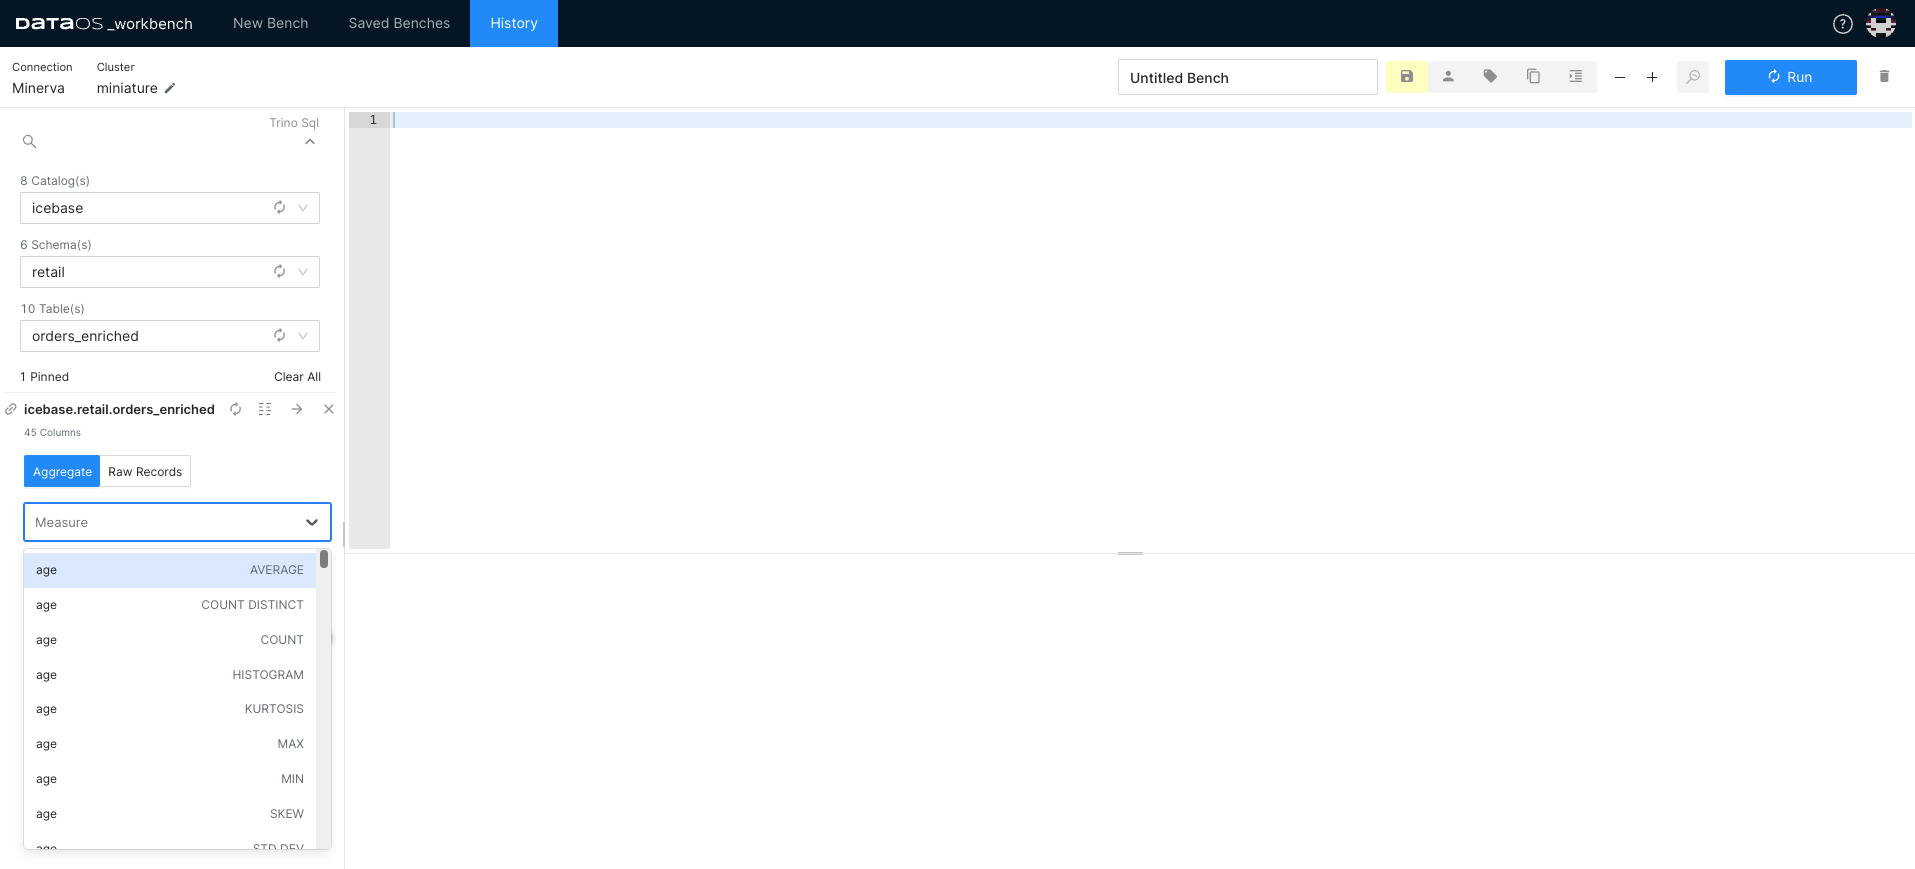
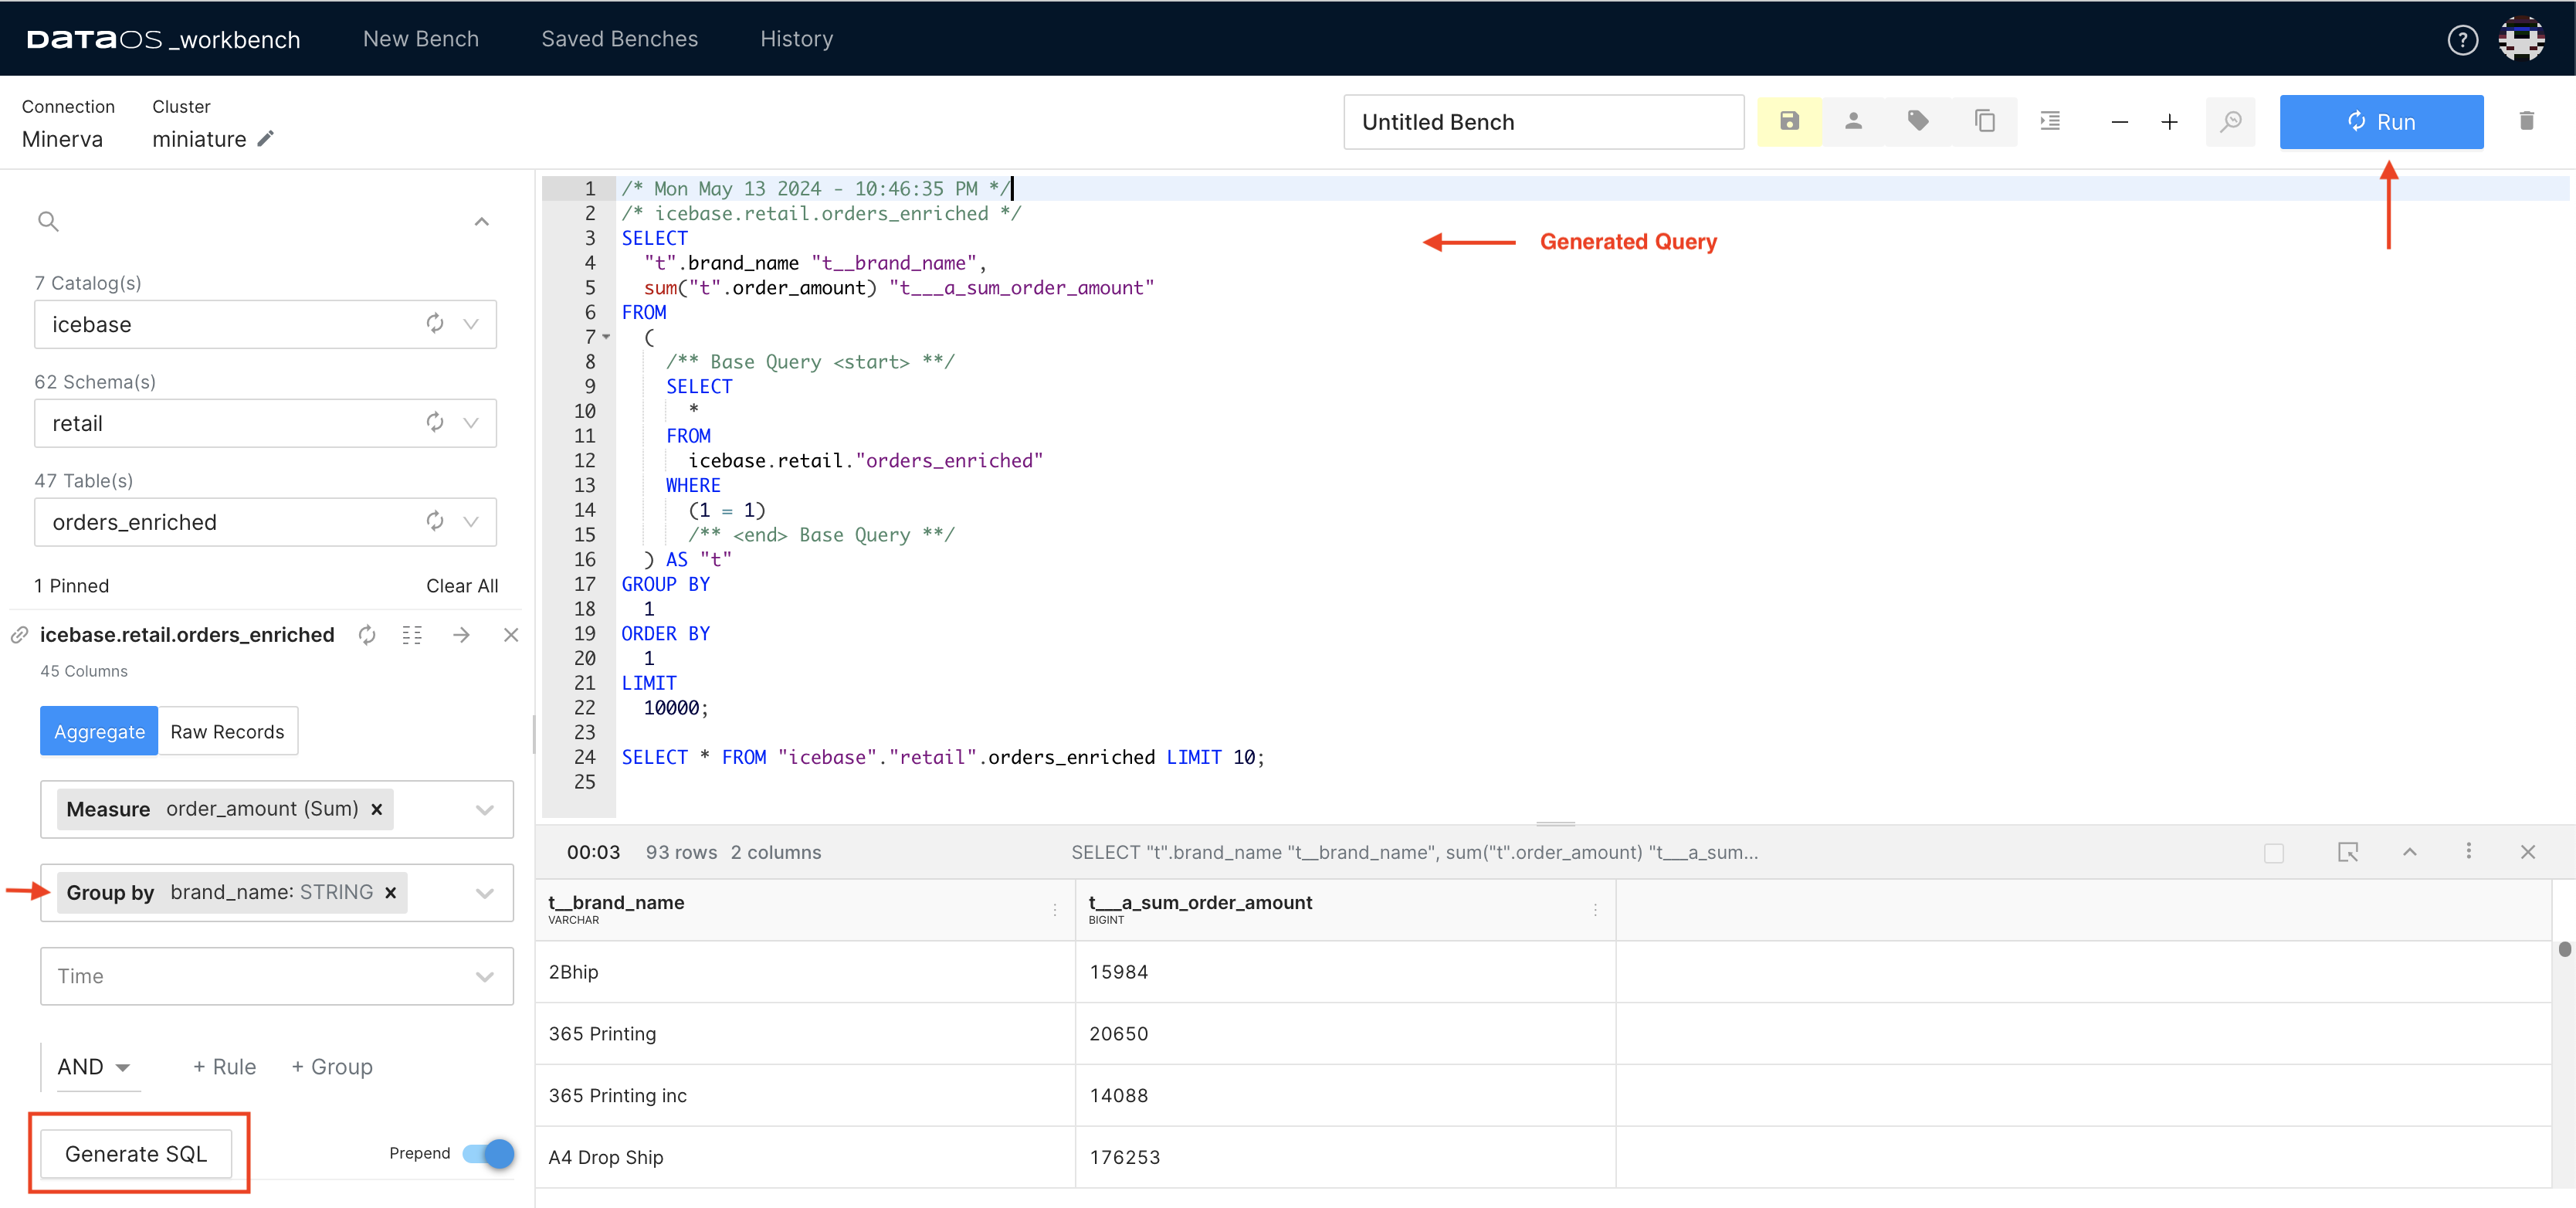
Step 3: Performing Aggregate
Studio simplifies data aggregation, enabling you to calculate sums, averages, counts, and more. It allows you to combine multiple data records into a single summary value, providing insights into overall trends and patterns within your dataset.
-
In Studio, select measure. This is a quantitative attribute or metric that you want to analyze or aggregate, such as sales revenue, quantity sold, or customer count. From the drop-down, you can select the applicable aggregate functions for the columns.
-
Select Grouping Criterion.
Grouping is a fundamental operation in data analysis that allows you to organize data based on specific criteria. In Studio, the "Group By" function enables you to group your data by one or more attributes, facilitating deeper analysis and comparison across different categories.
-
Click on Generate SQL.
- The process of generating SQL may take some time.
-
Select the generated SQL query and Run the query.
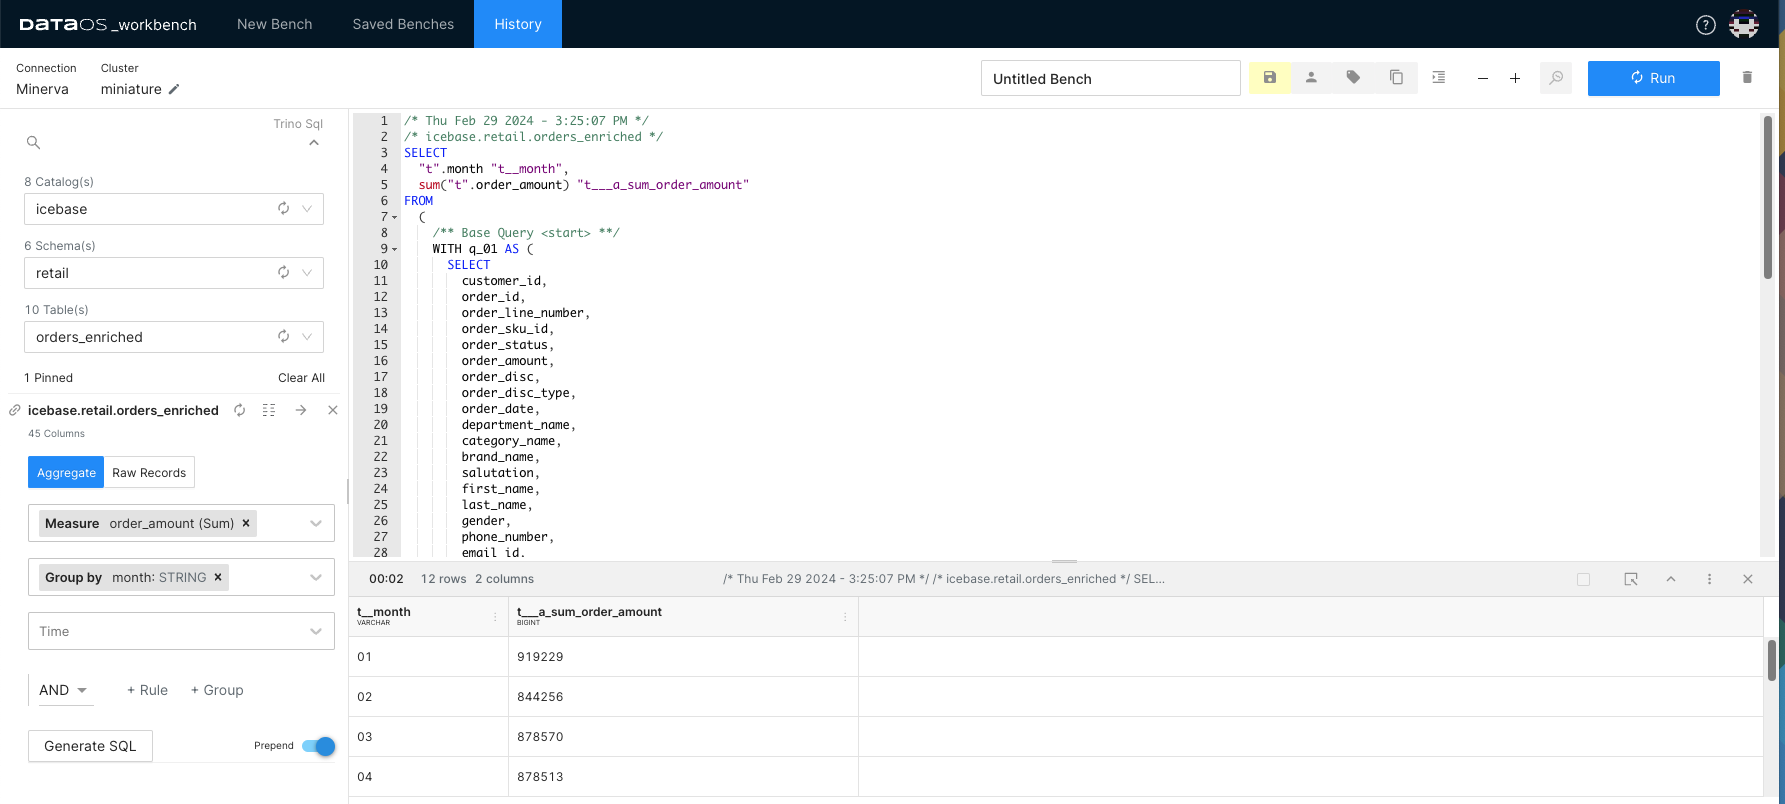
Step 4: Setting Time Interval for Grouping
Granularity refers to the level of detail or refinement in your data analysis. Studio allows you to adjust the granularity (such as daily, weekly, or monthly) of your analysis to suit your specific analytical needs. Let us explore sales performance at various levels of detail.
Suppose you want to analyze brand-wise sales data at different levels of granularity for sales trends. To find out the weekly brand-wise average sales amount for the last 30 days, follow the below steps.
- Select "order_amount" as the measure.
- Choose "Average" as the aggregation method.
- Pick the "brand_name" column to group your data. It will allow you to aggregate sales data for each brand separately.
- Choose the field representing time, such as "order_date" in this example.
- Select the desired date range from the available options, such as 30 days for this example.
- Set the granularity to Weekly.
- Click on the “Generate SQL” button. Studio will automatically generate the SQL statement for you.
- Run the query to view the results.
This way, you can get a comprehensive overview of revenue distribution across different brands for a specific period.
Step 5: Filtering Data
In Studio, filters enable you to refine your analysis by excluding irrelevant data or isolating specific segments of interest.
Adding rules and groups in filter conditions:
- Add a Rule:
- Click the "Add Rule" button to create a new rule. Define the condition for the rule by selecting a field, operator, and value.
- Group Rules:
- If you have multiple rules and want to group them with logical operators (AND, OR), click the "Add Group" button.
- Arrange the rules within the group by dragging and dropping them as needed.
- Choose the logical operator (AND, OR) to define the relationship between the grouped rules.
-
Nested Groups:
You can nest groups within other groups to create more complex filtering logic.
- Click on the "Add Group" button within an existing group to create a nested group.
- Define the conditions and logical operators for the nested group just like you did for the main group.
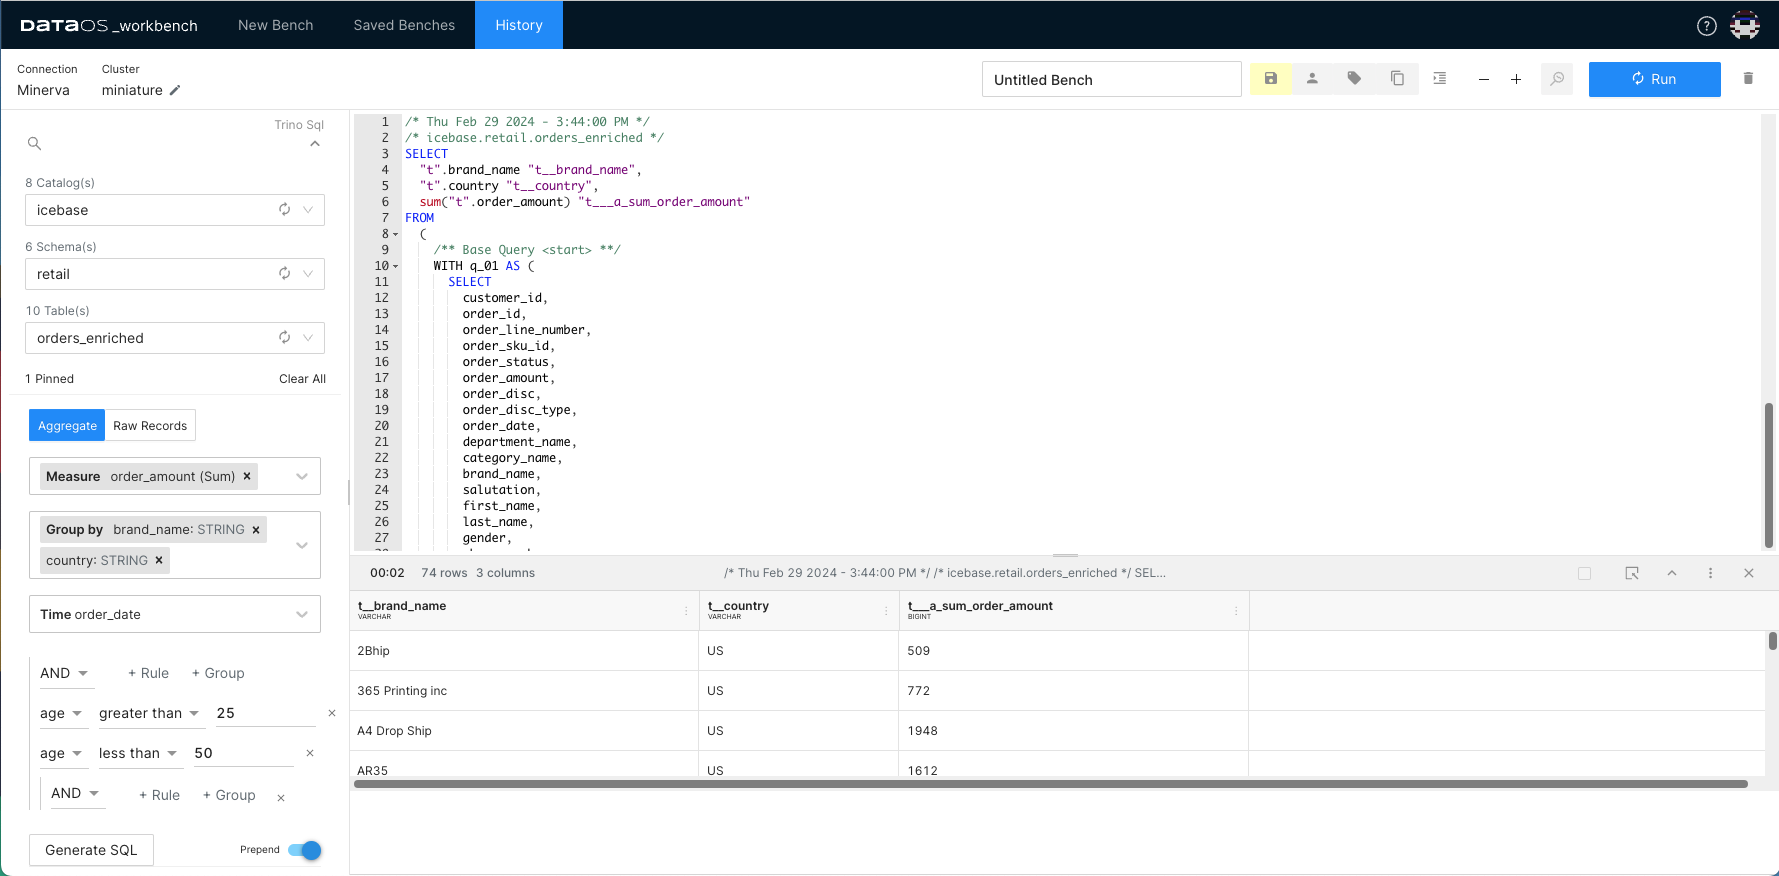
Let's assume you want to calculate the total order amount per region, but you also want to exclude certain records from the calculation, such as you are only interested in the age group (25-50).
In Studio, follow the below steps to customize the SQL statement by adding a filter to exclude data points falling outside a defined range.
- Click Aggregate.
- Select the desired measure from the drop-down.
- Select fields for grouping. You can select multiple fields for nested groups.
- Choose the field that represents time.
- Specify filter condition with AND/OR operator.
-
Click Generate SQL.
7. Run the generated query.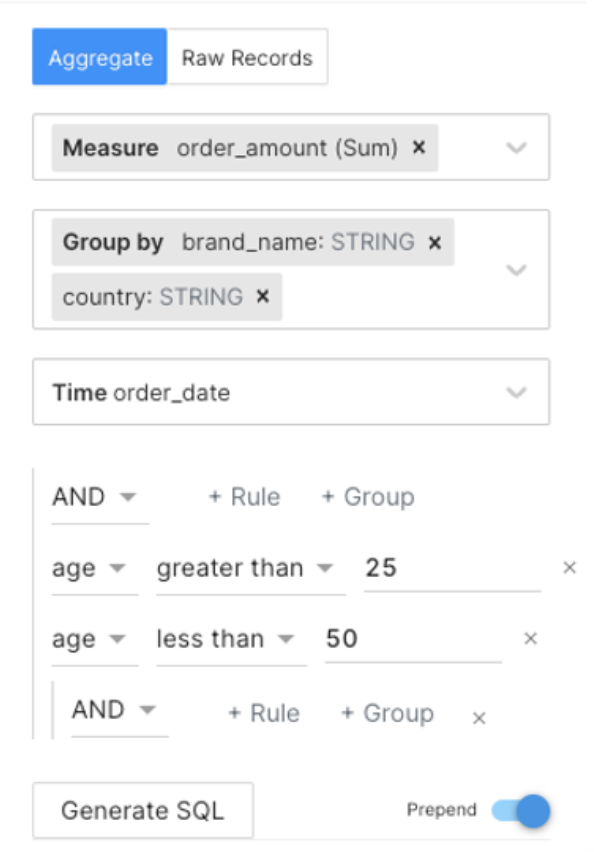
So, whether you're crunching numbers for sales reports or finding patterns in your data, you can use Studio features to turn your SQL queries into actionable insights.