Defining Data Model
Information
Before diving into designing your Lens, start by defining the key questions you want to answer and the metrics you'll need. Consider the specific aspects of your data you wish to analyze. For instance, with retail data, you might explore which products are top sellers in various regions or identify the customers with the highest spending. By focusing on these outcomes, you'll ensure your Lens is tailored to your exact requirements.
This guide outlines a step-by-step process to develop a comprehensive data model (Lens) that meets your business needs.
Key Steps
Follow the below steps:
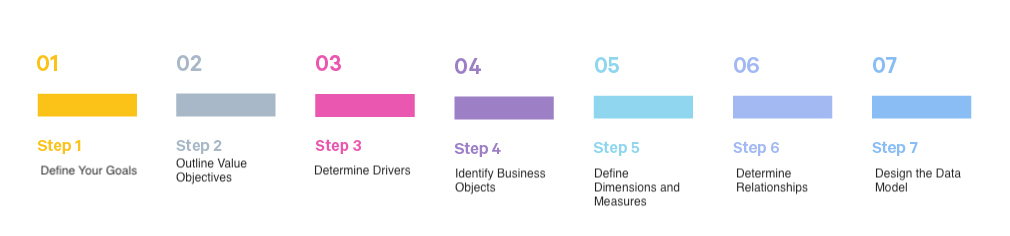
By following these steps, we will create a data model that provides a structured and insightful view of the business data, enabling informed decision-making and strategic planning.
Step 1: Define Your Goals
First, let’s clarify what we aim to achieve with our data model. This will help us set clear objectives for our analysis.
Determine the specific insights you want to gain from the retail data.
Key Questions:
- What business problems are we trying to solve?
- What insights do we need from our data?
Example:
- Goal: We want to enhance customer understanding and optimize product performance.
Step 2: Outline Value Objectives
Now, let’s identify the specific value objectives related to your retail business. This step will help us determine what data to include and how to structure it.
We need to align our data model with business priorities by focusing on key areas that will drive value:
Value Objectives:
- Customer Insights: Understand customer behavior, preferences, and segmentation.
- Product Analysis: Track product performance, sales trends, and inventory.
- Transaction Tracking: Monitor order trends, fulfillment times, and return rates.
Example:
- Customer Insights: Track customer demographics and purchase patterns.
- Product Analysis: Analyze sales performance and stock levels.
Step 3: Determine Drivers
Let’s identify the key factors or drivers that will influence our value objectives. This will guide us in defining the metrics and attributes needed for our data model.
Key Drivers:
- Customer Behavior: Metrics like customer lifetime value (CLV) and retention rates.
- Product Performance: Sales figures, profit margins, and inventory levels.
- Pricing Strategy: Impact of pricing on sales and margins.
- Geographical Analysis: Regional sales trends and preferences.
Example:
- Customer Behavior: Measure CLV and analyze churn factors.
- Product Performance: Track sales performance and inventory patterns.
Step 4: Identify Business Objects
Let’s determine the core entities (business objects) that our data model will include. Each entity should represent a significant aspect of the business and should be relevant to answering all our data questions.
Core Entities:
-
Customers: Information about individual customers.
-
Products: Details of the products sold.
-
Transactions: Records of sales and orders.
Step 5: Define Dimensions and Measures
Now, let’s specify the dimensions (attributes that provide context) and measures (quantitative values) that will be used in our model.
Dimensions:
- Customer Dimensions: Age, gender, location.
- Product Dimensions: Product category, brand.
- Geographical Dimensions: Region, country.
Measures:
- Customer Measures: Metrics like Total spend, and frequency of purchases.
- Product Measures: Sales volume, profit margin
- Transaction Measures: Order total, Average order value, Fulfilment time.
Step 6: Determine Relationships
Finally, let’s define how different entities are related to each other.
Relationships:
- Customer to Transaction: One-to-many (one customer can have multiple transactions).
- Transaction to Product: Many-to-one (multiple transactions can involve the same product).
This will allow you to answer cross-category questions such as:
- What products are most frequently purchased by different customer segments?
- How do changes in product offerings impact customer purchasing patterns?
- How do sales performance and order trends vary by geographic region?
- What regional factors influence sales performance?
Step 7: Design the Data Model
After establishing your goals, value objectives, drivers, measures, and dimensions, the next crucial step is designing the data model. This involves conceptually representing business objects, their relationships, and the rules governing them within the DataOS Lens framework.
Now, we will create a logical schema as the foundation, which can then be customized to create specific Lenses tailored to various use cases.
Create Tables
Tables organize measures and dimensions into coherent structures that represent distinct business objects comprehensively.
| Table Name | Measures | Dimensions |
|---|---|---|
| Customer Table | Lifetime value, churn rate, average spend per customer | Customer ID, name, segment, geography, purchase history |
| Product Table | Total sales volume, inventory levels, return rates, average price | Product ID, name, category, supplier, stock status |
| Transaction Table | Total transaction value, average transaction amount, error rates, payment method usage | Transaction ID, order ID, date, amount, payment method |
Create Business Views
Tailor your data model by creating business views that encapsulate the identified drivers and metrics. These views are designed to provide targeted insights into specific value objectives, such as 'account engagement' or 'sales funnel analysis'. By organizing data into these focused perspectives, you ensure that complex data is distilled into actionable insights, directly aligned with your strategic goals. To build these business views, tables serve as the foundational components.
| Business View | Focus Areas | Metrics |
|---|---|---|
| Customer Insights View | Analyzes customer behavior and loyalty. | Lifetime value, retention rates, engagement levels |
| Product Analysis View | Analysis of product-related data, including categories, pricing, and margins. This data can help in evaluating product success and performance. | average margin, average price, inventory turnover, and product launch dates for time series analysis |
| Transaction Analysis View | Examines financial aspects, and product associations which help in identifying trends in transactions. | Total transaction value, total transaction volume, average transaction value, payment method distribution |
Next Steps
Now, we are ready to create our logical, detailed data model (Lens) that will drive the analytical processes forward.