Observability Use Case: Resolving CPU Limit Breach on Cluster Resource
This document describes a real-world example of how users handle alerts in DataOS. It walks through each step from getting an alert to fixing the issue. The guide shows how the observability tools work together to help users find and solve issues quickly and effectively.
Teams alert
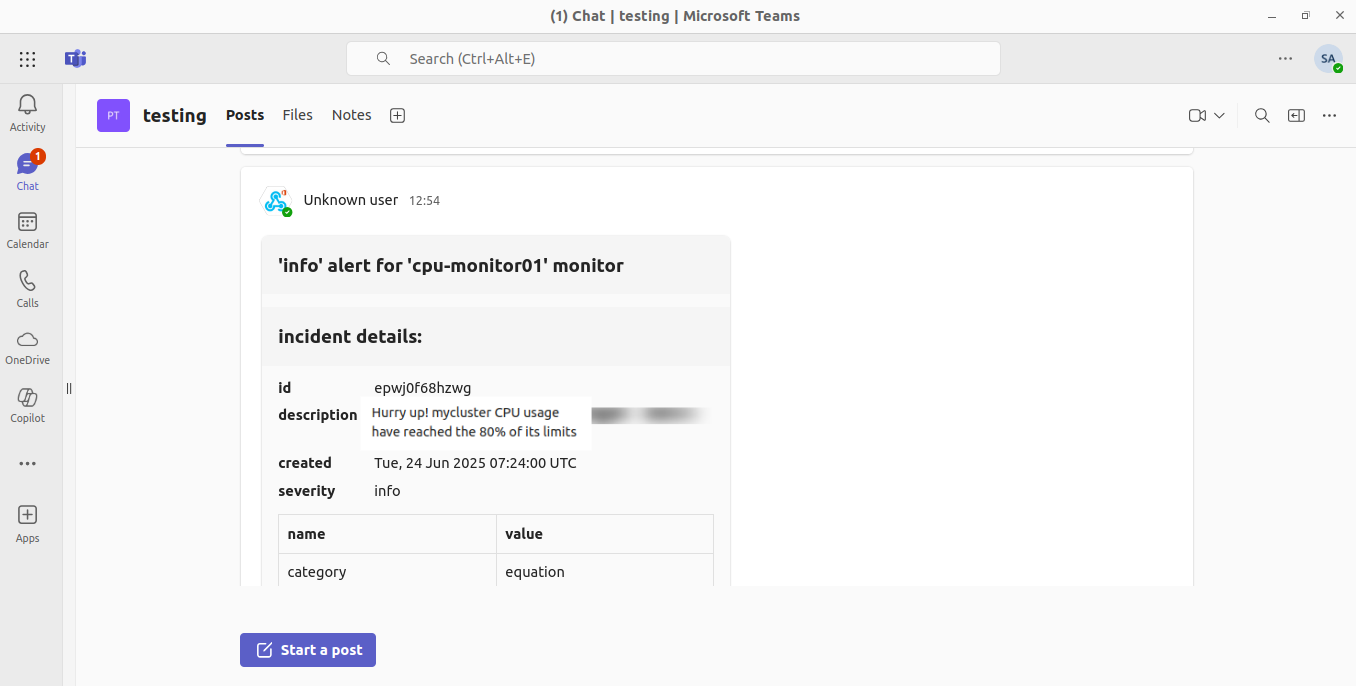
An observability Monitor in DataOS detected that a Cluster’s CPU usage had surpassed a critical threshold, automatically triggering an Incident. The Cluster is the part of a Data Product powering a business use case. DataOS pairs the Monitors with a Pager Resource to route alerts to external channels. In this case, the Pager was configured with a Microsoft Teams webhook, causing an instant alert notification in the team’s channel. The MS Teams message contained key details (monitor name, severity “high”, timestamp, and description), informing the operators that the Cluster’s CPU limit was breached. This seamless integration of DataOS Monitor and Pager ensured the team received real-time notification of the issue via Microsoft Teams, enabling a quick response.
Monitor and Pager setup
The user had configured the alerts using: a Monitor Resource that tracked CPU utilization on a Cluster, and a Pager Resource that sent alerts through Microsoft Teams when the Monitor detected an issue. Below is how these were configured and worked together to trigger the alert.
Configuration
Prior to this incident, the user had set up a Monitor manifest to watch the cluster’s CPU utilization.
- The monitor was scheduled to run periodically (e.g., every 2 minutes) and evaluate a Prometheus query against DataOS’s metrics store.
- In the manifest, the left-hand expression was defined as a PromQL query (
type: prom) targeting the “thanos” cluster (DataOS’s internal metrics endpoint). - This query measured the cluster’s current CPU usage (for example, as a percentage of its limit or in millicores). The right-hand side was a constant threshold (e.g., 80% or an equivalent value), and the operator was
greater_than, so the condition would trigger if CPU usage stayed above the threshold. - Alongside the Monitor, the user configured a Pager resource to forward the incident as an alert to Microsoft Teams. The Pager’s manifest specified an output section with an MS Teams webhook URL.
- This tells DataOS to send any incident caught by this Pager to the given Teams channel. (Optional filtering rules can be set in the Pager via conditions, such as matching the incident name or severity, ensuring only relevant incidents trigger the alert) With this setup in place, whenever the CPU monitor’s incident fired, the Pager would post a formatted alert message into Teams.
- The alert message included details like the monitor name and description, severity level, and timestamp.
- In this scenario, as soon as the Cluster’s CPU usage hit the threshold for the configured duration, the Monitor created an incident, which the Pager caught. An operator saw a Teams notification (e.g., “Alert: cpu-monitor01 triggered with severity
infoat 07:26:00. Description: Cluster CPU usage above 80%...”). This immediate alert gave the team a heads-up about potential Resource degradation.
In practice, the ql, PromQL would be formulated to retrieve the CPU usage metric for the specific Cluster (e.g., using labels or an ID for that Cluster). When the average CPU usage exceeded 80%, the Monitor would mark the condition as met and create an incident.
Steps
-
Executed the following command in DataOS CLI to get the pod name corresponding to the Cluster that needs to be monitored.
Output:
dataos-ctl log -t cluster -w public -n mycluster INFO[0000] 📃 log(public)... INFO[0001] 📃 log(public)...complete NODE NAME │ CONTAINER NAME │ ERROR ─────────────────┼────────────────┼──────── mycluster-ss-0 │ mycluster │ # ^ pod name -------------------LOGS------------------- =========== Configuring core - Setting io.compression.codecs=org.apache.hadoop.io.compress.SnappyCodec >> /usr/trino/etc/catalog/core-site.xml <configuration> <property><name>io.compression.codecs</name><value>org.apache.hadoop.io.compress.SnappyCodec</value></property> </configuration>\n----------- JVM Options: /usr/trino/etc/jvm.config -server -Xmx128G -XX:+UseG1GC -XX:G1HeapRegionSize=32M -XX:+UseGCOverheadLimit -XX:+ExplicitGCInvokesConcurrent -XX:+HeapDumpOnOutOfMemoryError -Djdk.attach.allowAttachSelf=true --enable-native-access=ALL-UNNAMED Config: /usr/trino/etc/config.properties -
Created a Monitor Resource manifest file as shown below. This manifest defines the logic for comparing actual CPU usage against the pod's total CPU limit. The incident will be triggered if usage exceeds 80% of the limit.
name: cpu-monitor01 description: Monitor for CPU usage of the perspectivedb-rest container version: v1alpha type: monitor monitor: schedule: '*/2 * * * *' type: equation_monitor equation: leftExpression: queryCoefficient: 1 queryConstant: 0 query: type: prom ql: '100 * (sum by(pod) (rate(container_cpu_usage_seconds_total{pod="mycluster-ss-0"}[5m])))/sum by(pod) (kube_pod_container_resource_limits{pod="mycluster-ss-0", resource="cpu"})' rightExpression: queryCoefficient: 0 queryConstant: 80 operator: greater_than incident: type: prom name: cpualerts category: equation severity: info operator: greater_than -
Validate the incident condition if it is configured correctly by executing the command below.
output:
The Monitor ran successfully, but CPU usage was below 80% of the pod's limit. No incident is triggered at that time.
bash CopyEdit INFO[0000] 🔮 develop observability... INFO[0000] 🔮 develop observability...monitor tcp-stream...starting INFO[0001] 🔮 develop observability...monitor tcp-stream...running INFO[0002] 🔮 develop observability...monitor tcp-stream...stopping INFO[0002] 🔮 context cancelled, monitor tcp-stream is closing. INFO[0003] 🔮 develop observability...complete RESULT (maxRows: 10, totalRows:0): 🟧 monitor condition not met -
Executed the following command to apply the Monitor.
-
Verified the Monitor runtime. This step ensures that the Monitor has been successfully registered and is running as expected.
-
Created a Pager Resource manifest file. This manifest configures the alert delivery path. It listens for the incident triggered by the Monitor and sends the alert to a Teams channel or any other webhook.
name: pod-cpu-limit-pager version: v1alpha type: pager description: Pager to alert when pod CPU usage exceeds 80% of its defined CPU limit workspace: public pager: conditions: - valueJqFilter: .properties.name operator: equals value: cpu-limit-violation output: webHook: url: {{MS_TEAMS_WEBHOOK_URL}} verb: post headers: 'content-type': 'application/json' bodyTemplate: | { "title": "Pod CPU Usage Alert", "text": "CPU usage exceeded 80% of the defined CPU limit for pod mycluster-ss-0": { "Pod": "{{ .Labels.pod }}", "Time": "{{ .CreateTime }}", "Severity": "{{ .Properties.severity }}" } } -
Once defined, apply the Pager Resource using the command below.
-
Get notified! When the CPU usage condition is met, the incident is triggered, and the Pager sends the notification to the configured destination.
Investigate in Operations
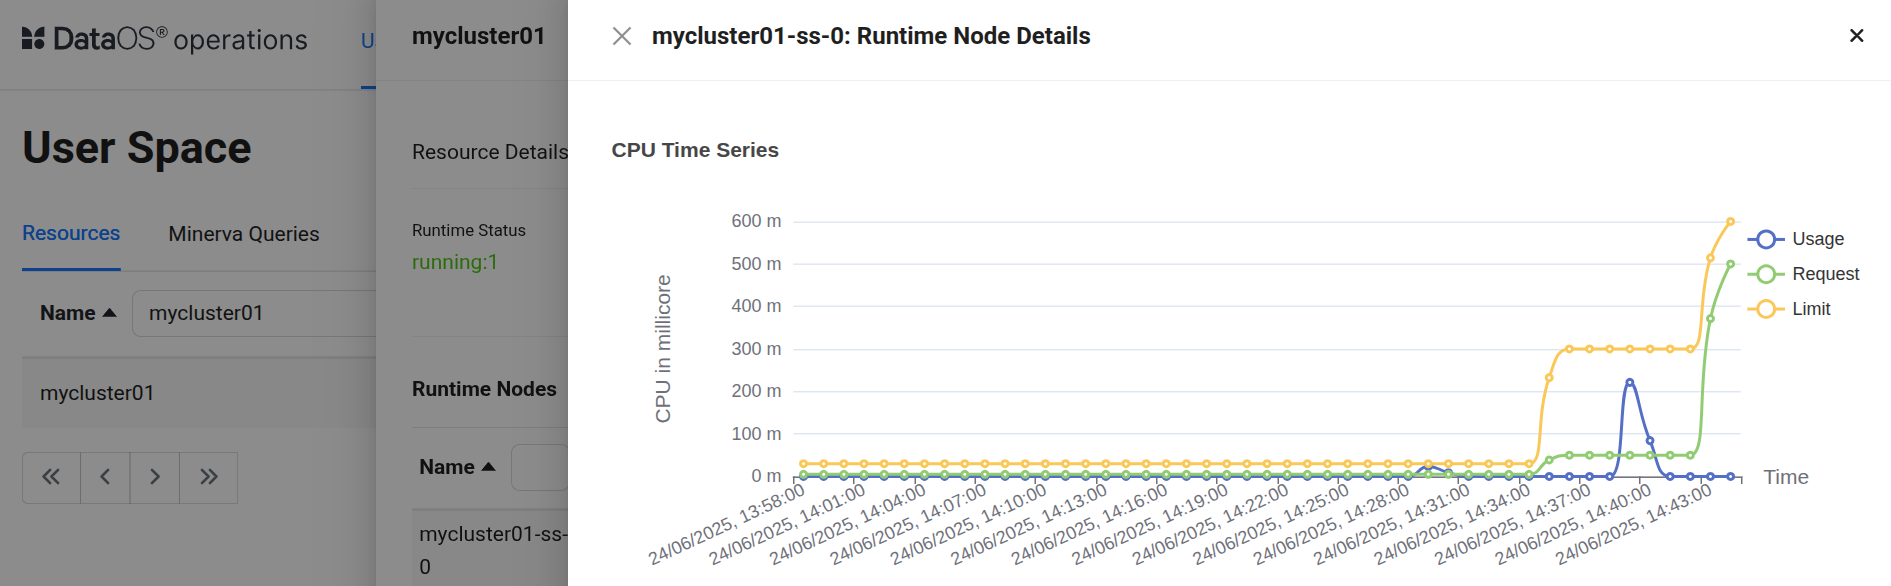
Upon receiving the alert, the user turned to the Operations App to check on the CPU usage of the Cluster named ‘mycluster01’. They focused on CPU usage vs. CPU limit for the affected Cluster. Operations App displayed a table for the Cluster’s CPU consumption, confirming the alert’s details: the CPU usage was more the 80% of the configured limit.
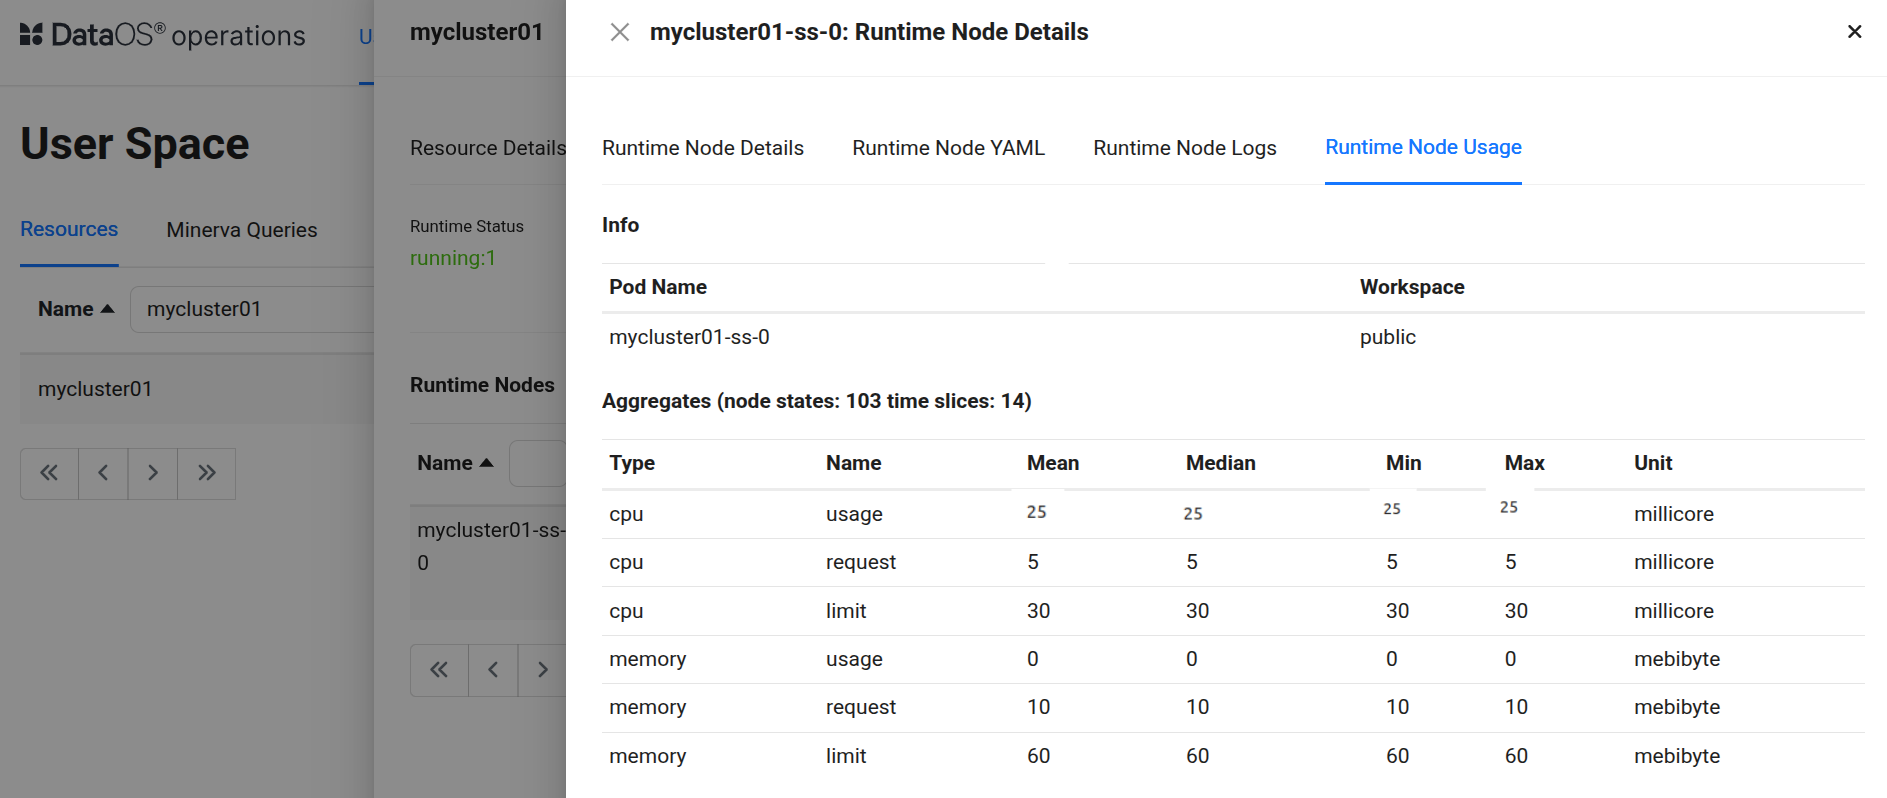
This made it clear that the Cluster’s CPU was fully saturated, the usage metric would reach the value of the limit, and could not go any higher. This evidence pointed to the Cluster being CPU-starved. This aligned with the alert: the CPU usage remained above the 80% threshold consistently, triggering the incident.
Root cause: CPU limit
The root cause became evident: the Cluster’s CPU limit was set too low for its workload, causing it to be maxed out under load. In DataOS, a Cluster Resource is backed by a certain amount of compute capacity (CPU and memory). In this case, the Cluster was configured (via its YAML) with a fixed CPU limit. During normal operation, this might have been sufficient, but at the time of the incident, concurrent heavy queries or an unexpected spike in workload demanded more processing power than the defined limit. Since the container was capped at its CPU limit, it could not utilize more CPU, even though the host had free capacity. “Containers cannot use more CPU than the configured limit.”
In essence, the cluster was under-provisioned for the workload: it ran out of CPU headroom. The observability data ruled out other causes (no memory bottleneck or errors were observed) and pinpointed CPU exhaustion as the culprit. The high CPU usage incident was not a one-time glitch but a symptom of sustained load exceeding capacity. This analysis highlighted that the CPU limit configured for the cluster was too low, and the cluster needed more CPU to handle the demand.
Remediation: Raise CPU limit
To fix the issue, the team adjusted the Cluster’s resource allocation. The user updated the Cluster’s YAML manifest to increase its CPU limits (and corresponding requests). They updated the CPU values to grant more CPU. For instance, increasing the CPU limit from 30m to 300m. The new configuration would be:
# Resource meta section
name: mycluster01
version: v1
type: cluster
description: testing
tags:
  - cluster

# Cluster-specific section
cluster:
  compute: query-default
  type: minerva

  # Minerva-specific section
  minerva:
    replicas: 1
    resources:
      limits:  # updated CPU usage limit
        cpu: 300m
        memory: 600Mi
      requests:
        cpu: 50m
        memory: 100Mi
    debug:
      logLevel: INFO
      trinoLogLevel: ERROR
    depots:
      - address: dataos://stredshiftexternal
This change effectively allocates a higher CPU usage limit, giving it more processing capacity.
After updating the manifest, the user re-applied it to update the running Cluster. Using the DataOS CLI, by executing the below command:
Output:
INFO[0000] 🛠 apply...
INFO[0000] 🔧 applying(public) mycluster01:v1:cluster...
INFO[0001] 🔧 applying(public) mycluster01:v1:cluster...updated
INFO[0001] 🛠 apply...complete
This command pushes the new configuration to DataOS, updating the Cluster resource with the higher CPU limit (in Kubernetes terms, this would update the pod’s resource limits). The platform then provisioned the additional CPU for the Cluster. Once this step is complete, the Cluster resource gets updated with the new CPU allocation as shown below.
Conclusion
This scenario highlights a meaningful use of DataOS observability. The Monitor and Pager alerting system gave early warning of a resource saturation issue, allowing the team to respond before a complete outage occurred. By leveraging DataOS’s observability features, the user ensured the platform’s reliability and performance were maintained. In summary, the Monitor/Pager combo identified a CPU bottleneck, guided the remedial action, and verified the outcome, exemplifying how DataOS observability empowers incident management and system tuning. The Cluster was restored swiftly, and stakeholders were confident knowing that the monitoring in place would catch similar issues in the future, demonstrating the value of observability in DataOS.