Monitor the Status and Runtime of the Cluster
The status indicates the Resource's lifecycle state, such as active, error, or deleted, and helps users quickly assess whether the Resource is available and functioning as expected. In contrast, the runtime reflects the Resource's execution state, such as running, failed, or pending, capturing what is actively happening behind the scenes, typically at the container or pod level. Together, these signals help users to detect configuration issues, operational failures, and disruptions that could impact downstream workflows.
DataOS CLI
The status and Runtime of a Cluster can be monitored using the DataOS CLI by executing the following command.
Example Usage:
dataos-ctl get -t cluster -w public -a
INFO[0000] 🔍 get...
INFO[0001] 🔍 get...complete

NAME    | VERSION |  TYPE   | WORKSPACE |   STATUS    |  RUNTIME  |         OWNER
------------|---------|---------|-----------|-------------|-----------|-------------------------
lakehouse  | v1      | cluster | public    | active | running:1 | iamgroot
Metis Catalog
To monitor the status and runtime of a Cluster on the Metis Catalog UI, follow the steps below:
-
Open the Metis Catalog.

Open the Metis Catalog -
Search for the Cluster by name.
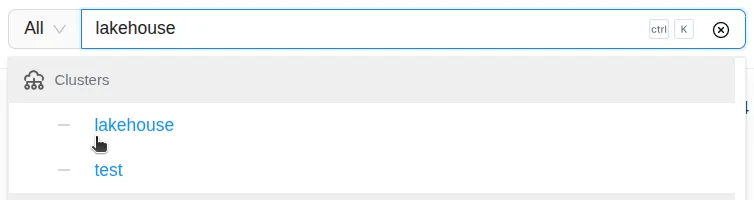
Search the Cluster in Metis Catalog </div>-
Click on the Cluster that needs to be monitored and check the status and runtime.
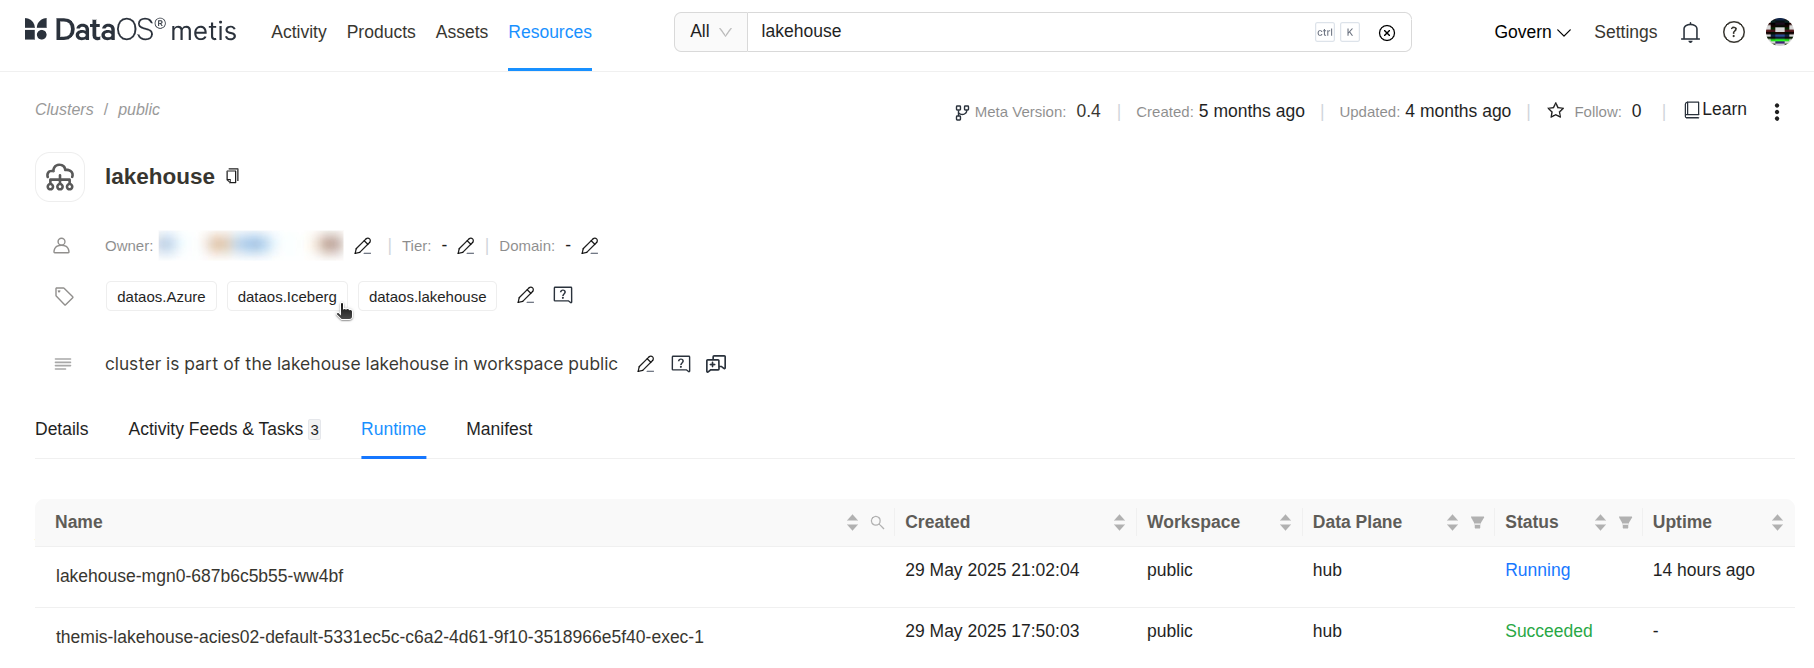
Cluster details in Metis
Operations App
To monitor the status and runtime of a Cluster on the Operations app, follow the steps below:
-
Open the Operations app.

Open the Operations App </div>-
Under the User space → type → Cluster, search for the Cluster that needs to be monitored.
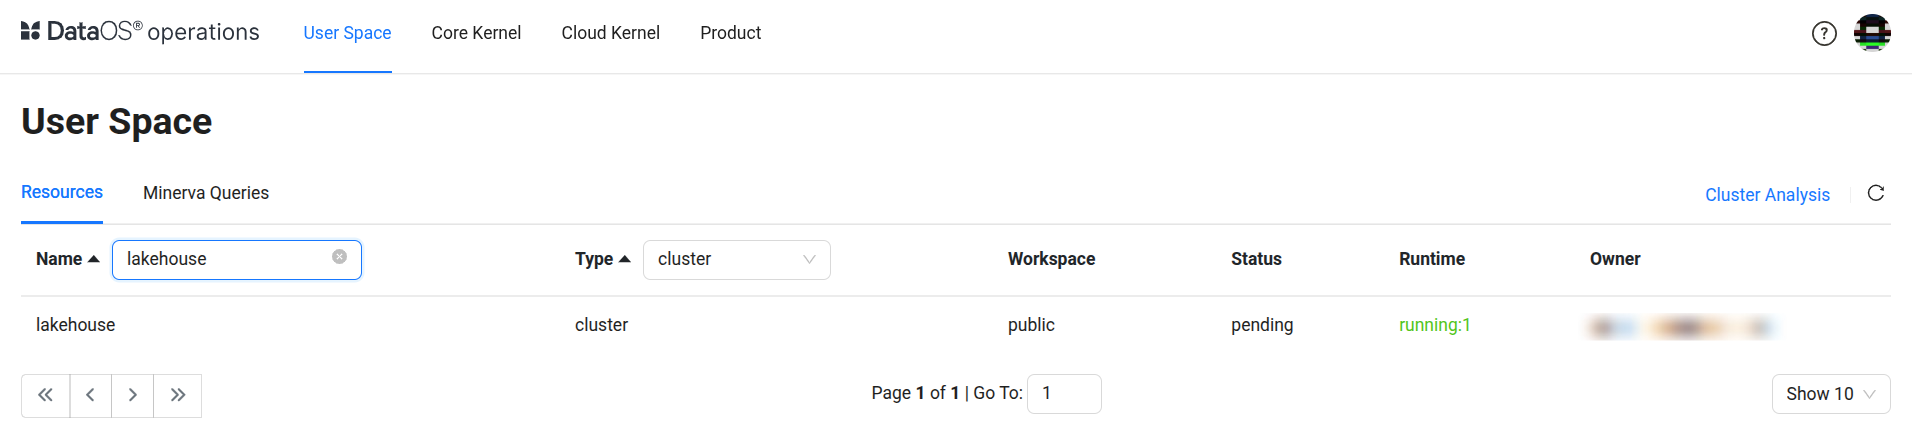
Operations > User Space > Cluster -
On clicking the Cluster, its detailed logs can also be monitored.
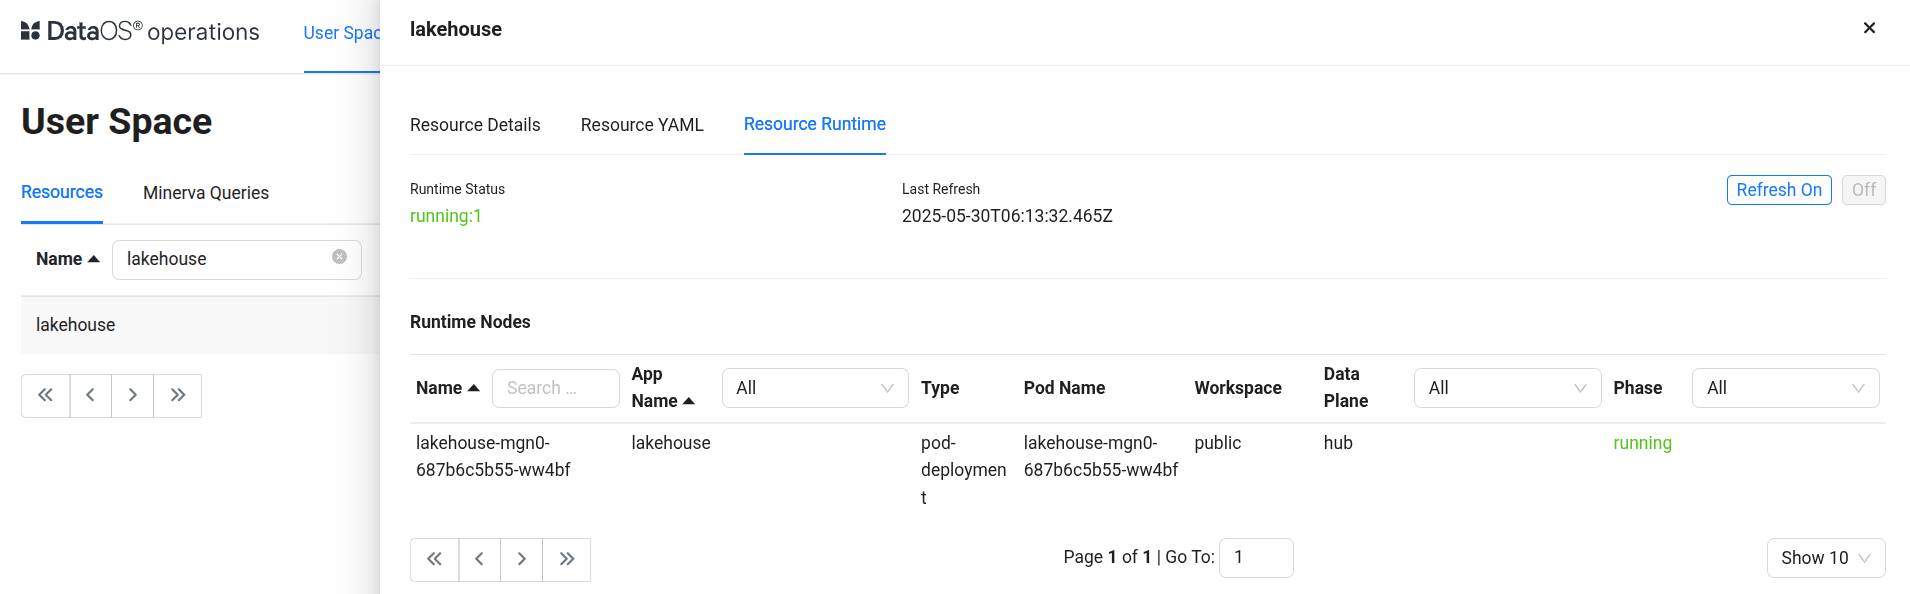
Cluster resource details in Operations
Status alerts
To proactively track critical state transitions, users can configure a Monitor and Pager to send alerts when the status of a Cluster changes to values like
errorordeleted. This enables teams to respond immediately to resource failures, misconfigurations, or unexpected deletions that may impact dependent components. Click here to view the steps to set up alerts for status changes.Runtime alerts
To proactively detect execution issues, users can configure a Monitor and Pager to send alerts when the runtime of a Cluster enters a failure state, such as
failedor remains stuck inpending. This ensures timely awareness of broken or stalled executions that may affect downstream processes. Click here to view the steps to set up alerts for runtime failures.. -
-