Monitor the CPU and Memory Usage of a Depot
When an object storage Depot Resource is created, a corresponding pod is automatically provisioned in the backend. Users can monitor the CPU and memory usage of this pod directly through the Metis Catalog, Operations app, or Grafana.
Metis UI
To monitor the CPU and memory usage of a Depot on the Metis Catalog UI, follow the steps below:
-
Open the Metis Catalog.

Open the Metis Catalog (Metis UI) -
Search for the Depot by name.
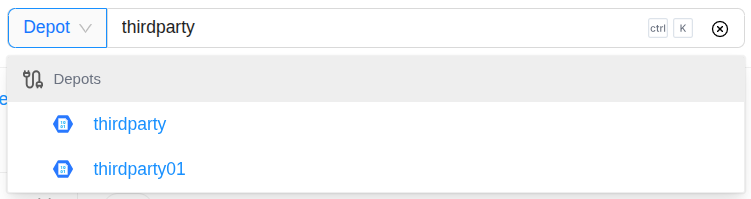
Search the Depot in Metis -
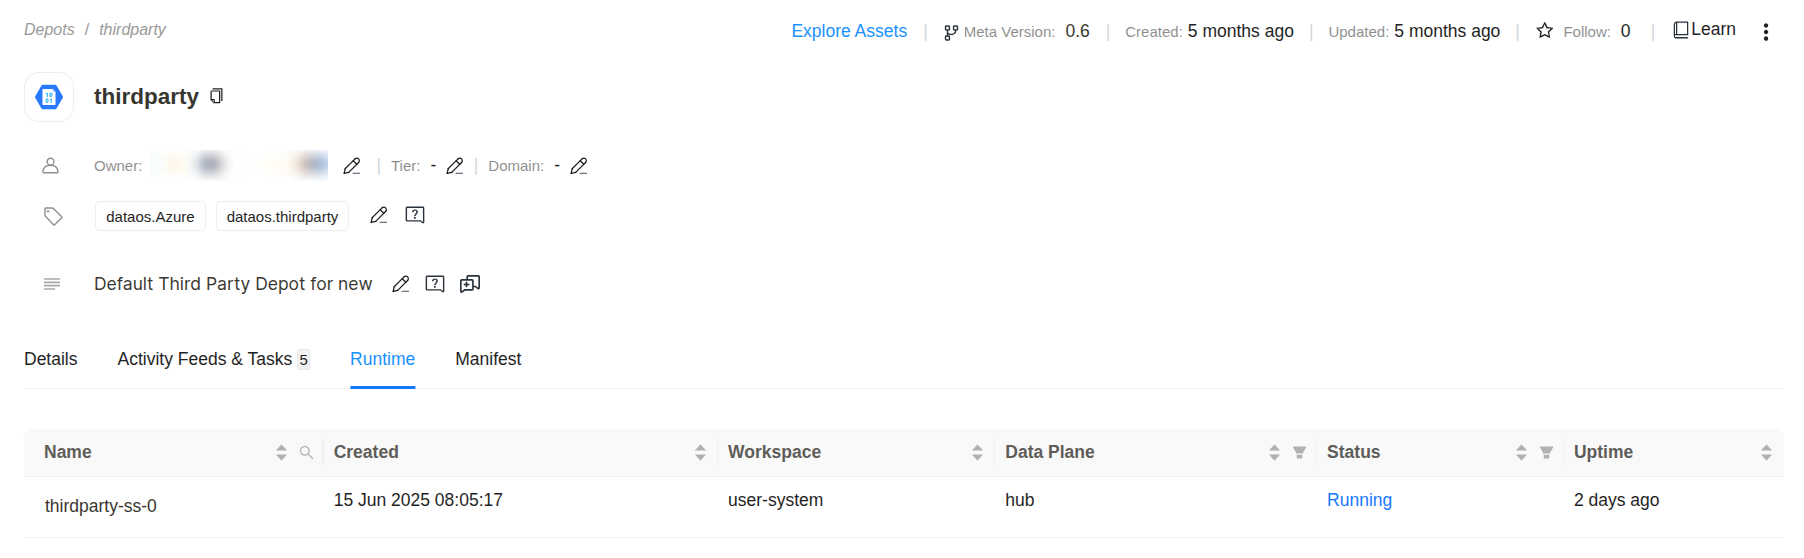
Click on the Depot that needs to be monitored and navigate to the ‘Runtime’ section.
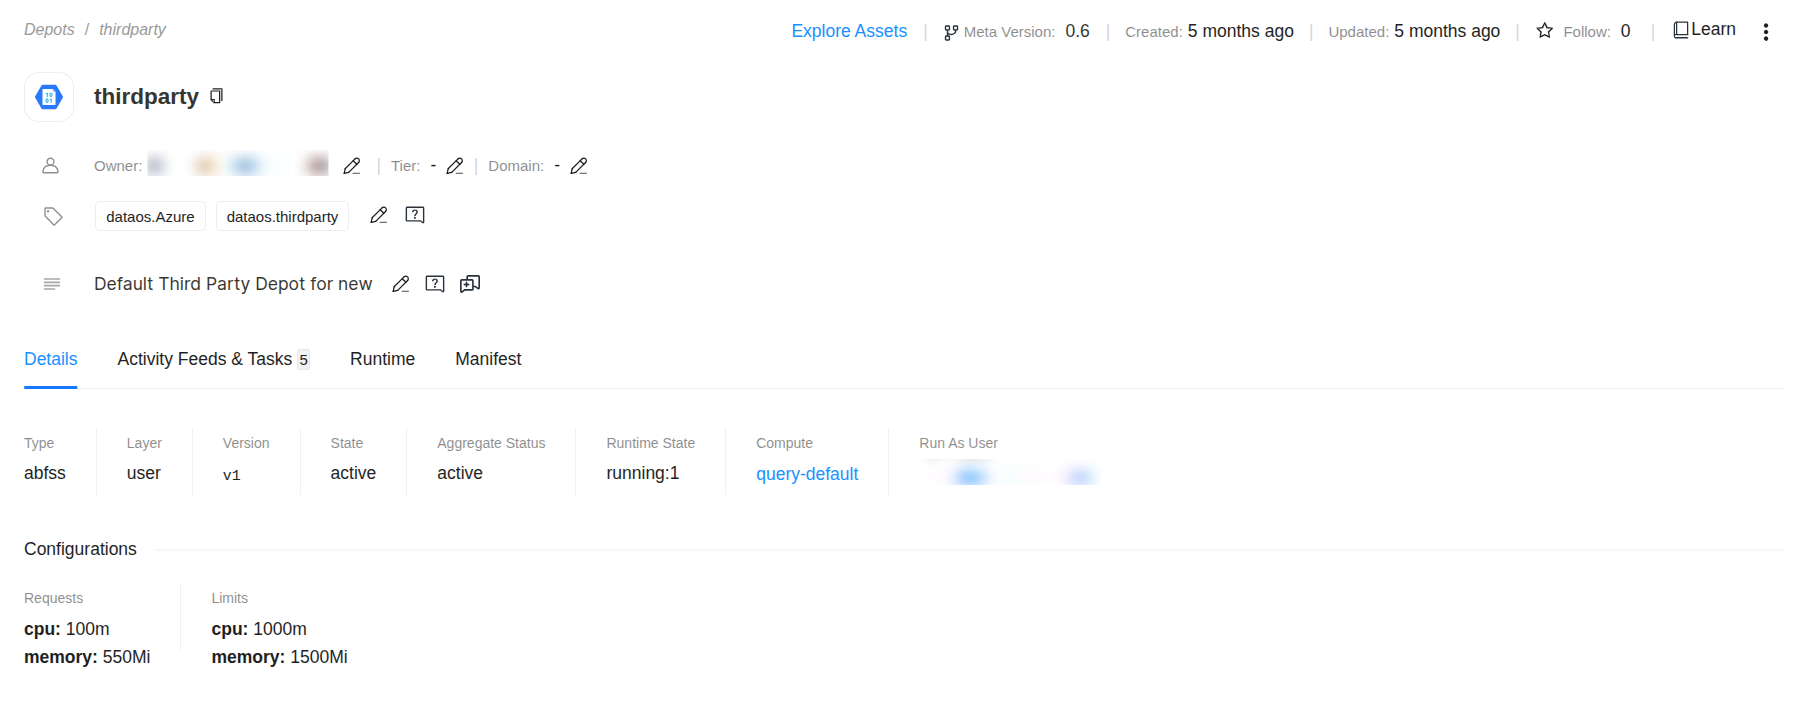
Depot details in Metis -
Click on the pod name for which you want to monitor the CPU and memory usage.
Open pod details in Metis -
Navigate to the ‘Pod Usage’ section.
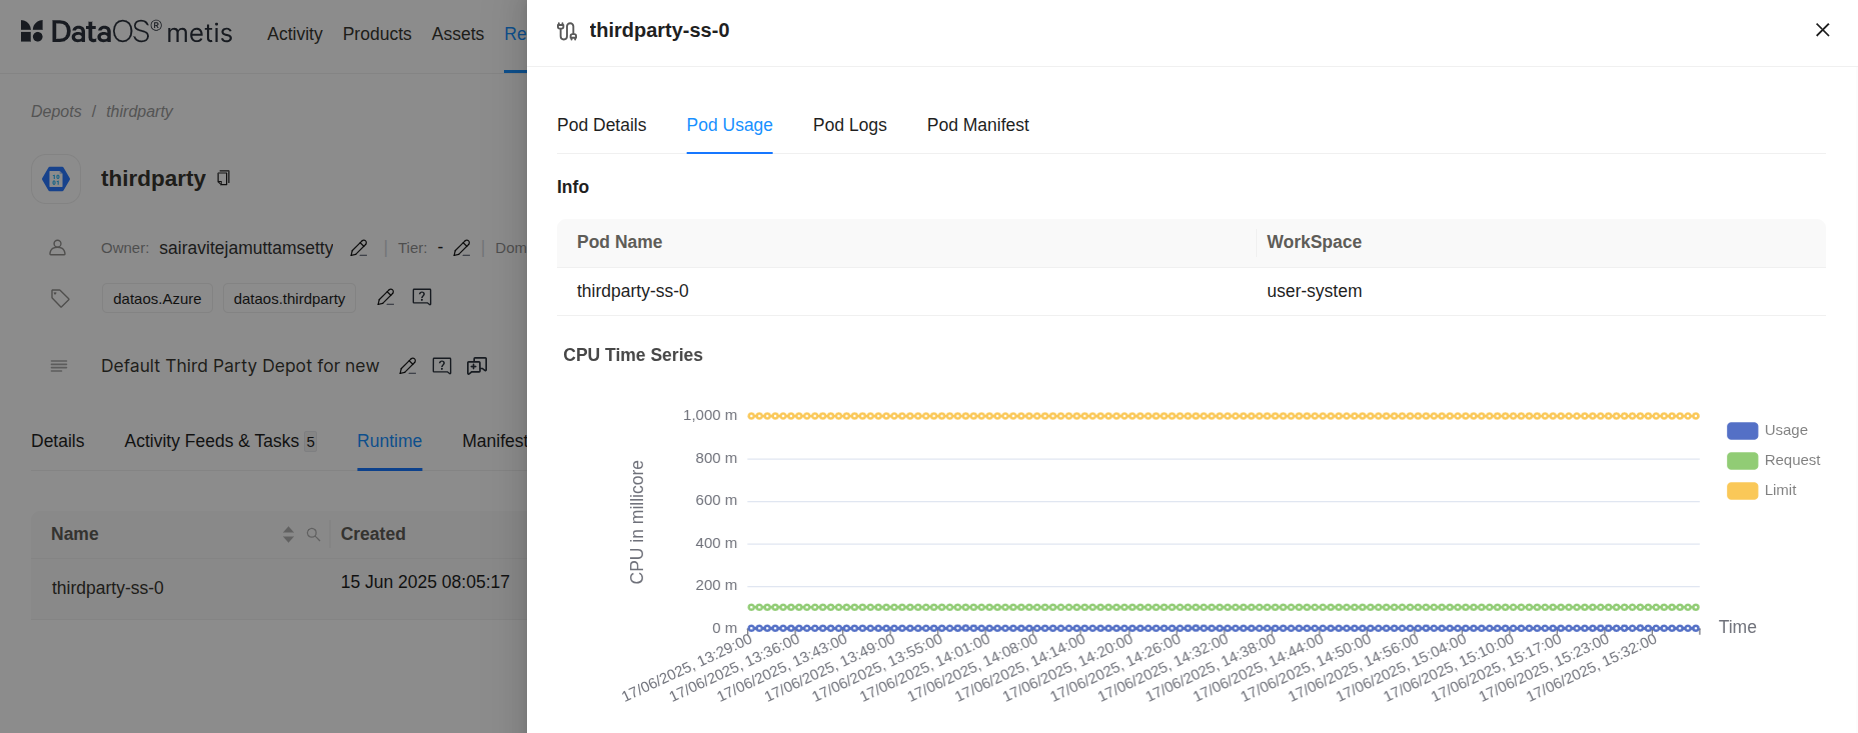
Pod Usage in Metis This graph illustrates the CPU usage trend (in millicores) for the pod
thirdparty-ss-0over a continuous time range.- Blue Line (Usage): Represents the actual CPU consumption by the pod. The values remain consistently below the green request line, indicating efficient and stable CPU usage without any spikes.
- Green Line (Request): Reflects the guaranteed minimum CPU resources allocated to the pod. This pod is guaranteed around 120 millicores, which it never exceeds based on the usage data.
- Yellow Line (Limit): Shows the maximum CPU limit assigned to the pod, set at 1000 millicores. The pod is permitted to use up to this threshold if needed, but the actual usage remains far below this cap.
The pod is running well within its allocated CPU boundaries. The significant gap between usage and request/limit suggests low CPU load. This may indicate an underutilized workload. No scaling or throttling concerns are present.
Pod memory usage vs request and limit This graph shows the memory usage pattern (in mebibytes) for the pod over time, helping to evaluate how efficiently memory resources are utilized.
- Blue Line (Usage): Indicates the actual memory being used by the pod, which remains stable around 330 MiB. This steady usage suggests consistent and predictable memory demands.
- Green Line (Request): Represents the guaranteed minimum memory allocated to the pod, set at 640 MiB. The actual usage stays well within this threshold, ensuring no risk of eviction or throttling due to memory pressure.
- Yellow Line (Limit): Denotes the upper cap of memory the pod is allowed to consume, set at 1500 MiB. This provides headroom for unexpected memory spikes, but no such behavior is observed here.
The pod’s memory consumption is well within both its request and limit values. This indicates the workload is memory-efficient and not close to saturation. Memory resources are adequately provisioned, possibly over-allocated depending on workload criticality.
Aggregated CPU and memory statistics This aggregate table summarizes the pod-level CPU and memory metrics collected over 120 time slices. It gives a statistical breakdown of resource usage relative to requests and limits.
CPU Metrics (millicore):
- Usage: The pod’s average CPU consumption was around 1.07 millicores, with a maximum peak of 2.25 millicores, far below its configured capacity.
- Request: The pod was allocated 100 millicores as its guaranteed minimum.
- Limit: The CPU cap was set to 1000 millicores (1 core), which was never approached.
Memory Metrics (mebibyte):
- Usage: The pod’s average memory usage hovered around 354 MiB, with a very narrow deviation across time slices, indicating highly stable consumption.
- Request: The minimum memory allocated was 550 MiB.
- Limit: The maximum allowed memory was set to 1500 MiB, providing sufficient overhead.
The pod is operating well within its resource envelope. CPU consumption is minimal compared to both the request and the limit, indicating efficient usage and possible over-provisioning. Memory usage is moderate and consistent, staying safely below the defined request and limit thresholds. This configuration ensures stability while maintaining headroom for spikes.
Operations App
When a Depot Resource is created, a corresponding pod is automatically provisioned in the backend. You can monitor the CPU and memory usage of this pod directly through the Operations app.
To monitor the CPU and memory usage of a Depot on the Operations app, follow the steps below:
-
Open the Operations app.

Open the Operations app -
Navigate to User Space → Resources → types, select the Depot as type, and search for the Depot that needs to be monitored.
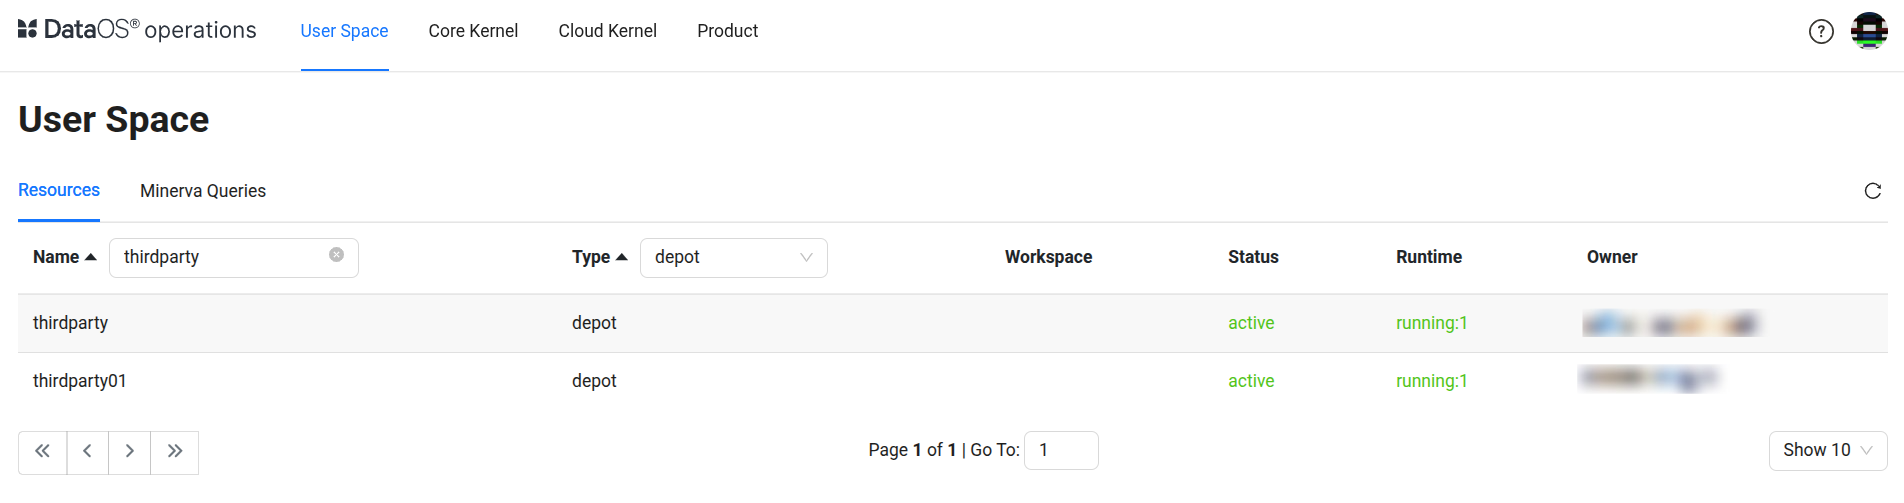
Operations > User Space > Resources -
Click on the Depot, navigate to the ‘Resource Runtime’ section.
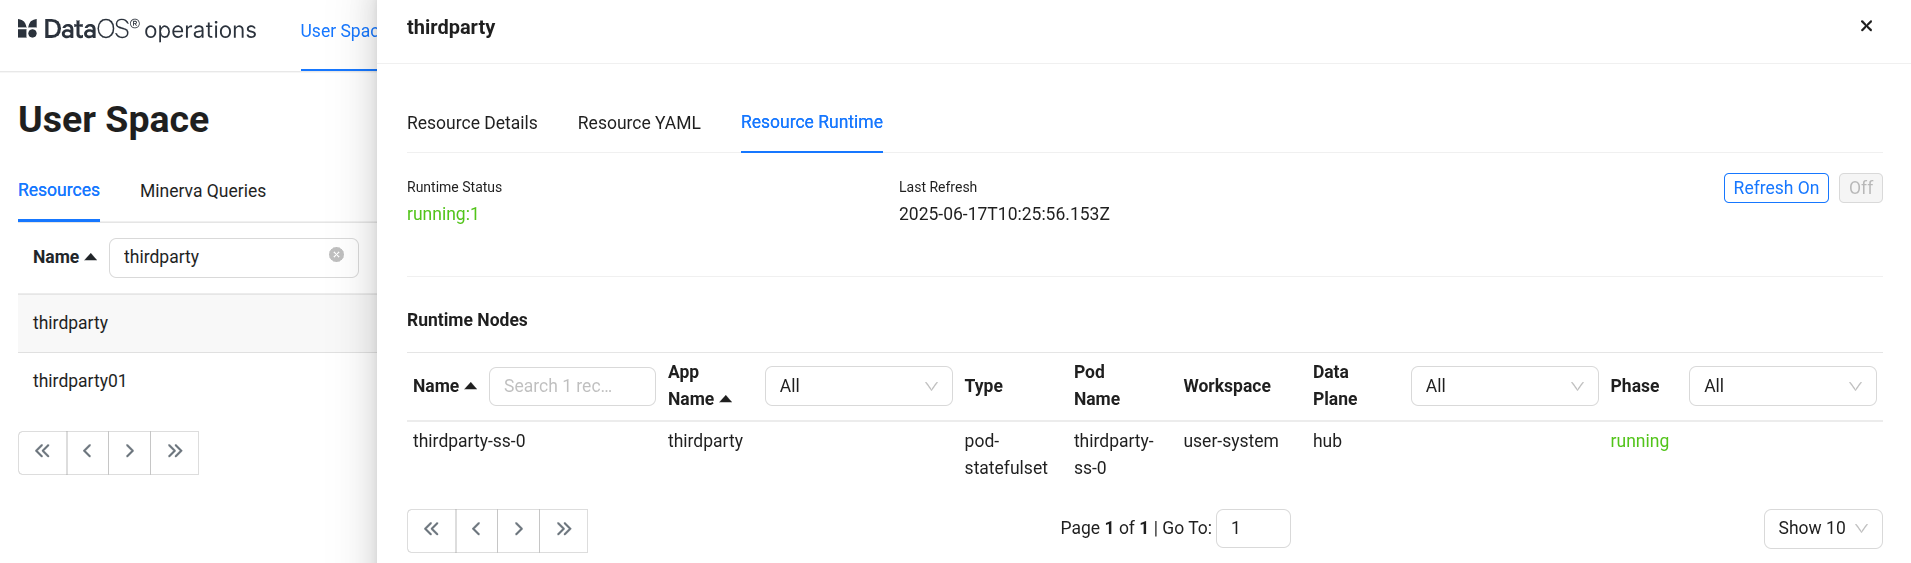
Depot resource runtime in Operations -
Click on the pod name for which you want to monitor the CPU and memory usage, and navigate to the ‘Runtime Node Usage’ section.
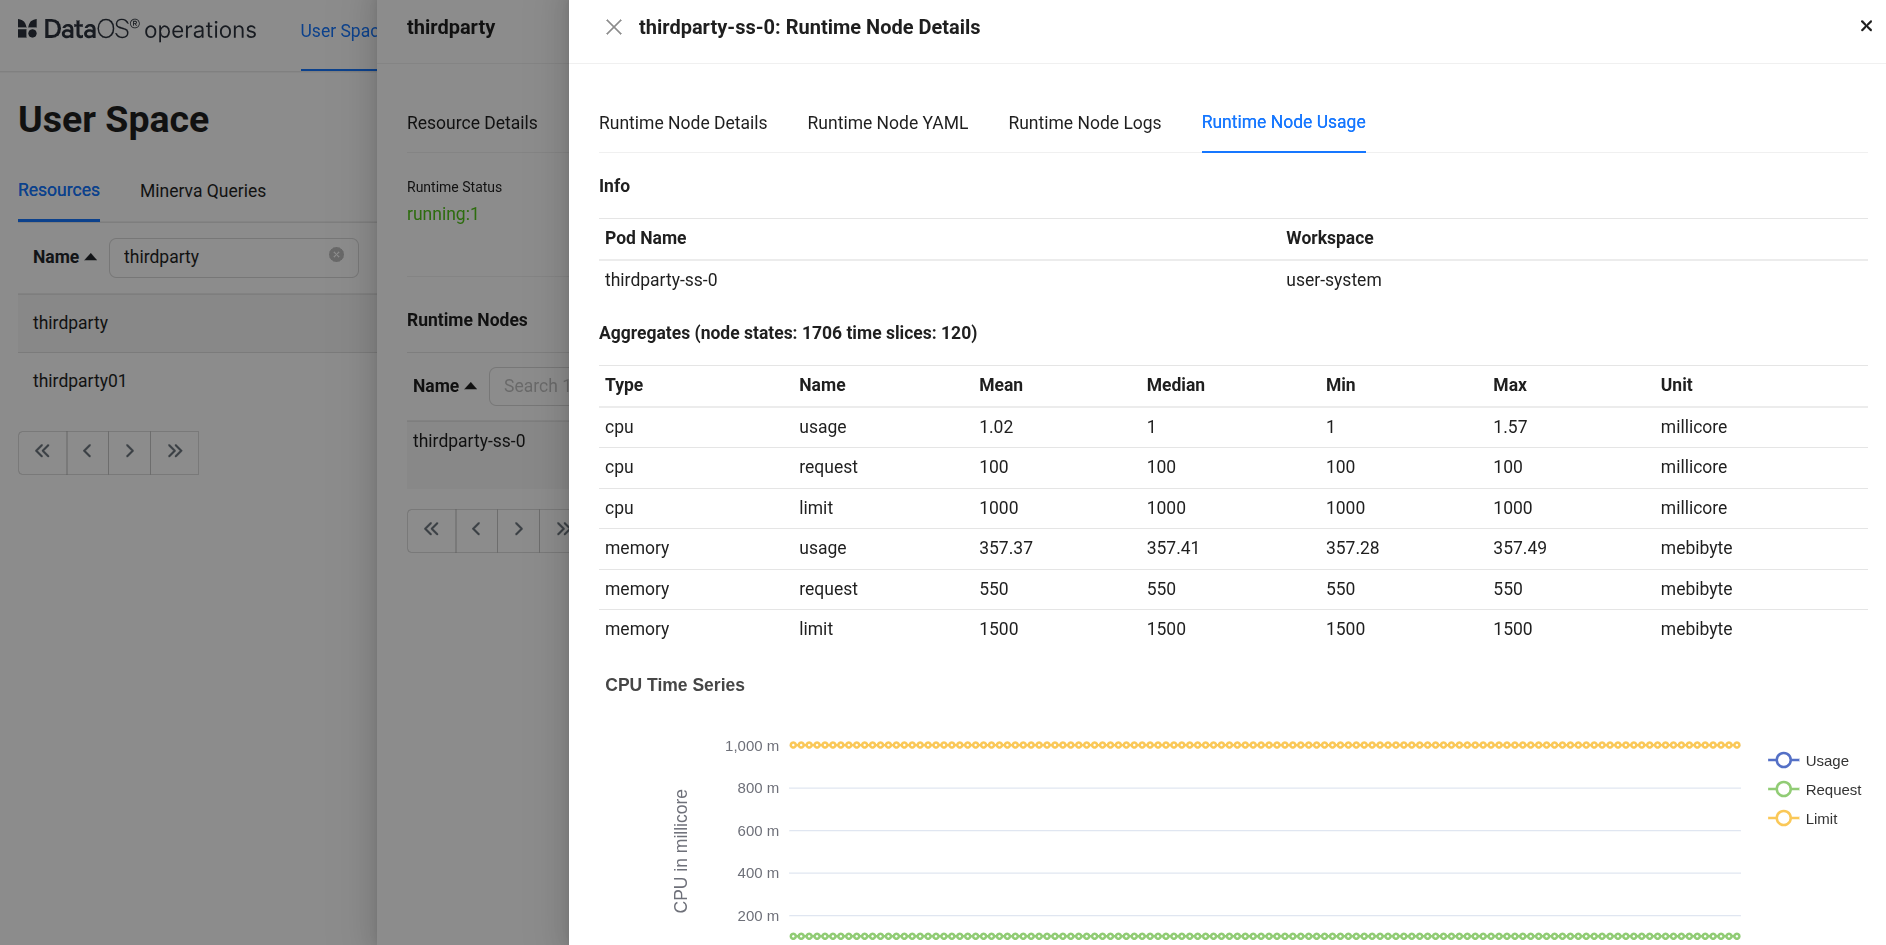
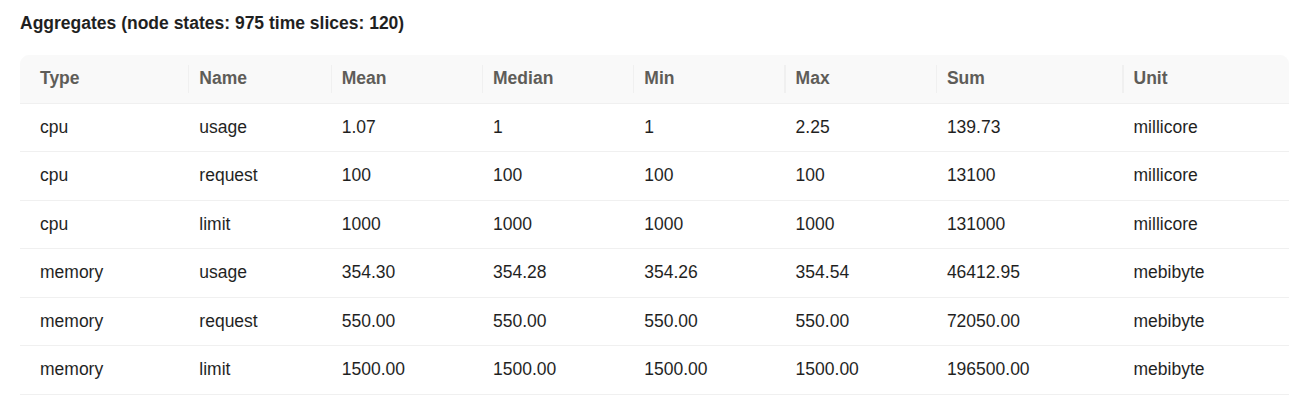
Runtime Node Usage details This aggregate table summarizes pod-level resource usage over 120 time slices with high stability and low variance.
CPU Metrics (millicore):
- Usage: The pod consumed on average 1.02 millicores, peaking at 1.57 millicores, which is extremely low relative to its limits.
- Request: The CPU request was 100 millicores, ensuring this is the baseline reserved capacity.
- Limit: The pod was allowed to consume up to 1000 millicores (1 core), which it never approached.
Memory Metrics (mebibyte):
- Usage: Average memory usage was 357.37 MiB, staying within a narrow range, indicating stable memory behavior.
- Request: The memory request was 550 MiB, comfortably above the observed usage.
- Limit: A memory cap of 1500 MiB was set, offering ample buffer.
This pod is operating with significant headroom. CPU utilization is consistently under 2% of the limit, and memory usage stays well within the request and limit thresholds. The uniformity across min, max, and median values reflects predictable, controlled behavior — ideal for critical workloads requiring resource stability.
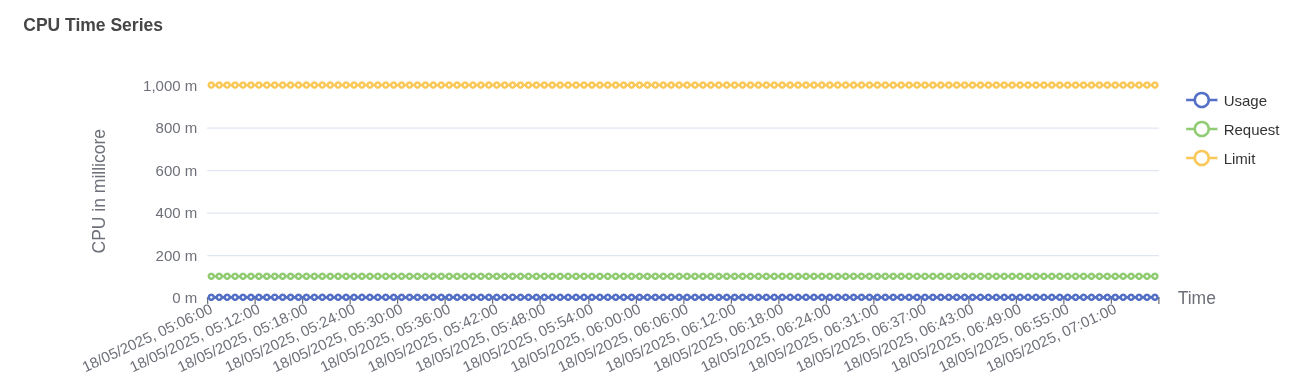
Pod memory usage over time This graph represents CPU usage over time for the pod
thirdparty-ss-0.- Blue Line (Usage): CPU usage consistently hovers around
1 millicore, which indicates extremely low compute consumption during the observed period. - Green Line (Request): The requested CPU is
100 millicores. This is the guaranteed allocation made for the pod. - Orange Line (Limit): The CPU limit is set at
1000 millicores(1 core), indicating the maximum CPU this pod can consume.
The pod is using just 1% of its requested CPU and 0.1% of its defined limit, suggesting over-provisioning.
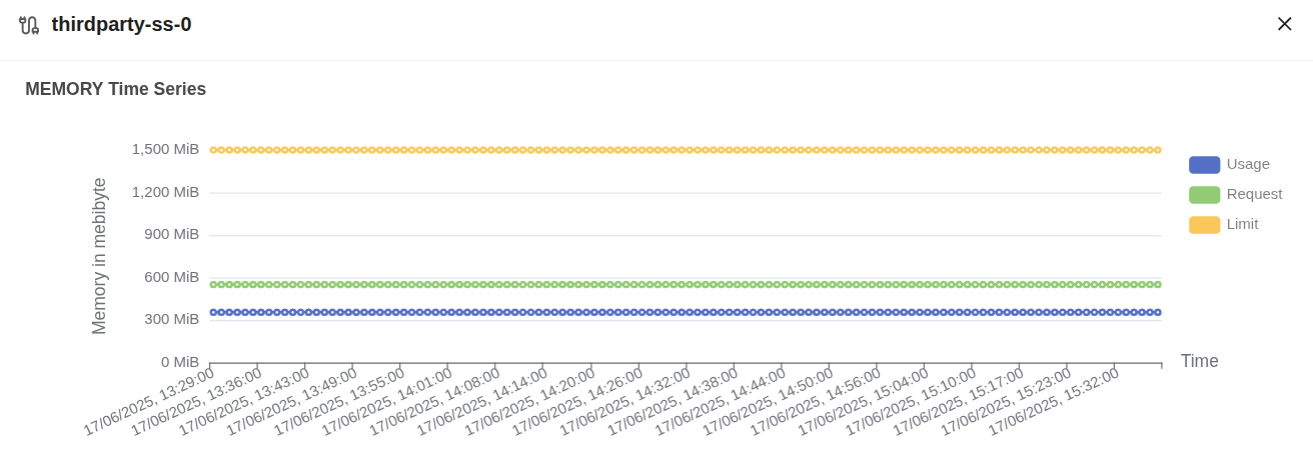
caption This graph represents memory usage over time for the pod
thirdparty-ss-0.- Blue Line (Usage): Memory usage remains around
354 MiB. - Green Line (Request): The pod has a guaranteed memory allocation of
550 MiB. - Orange Line (Limit): The pod is allowed to consume up to
1500 MiB.
The pod consumes ~64% of its memory request and only ~23% of its limit, showing moderate memory utilization.
Grafana
When a Depot Resource is created, a corresponding pod is automatically provisioned in the back-end. You can monitor the CPU and memory usage of this pod directly through the Grafana app.
To monitor the CPU and memory usage of a Depot on the Grafana app, follow the steps below:
-
Execute the following command in DataOS CLI to get the pod name corresponding to the Depot Resource.
Example usage:
dataos-ctl log -t depot -n thirdparty INFO[0000] 📃 log(public)... INFO[0001] 📃 log(public)...complete NODE NAME │ CONTAINER NAME │ ERROR ──────────────────┼────────────────┼──────── thirdparty-ss-0 │ thirdparty │ # ^ pod name -------------------LOGS------------------- 15-06-2025 02:35:33 [INFO] Configuring... 15-06-2025 02:35:33 [INFO] Configuring... 15-06-2025 02:35:33 [INFO] Starting Hive Metastore service. Command: /opt/hive-metastore/bin/start-metastore SLF4J: Class path contains multiple SLF4J bindings. SLF4J: Found binding in [jar:file:/opt/apache-hive-metastore-3.1.3-bin/lib/log4j-slf4j-impl-2.17.1.jar!/org/slf4j/impl/StaticLoggerBinder.class] SLF4J: Found binding in [jar:file:/opt/hadoop-3.3.4/share/hadoop/common/lib/slf4j-reload4j-1.7.36.jar!/org/slf4j/impl/StaticLoggerBinder.class] SLF4J: See http://www.slf4j.org/codes.html#multiple_bindings for an explanation. SLF4J: Actual binding is of type [org.apache.logging.slf4j.Log4jLoggerFactory] 2025-06-15 02:35:36: Starting Metastore Server SLF4J: Class path contains multiple SLF4J bindings. SLF4J: Found binding in [jar:file:/opt/apache-hive-metastore-3.1.3-bin/lib/log4j-slf4j-impl-2.17.1.jar!/org/slf4j/impl/StaticLoggerBinder.class] SLF4J: Found binding in [jar:file:/opt/hadoop-3.3.4/share/hadoop/common/lib/slf4j-reload4j-1.7.36.jar!/org/slf4j/impl/StaticLoggerBinder.class] SLF4J: See http://www.slf4j.org/codes.html#multiple_bindings for an explanation. SLF4J: Actual binding is of type [org.apache.logging.slf4j.Log4jLoggerFactory] -
Open the Grafana app.
Open the Grafana app -
Navigate to the Explore section and select ‘Thanos’ as a source and search for the metric
cpu_container_usage_total, and in the label filters select pod and paste the pod name which we have gotten from step 1, then click on ‘Run Query’.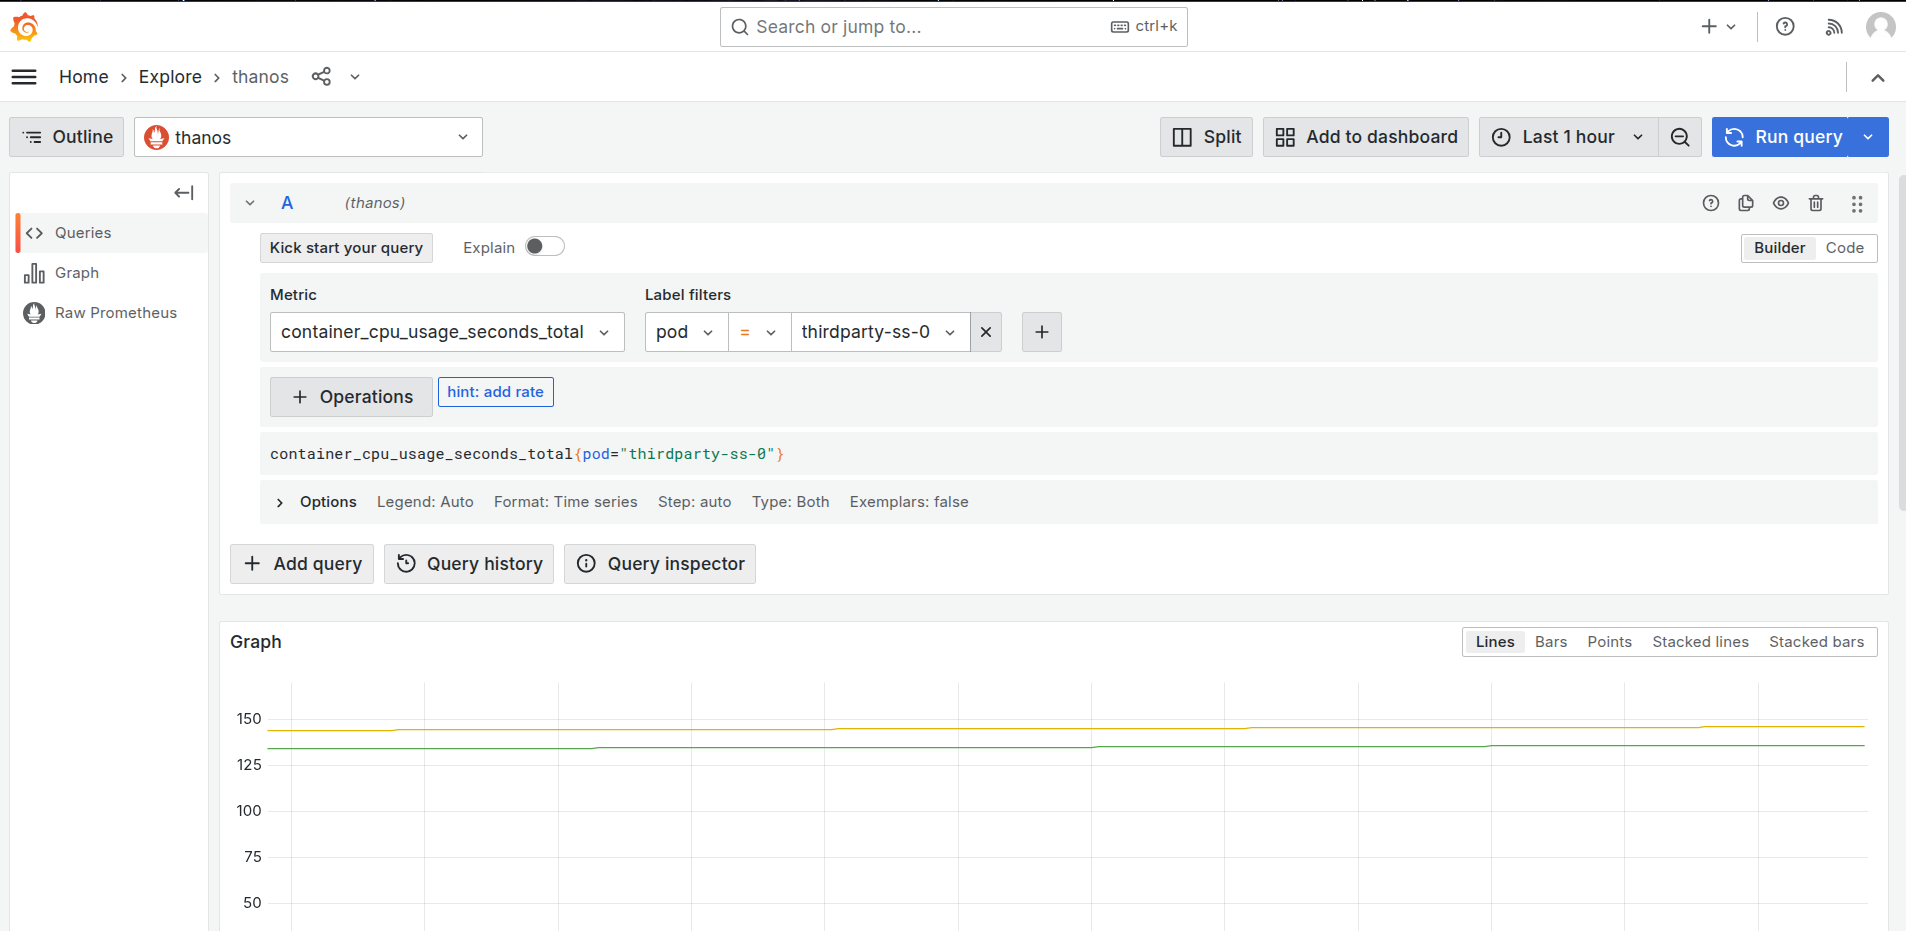
Grafana Explore: CPU usage query -
After clicking on the ‘Run Query’, you can find the usage of CPU by the Depot.

CPU usage by container over time This graph visualizes the cumulative CPU usage (in seconds) for multiple containers within a single pod linked to the
thirdpartyresource in thedataos-training.dataos.appenvironment.- Green Line: This represents the main container named
thirdparty. Its cumulative CPU usage reaches approximately 135.90 seconds, showing moderate and stable resource consumption over the observed time window. - Yellow Line: This denotes another container (init container) within the same pod. It shows slightly higher CPU consumption (~145.97 seconds), which suggests either a more active or prolonged process during the same period.
- Blue Line: This line reflects minimal usage (~0.025 seconds), indicating either another init container that completes early in the pod’s lifecycle.
All containers are part of the same pod instance (
kubepods-burstable.slicegroup), but their roles differ, leading to the observed variation in CPU usage. - Green Line: This represents the main container named
-
To monitor the memory usage, select the
container_memory_working_set_bytesin the query explorer and select the pod name as the label filter of the corresponding Depot, and run the query.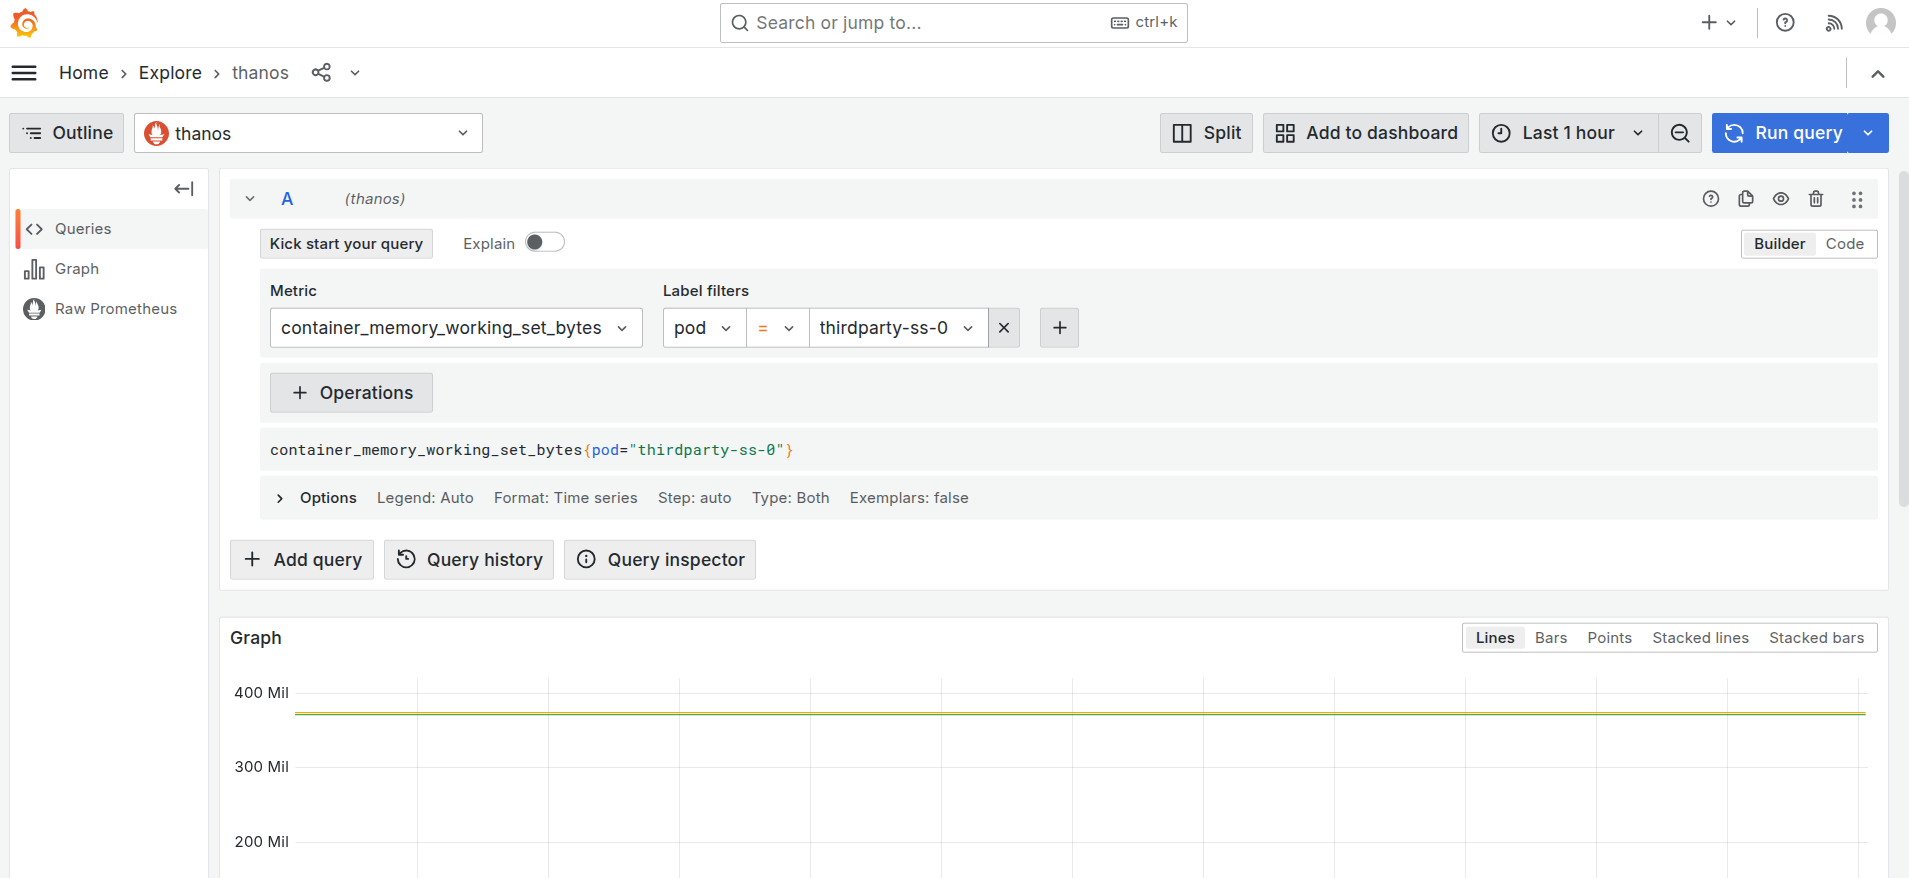
Grafana Explore: memory working set query -
On executing the query, you can see the memory used by the pod in the last hour.
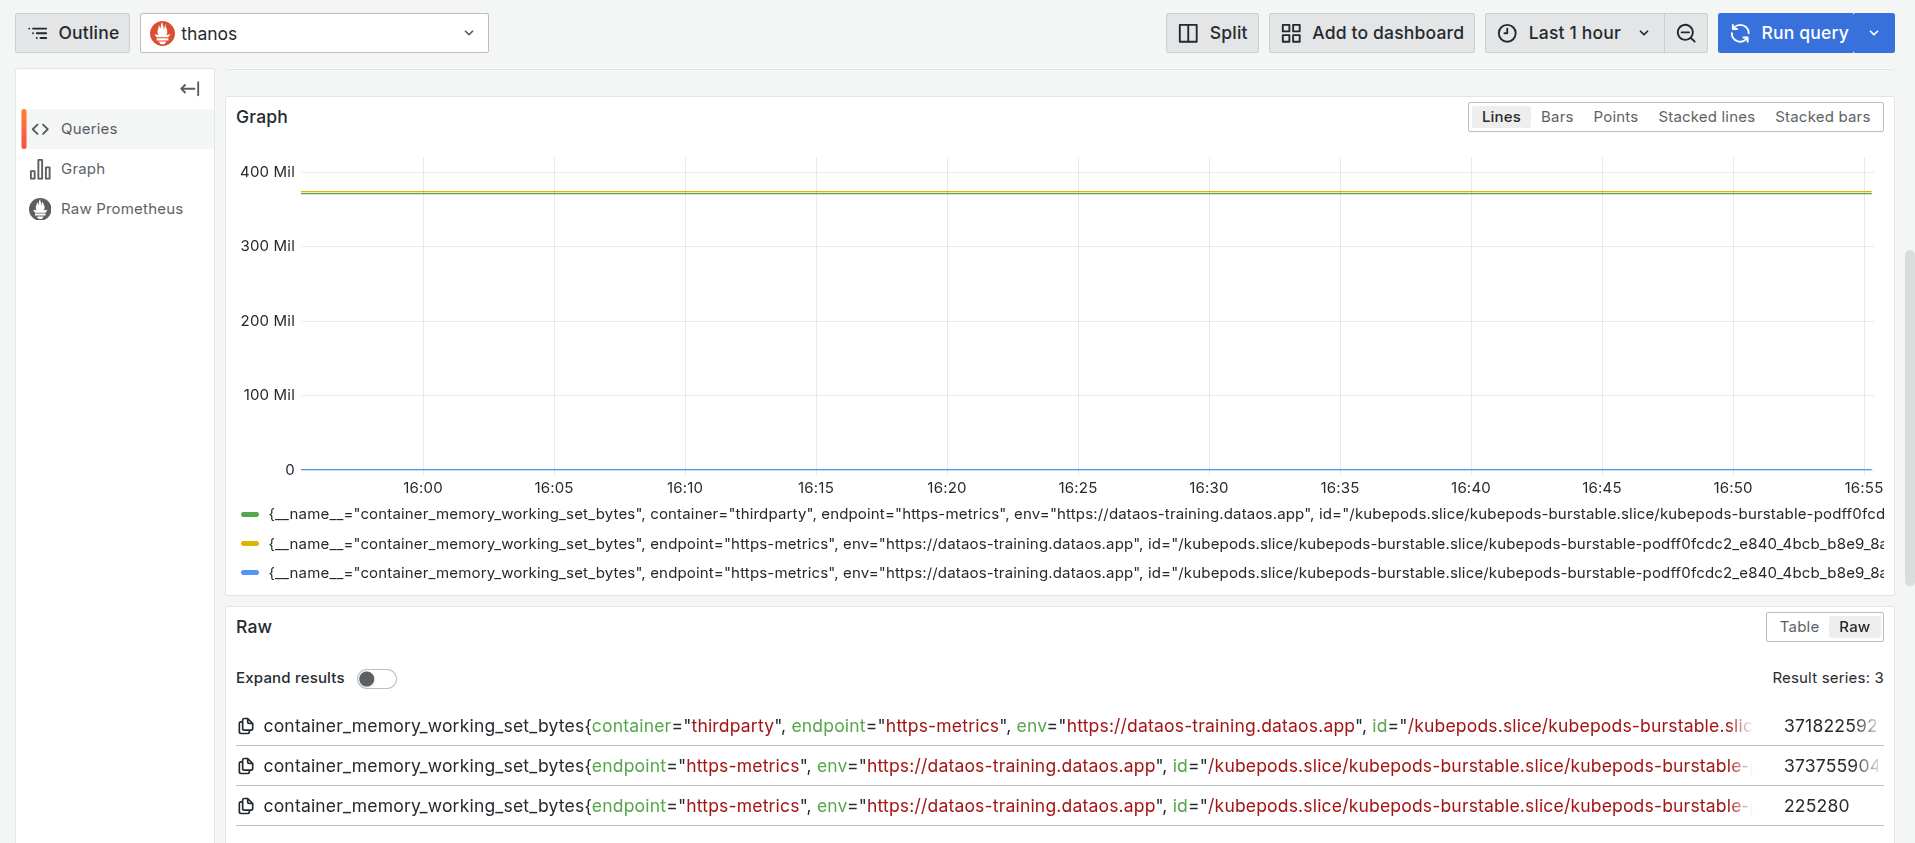
Memory usage by container over time This graph shows the memory usage (in bytes) for different containers inside a single pod associated with the
thirdpartyDepot.- Green Line: Represents the main container named
thirdparty. It maintains a consistent memory usage of around 371.82 MiB, indicating steady consumption throughout the monitored window. - Yellow Line: Corresponds to another container in the same pod. Its usage (~373.76 MiB) is slightly higher than the main container, possibly due to extended background processing or support tasks.
- Blue Line: Represents a third container with minimal memory usage (~225.28 KiB), which is significantly lower than the others.
All three series originate from containers within the same pod (
kubepods-burstableslice). - Green Line: Represents the main container named
-
You can further select the time range at which you want to see the CPU and memory usage.
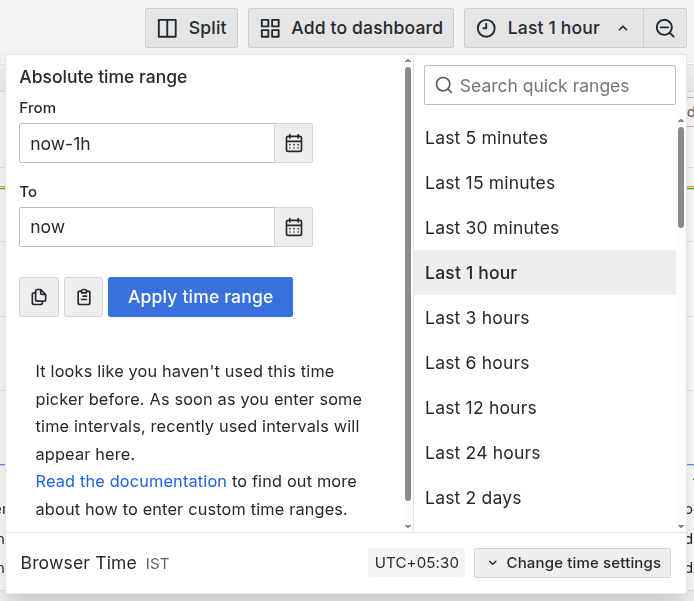
Adjust the time range in Grafana
CPU alerts
To automatically track the CPU usage, users can configure a Monitor and a Pager to send alerts when the CPU usage exceeds certain limits. This enables teams to respond immediately to resource failures that may impact dependent components. Click here to view the steps to set up alerts for CPU usage.
Memory alerts
To automatically track the memory usage, users can configure a Monitor and a Pager to send alerts when the memory usage exceeds certain limits. This enables teams to respond immediately to resource failures that may impact dependent components. Click here to view the steps to set up alerts for memory usage.