Optimizing Lakehouse usage using System level Data Product
This topic explores how to leverage Lakehouse Insights to identify and resolve inefficiencies in data lake storage and performance. You'll learn how to optimize query response times, reduce storage costs, and streamline data operations using system level Data Product with actionable insights.
📘 Scenario
After mastering credential security and establishing reliable data source connections, you now face a new challenge: inefficiencies in your data lake, including slow query responses and rising storage costs. To tackle these issues, you turn to Lakehouse Insights, a system-level data product designed to optimize data lake performance by identifying and addressing inefficiencies in Lakehouse storage.
Overview of Lakehouse Insights
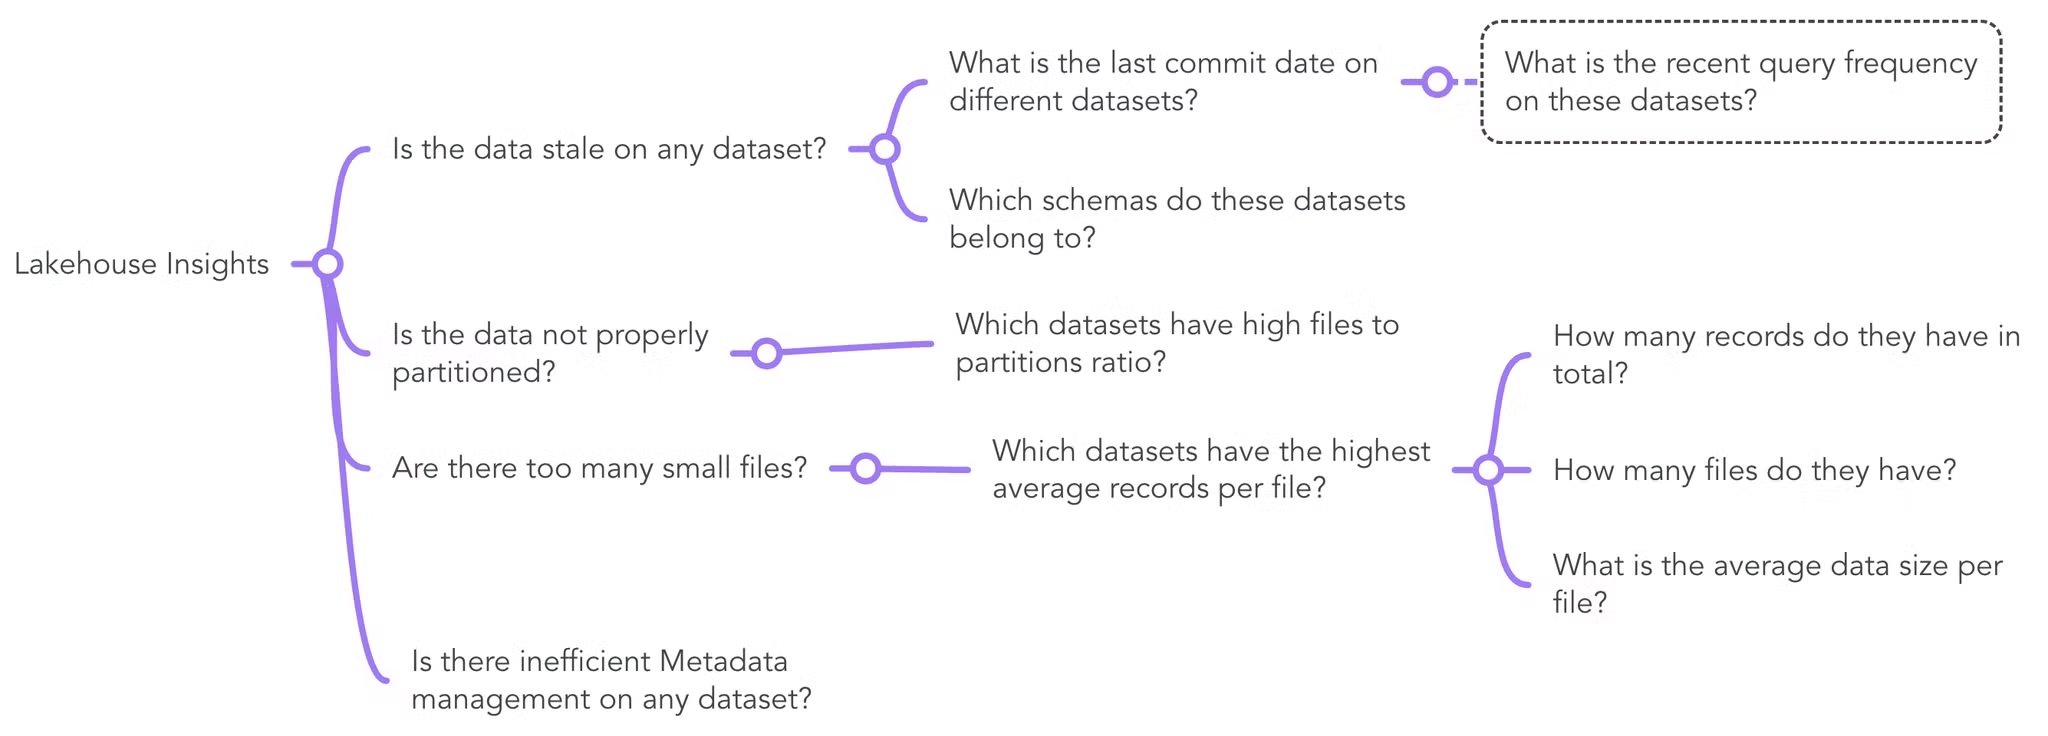
Lakehouse Insights is a system-level data product within DataOS that helps DataOS Operator or Platform Administrator to:
- Identify inefficiencies in metadata management.
- Optimize data storage and partitioning strategies.
-
Improve overall query performance.
Benefits
- Enhanced query response times.
- Reduced operational costs through better storage and compute optimization.
- Improved resource allocation and partitioning strategies for seamless data operations.
Accessing Lakehouse Insights Data Product
-
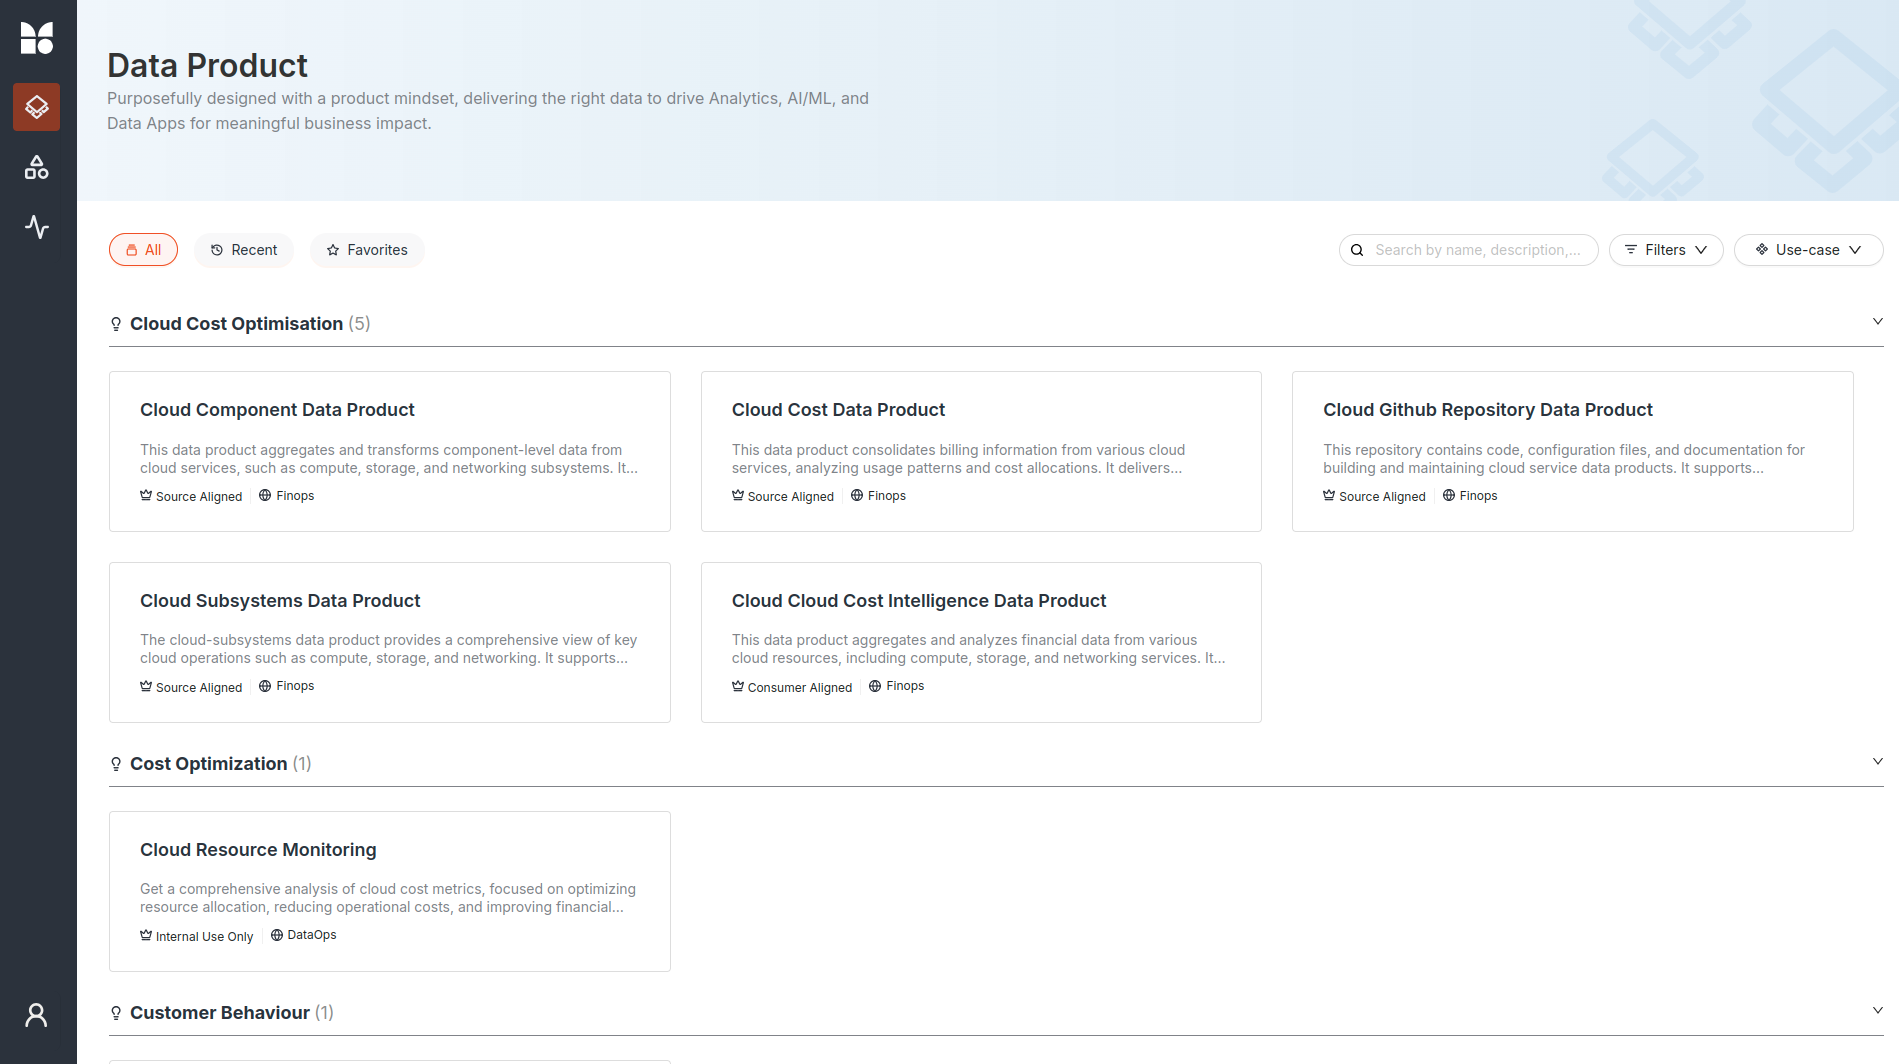
Navigate to the Data Product Hub:
- Log in to the DataOS Graphical User Interface and go to the Data Product Hub.
-
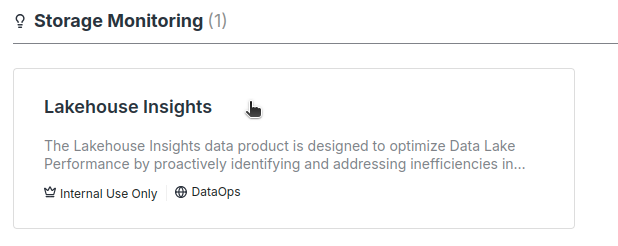
Find the ‘Lakehouse Insights’ Data Product:
- Locate the Lakehouse Insights Data Product within the Data Product Hub.
-
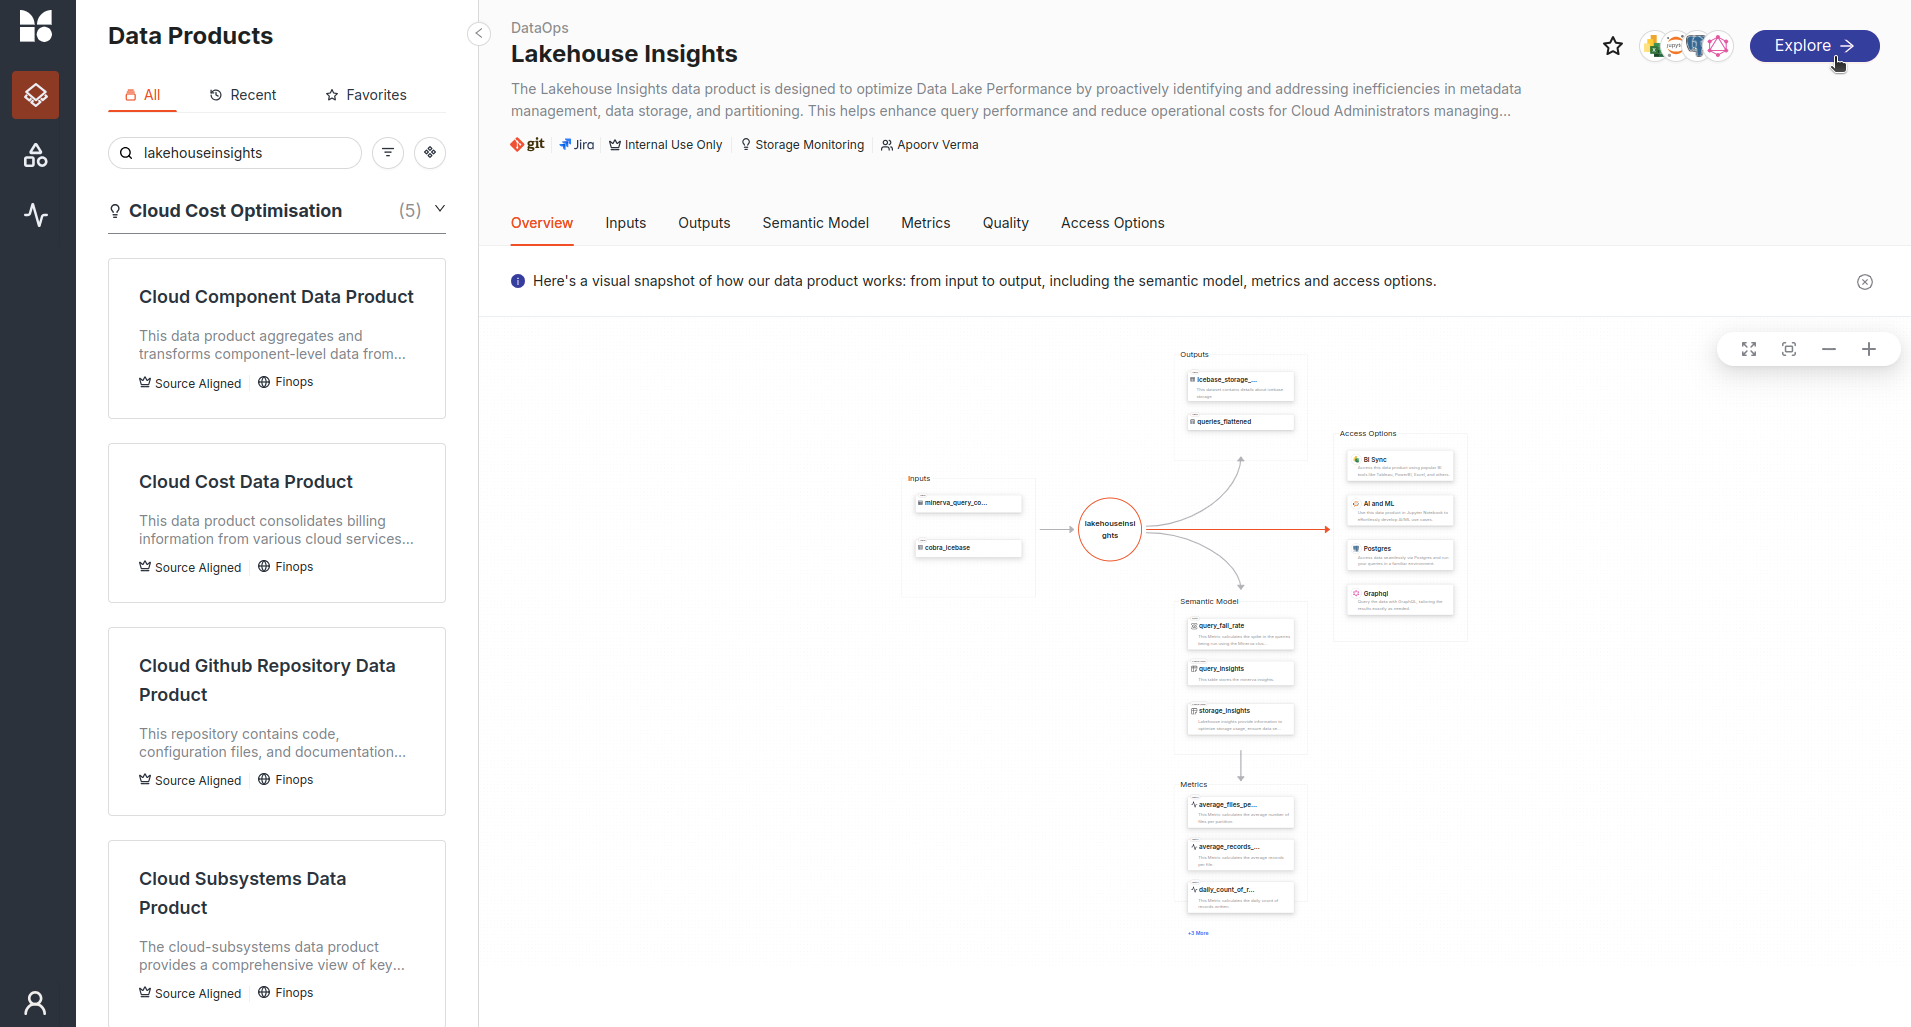
Explore insights:
- Open the ‘Explore’ tab on the Lakehouse Insights details page.
-
Execute queries:
- Use the Data Product Explore interface to run queries and uncover actionable insights.
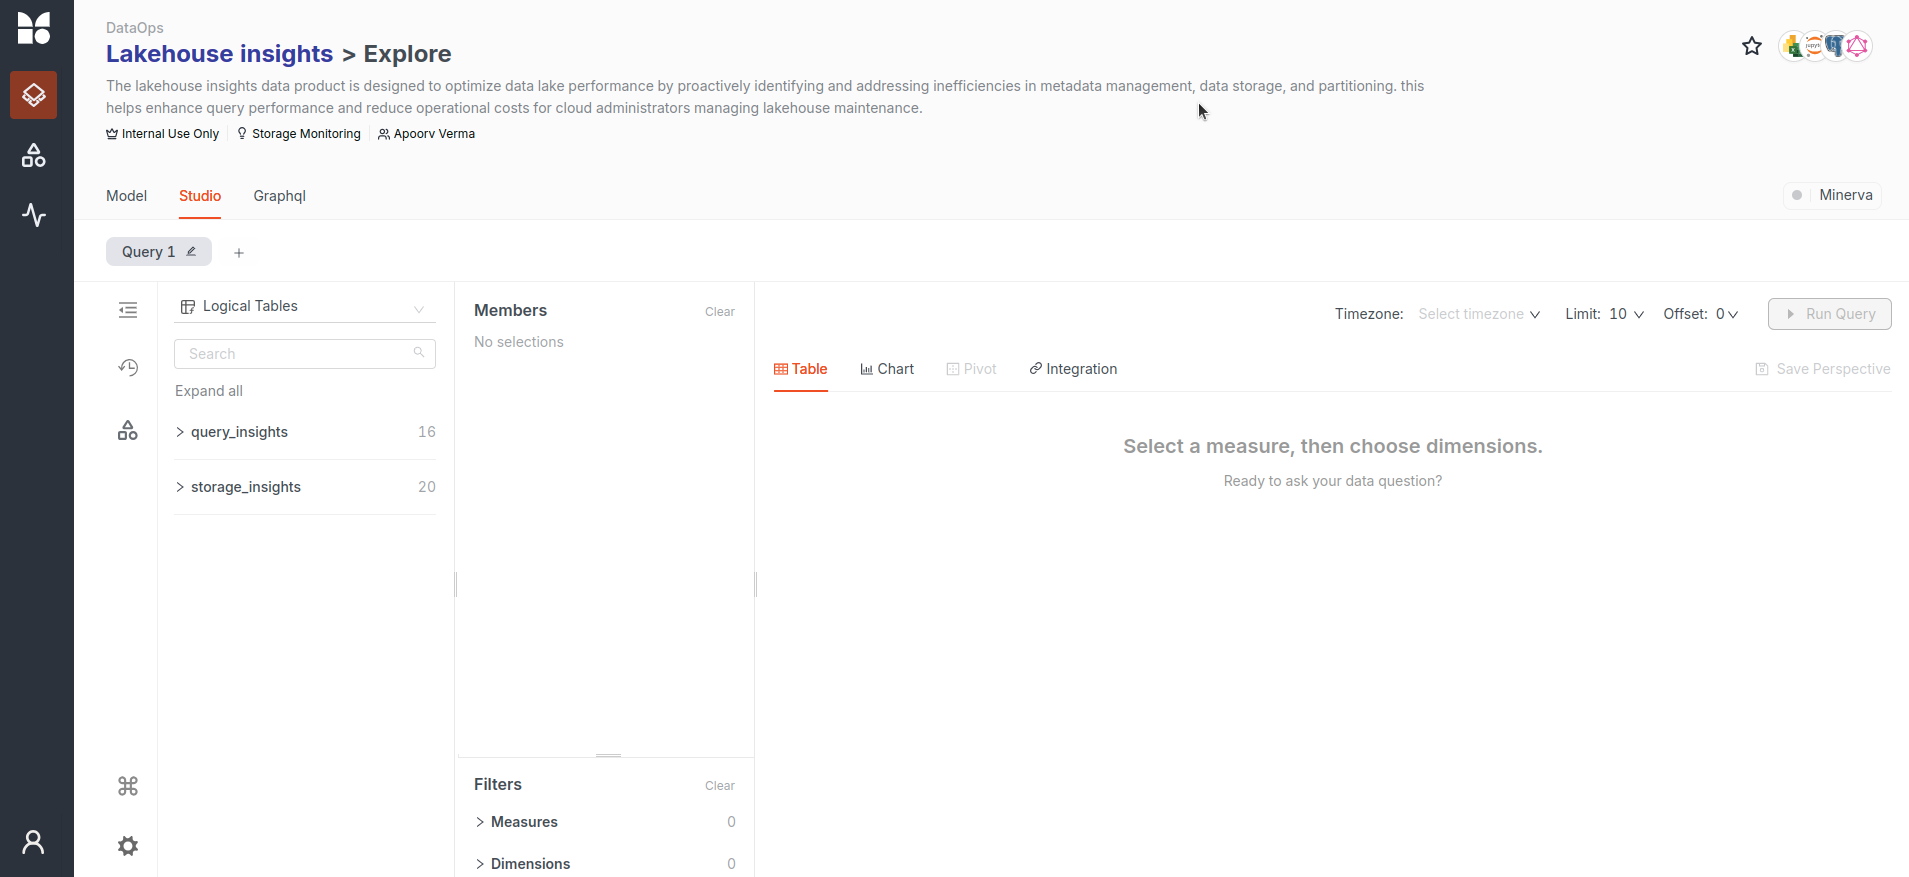
Key findings and recommended actions
Scenario 1: Too many small files
Insight:
Datasets with an excessive number of small files create inefficiencies in querying due to higher metadata overhead and runtime file open costs.
Sample query:
Use the Data Product Hub Explore tab to analyze file size and count. He selects dimensions such as file_count and average_file_size to identify datasets with small file issues.
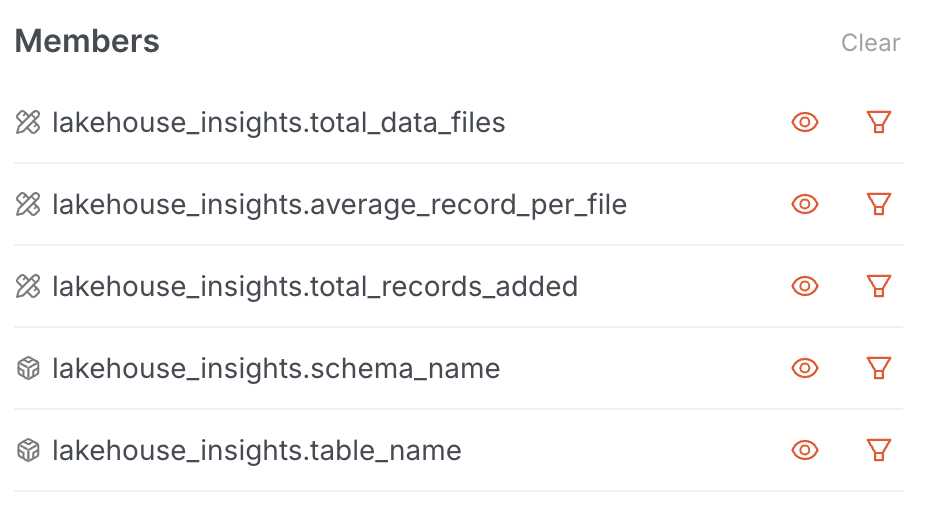
Action:
- Use the
rewrite_datasetFlare action to compact small files into larger ones.
Steps:
- Identify datasets with a high file count using the sample query.
- Run the
rewrite_datasetFlare action to combine small files and improve performance.
Scenario 2: Improper partitioning
Insight:
Datasets with misaligned partitions—where the write cadence differs from the query cadence—cause slower execution and greater resource consumption.
Sample Query:
Use the Data Product Hub Explore Tab to assess partition alignment by comparing file_count and partition_count.
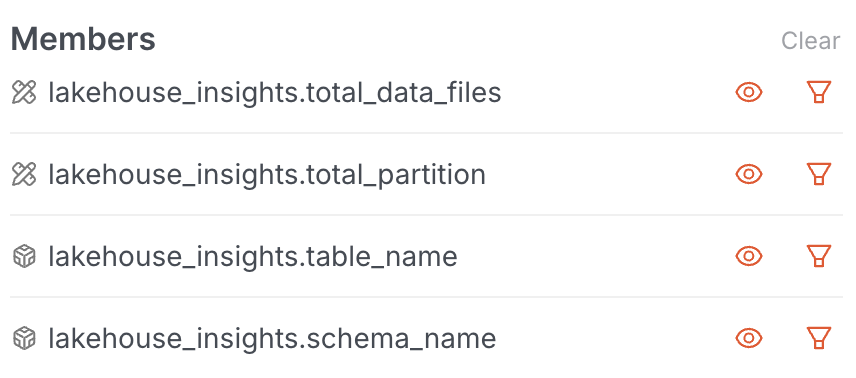
Action:
- Use the
repartitionFlare action to redistribute files evenly across partitions.
Steps:
- Identify datasets with partition misalignment using the sample query.
- Run the
repartitionFlare action to balance partitions for efficient querying.
Sample queries
1. Data growth and storage utilization
- Which tables have the highest total records added recently?
- Measures:
total_records_added - Dimensions:
table_name -
Filters: Use
commit_timestampto focus on recent activity, such as the last week or month.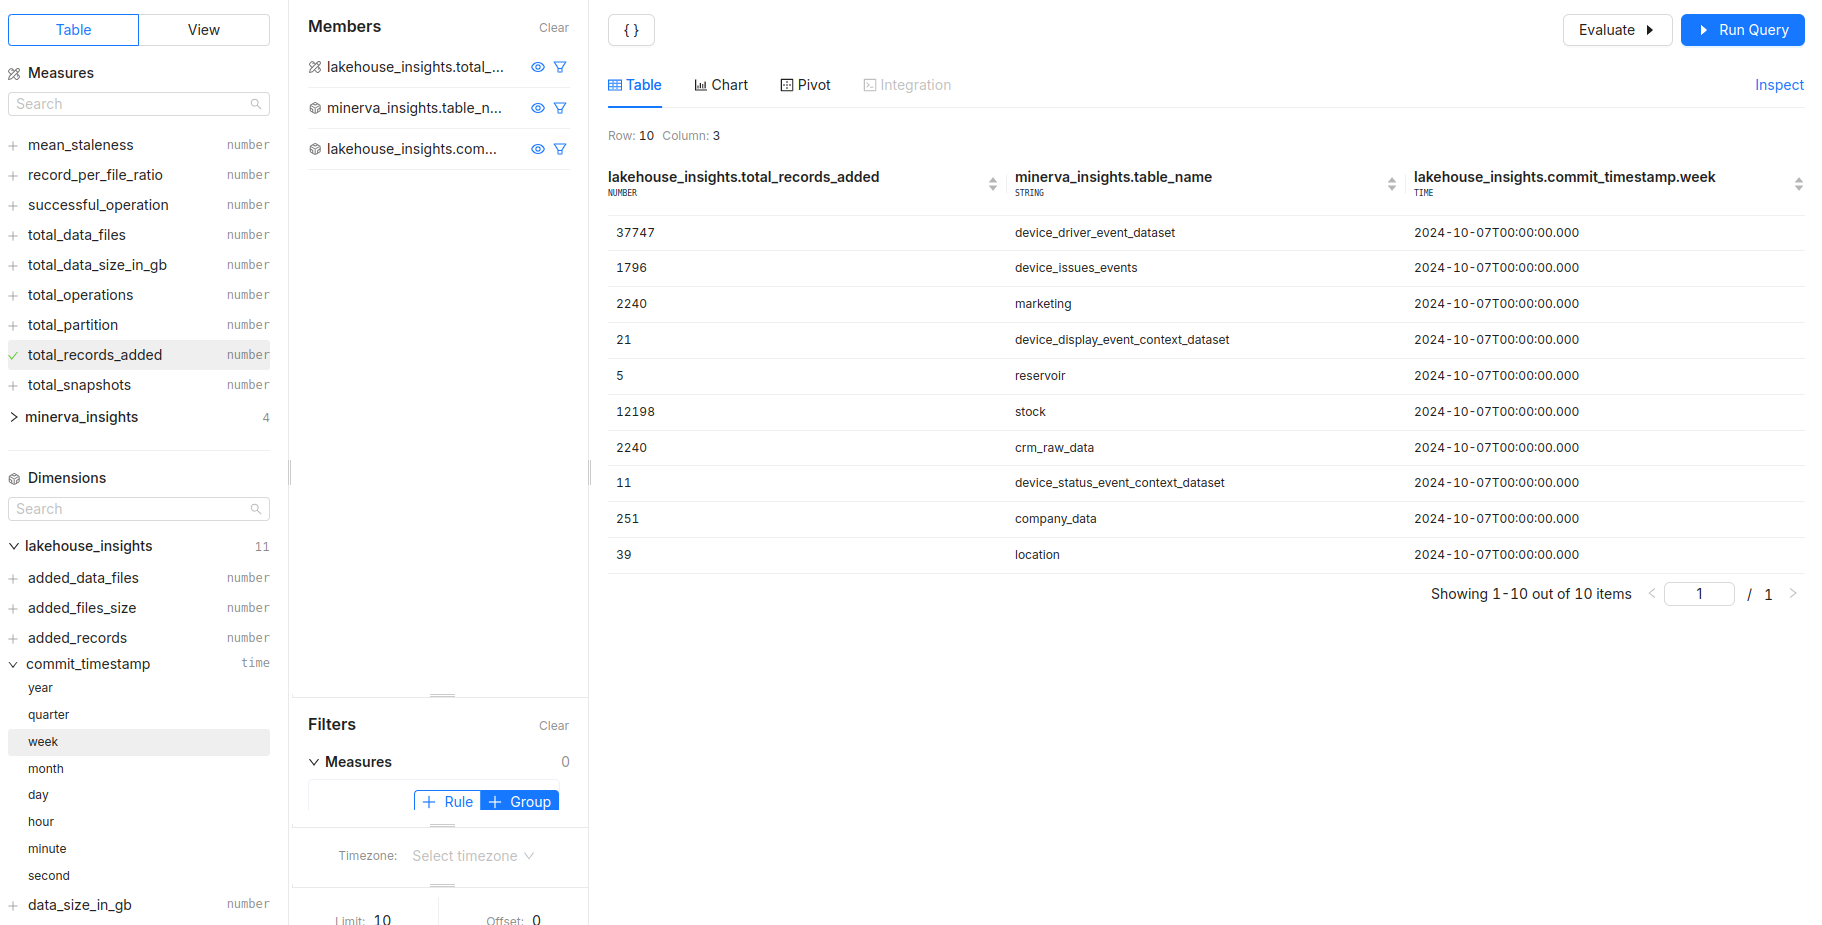
- Measures:
2. Operational efficiency
-
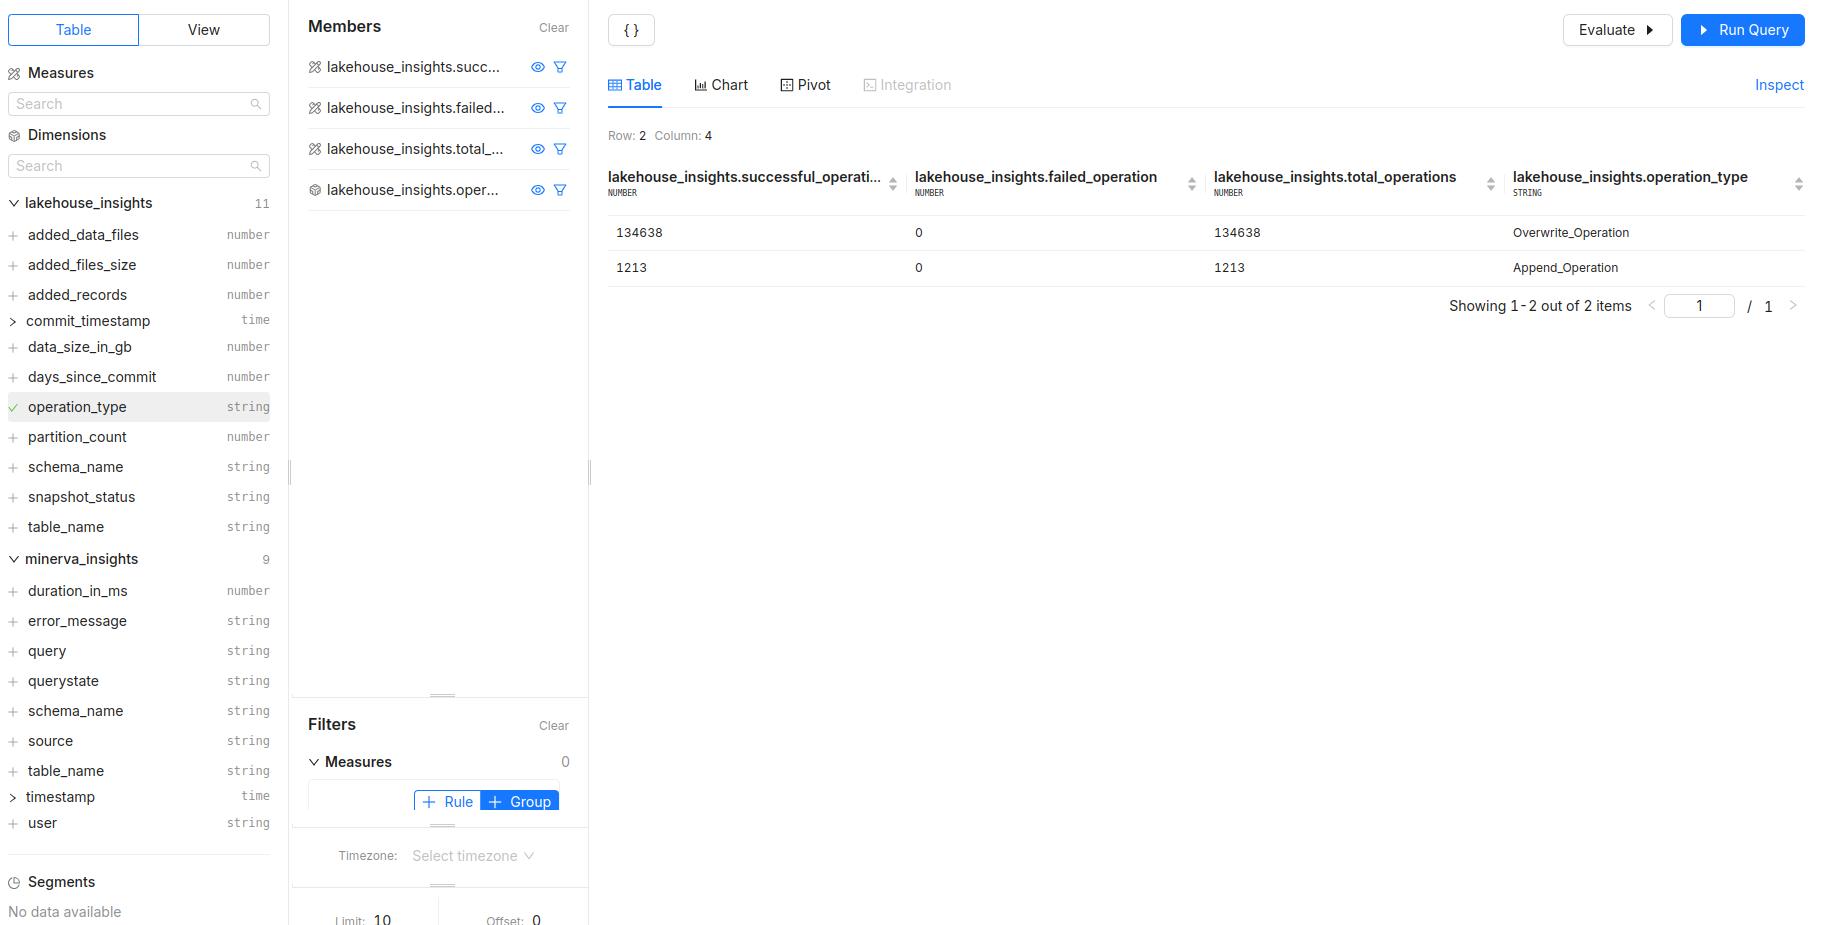
What is the success rate of operations per operation type?
- Measures:
successful_operation,failed_operation,total_operations - Dimensions:
operation_type - Filters: Analyze over a specific time period using
commit_timestamp.
- Measures:
-
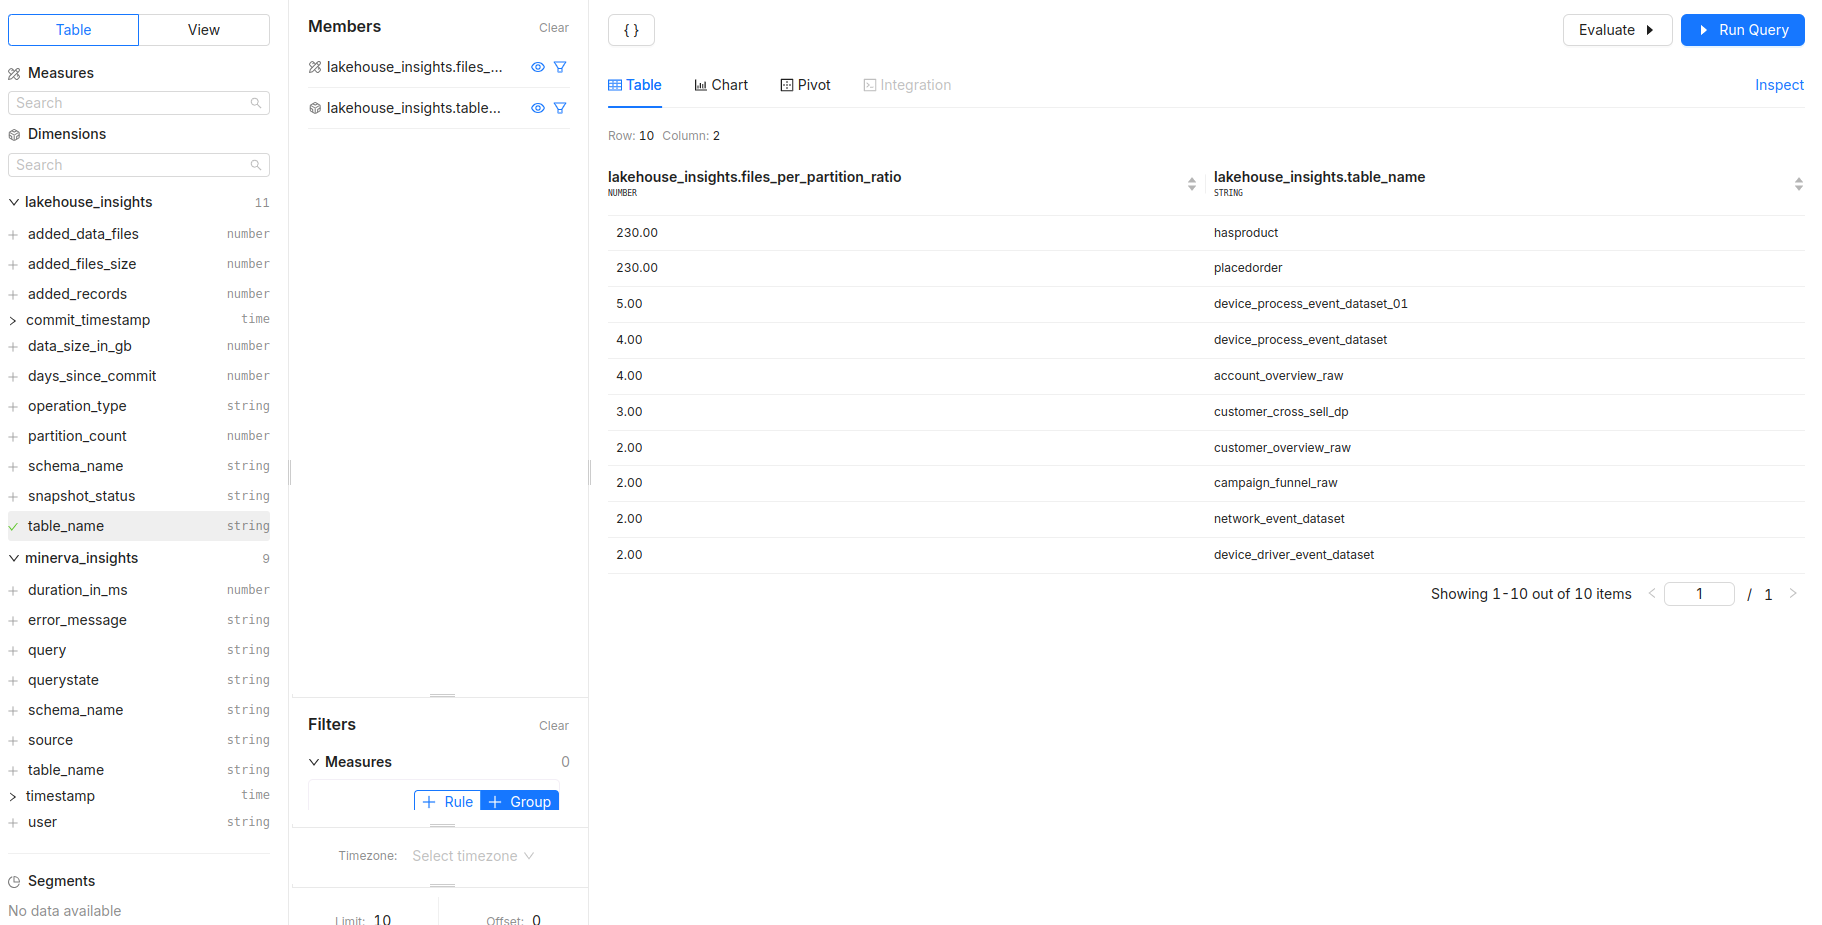
How does the
files_per_partition_ratiovary across tables, and what impact might this have on performance?- Measures:
files_per_partition_ratio - Dimensions:
table_name - Filters: Filter by
schema_nameto focus on a particular database.
- Measures:
-
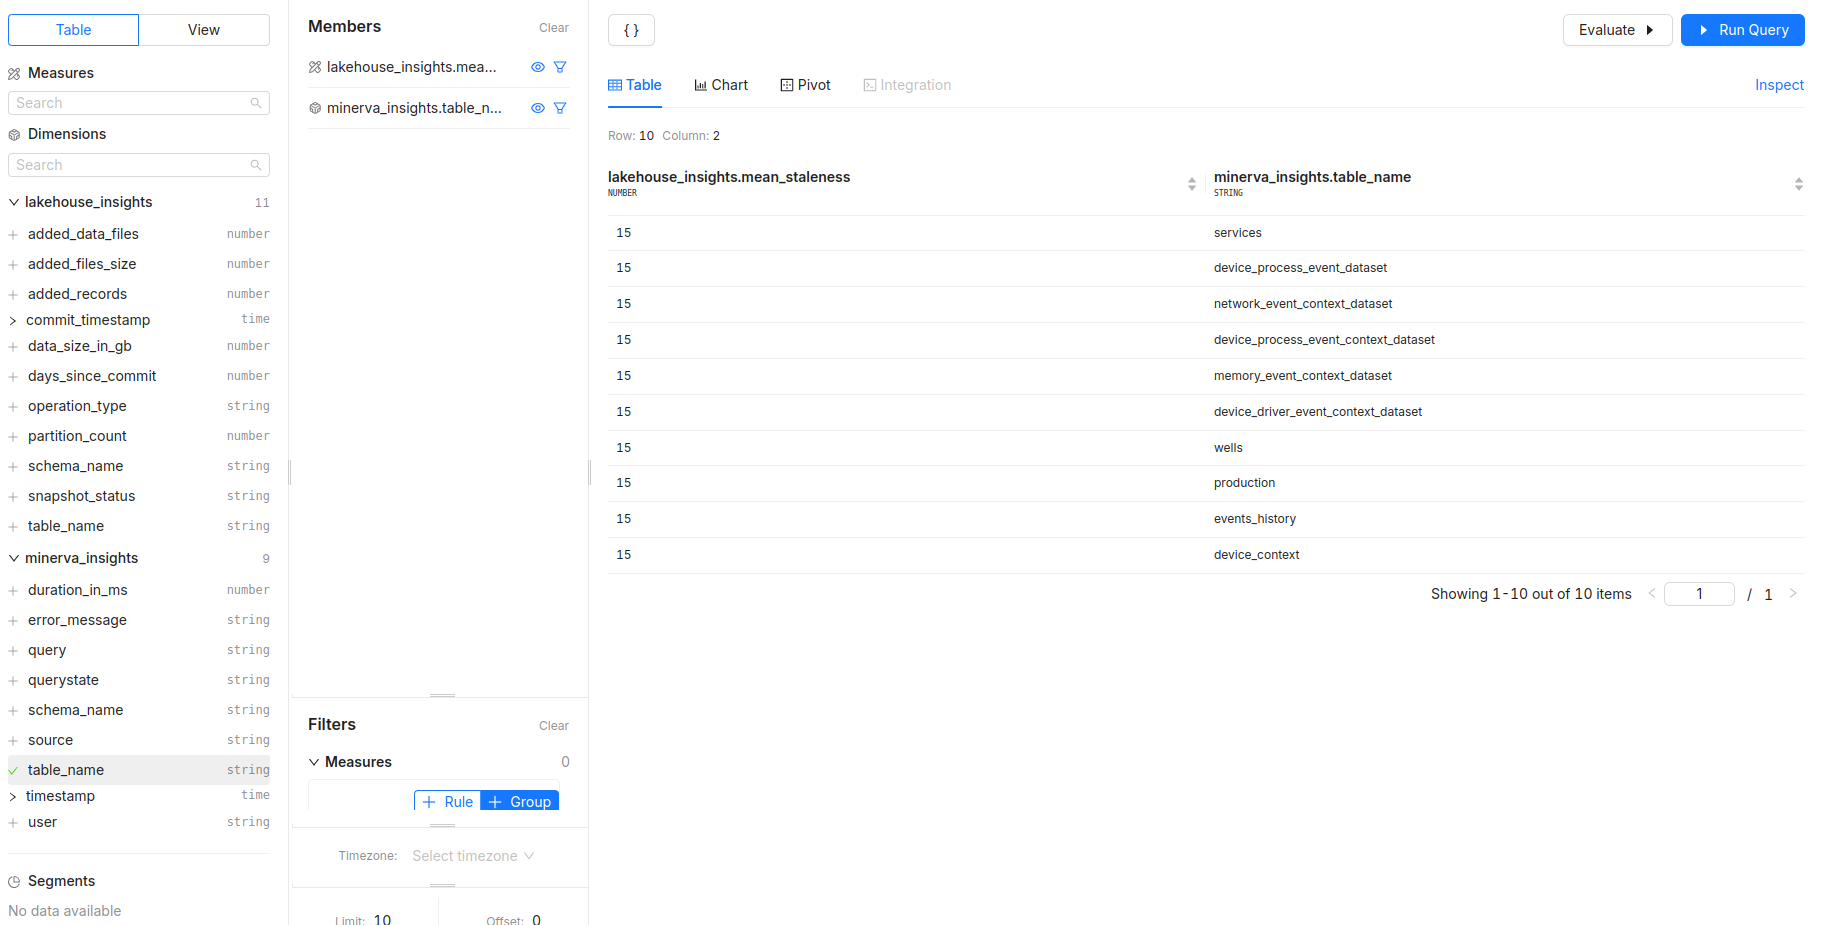
What is the mean staleness of data in each table?
- Measures:
mean_staleness - Dimensions:
table_name - Filters: Identify tables that may need attention due to outdated data.
- Measures:
3. User activity and engagement
-
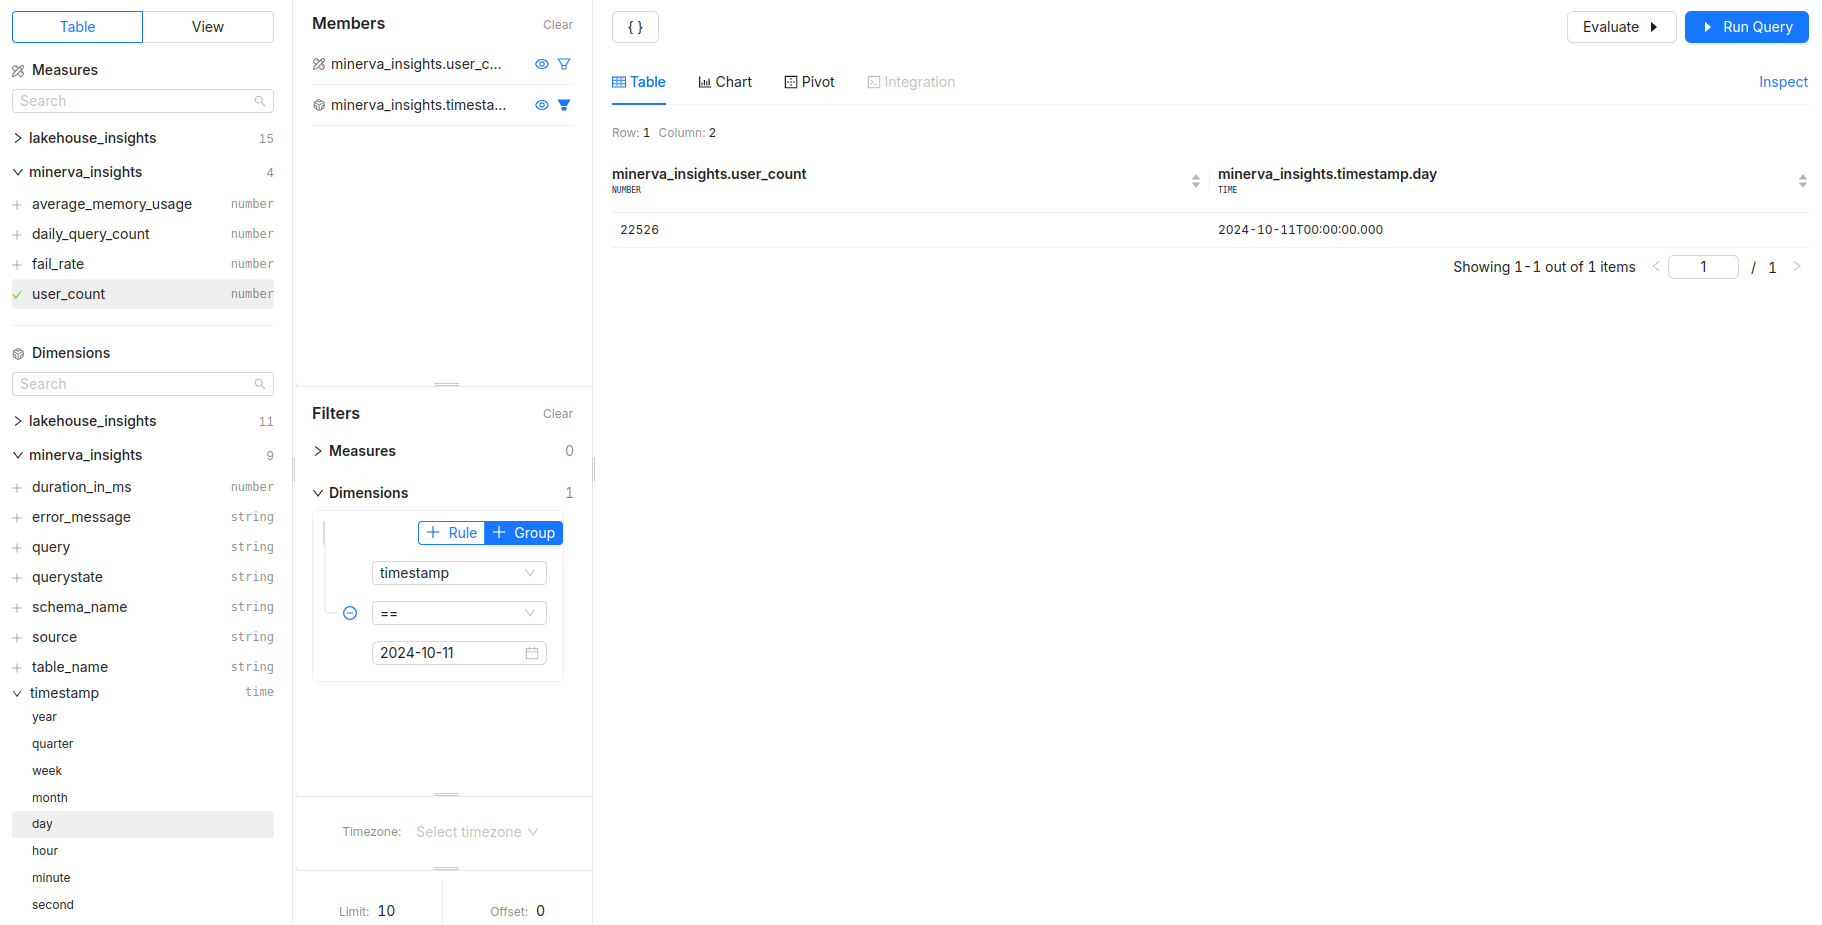
How many unique users are querying the system daily?
- Measures:
user_count - Dimensions:
timestamp - Filters: Analyze user engagement over time.
- Measures:
-
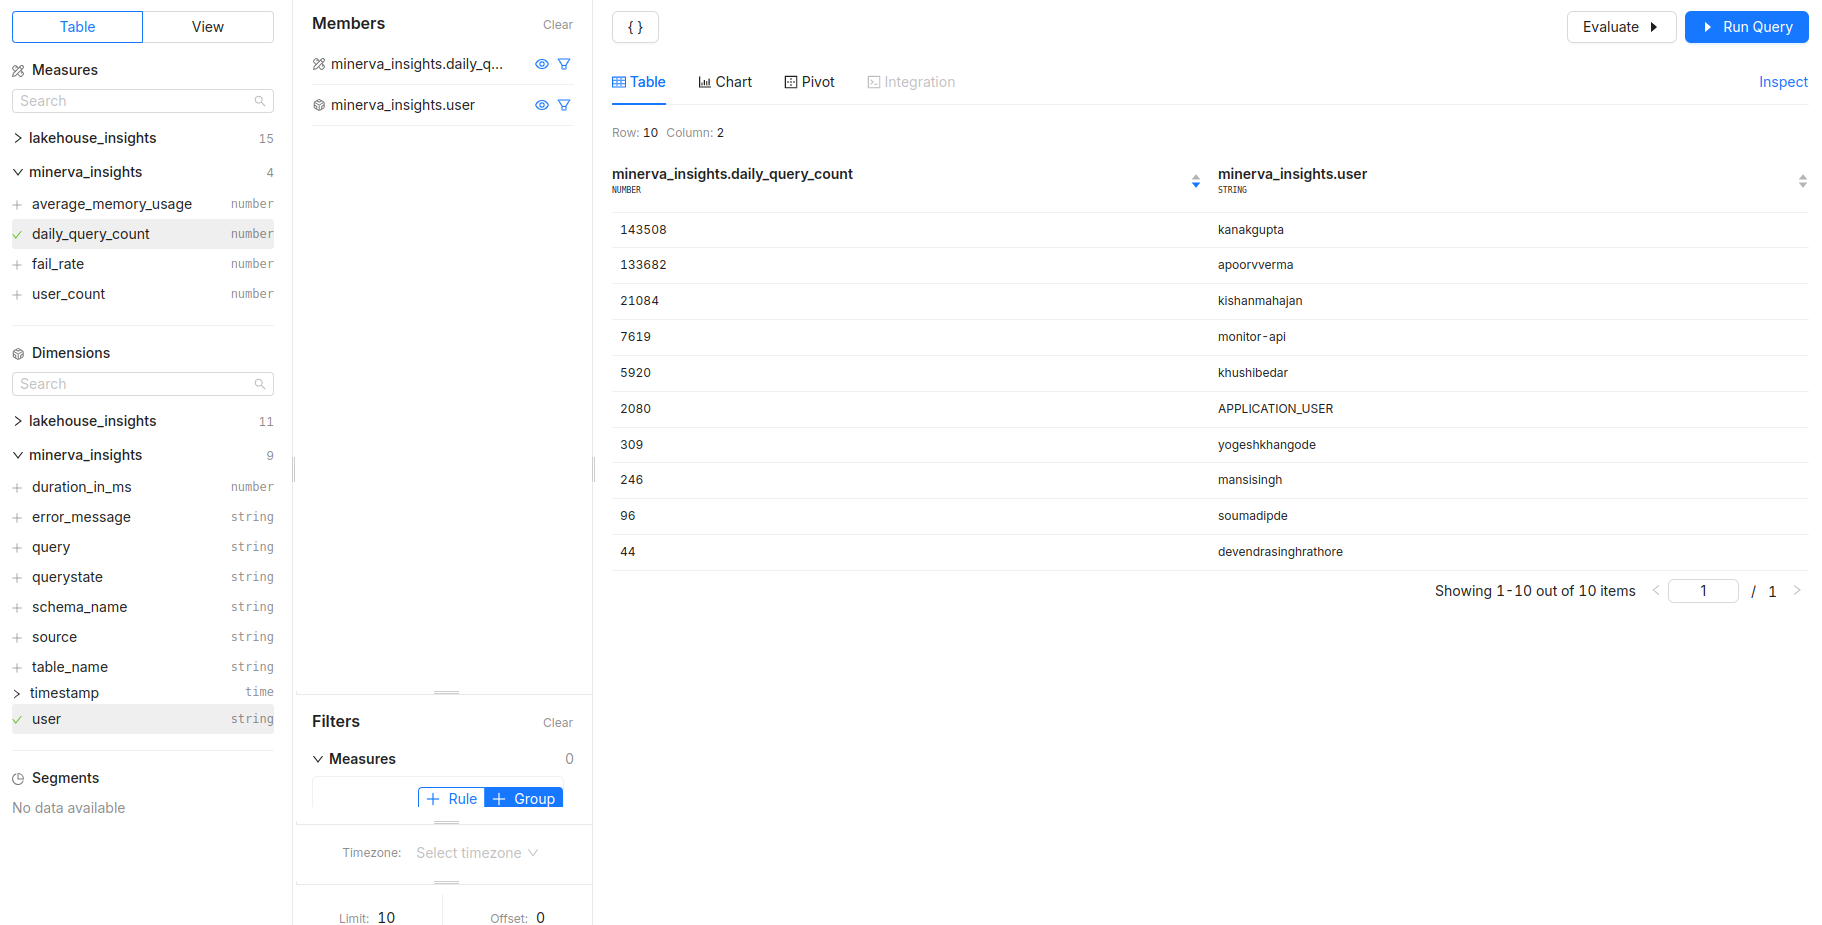
Which users are generating the highest number of queries?
- Measures:
daily_query_count - Dimensions:
user -
Filters: Identify power users or potential system abusers.
- Measures:
4. System performance and reliability
-
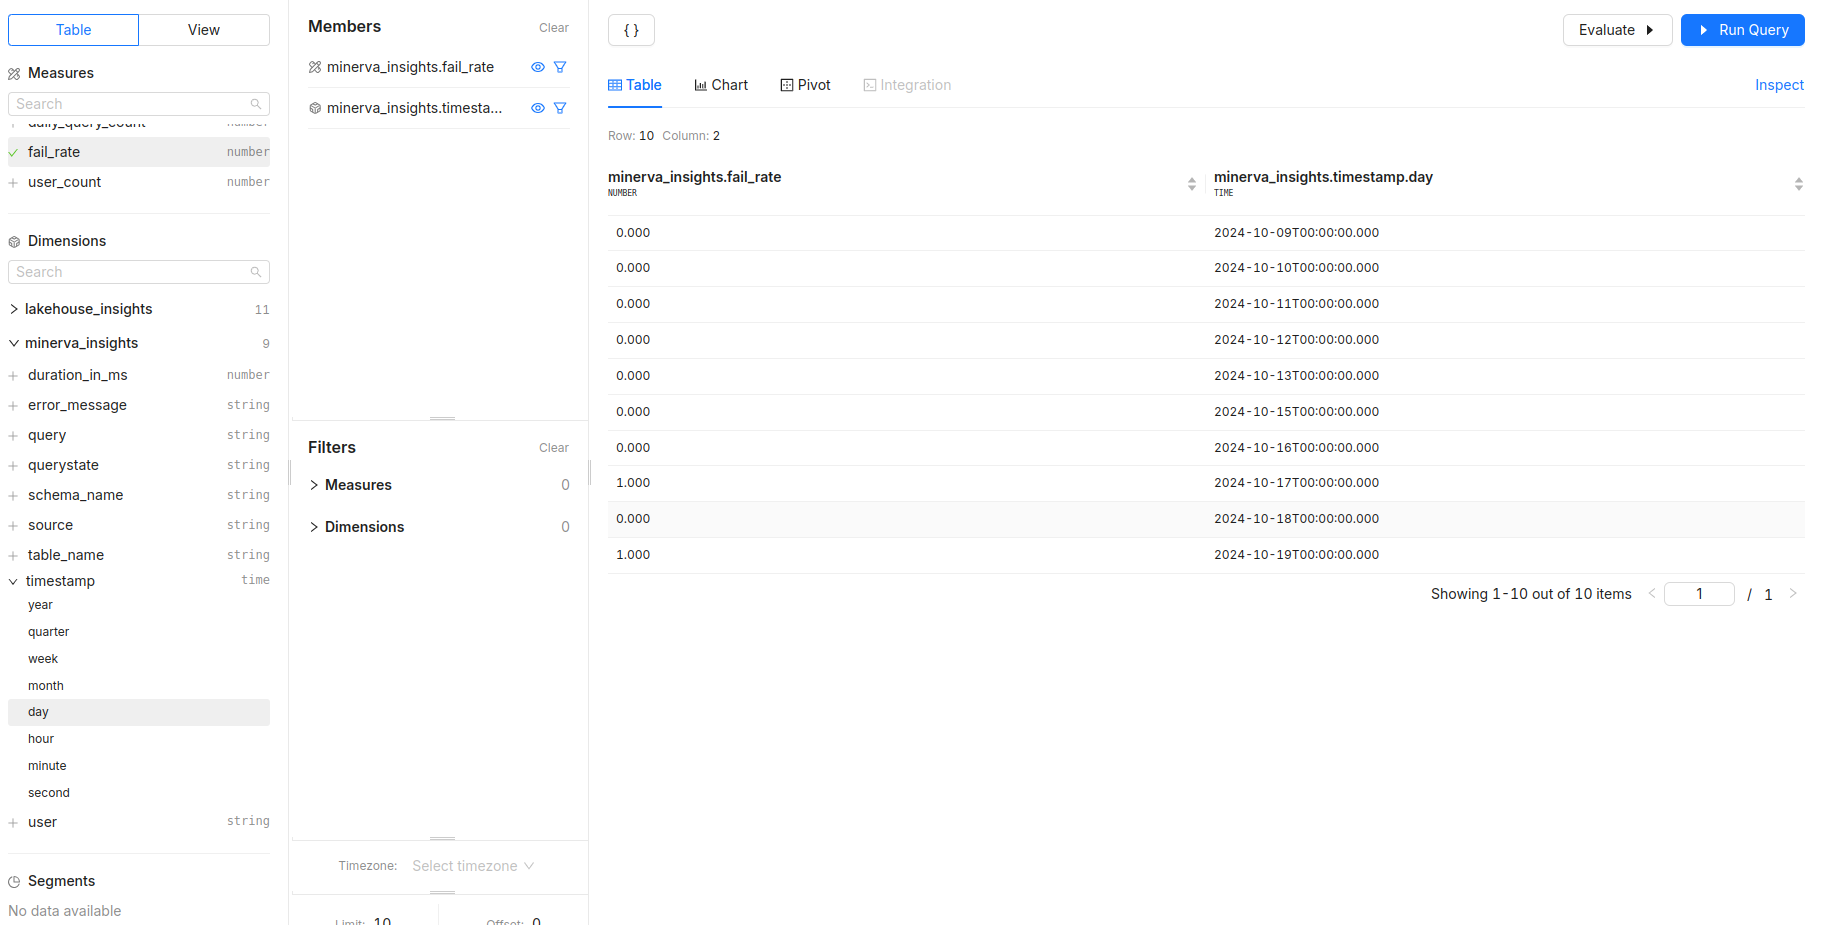
What is the overall fail rate of queries, and how does it change over time?
- Measures:
fail_rate - Dimensions:
timestamp - Filters: Monitor system reliability and detect anomalies.
- Measures:
5. Error analysis and troubleshooting
- What are the most common error messages, and which users are getting them?
- Dimensions:
error_message,query -
Filters: Use
timestampto focus on recent issues; filter byuserto identify if specific users face more errors.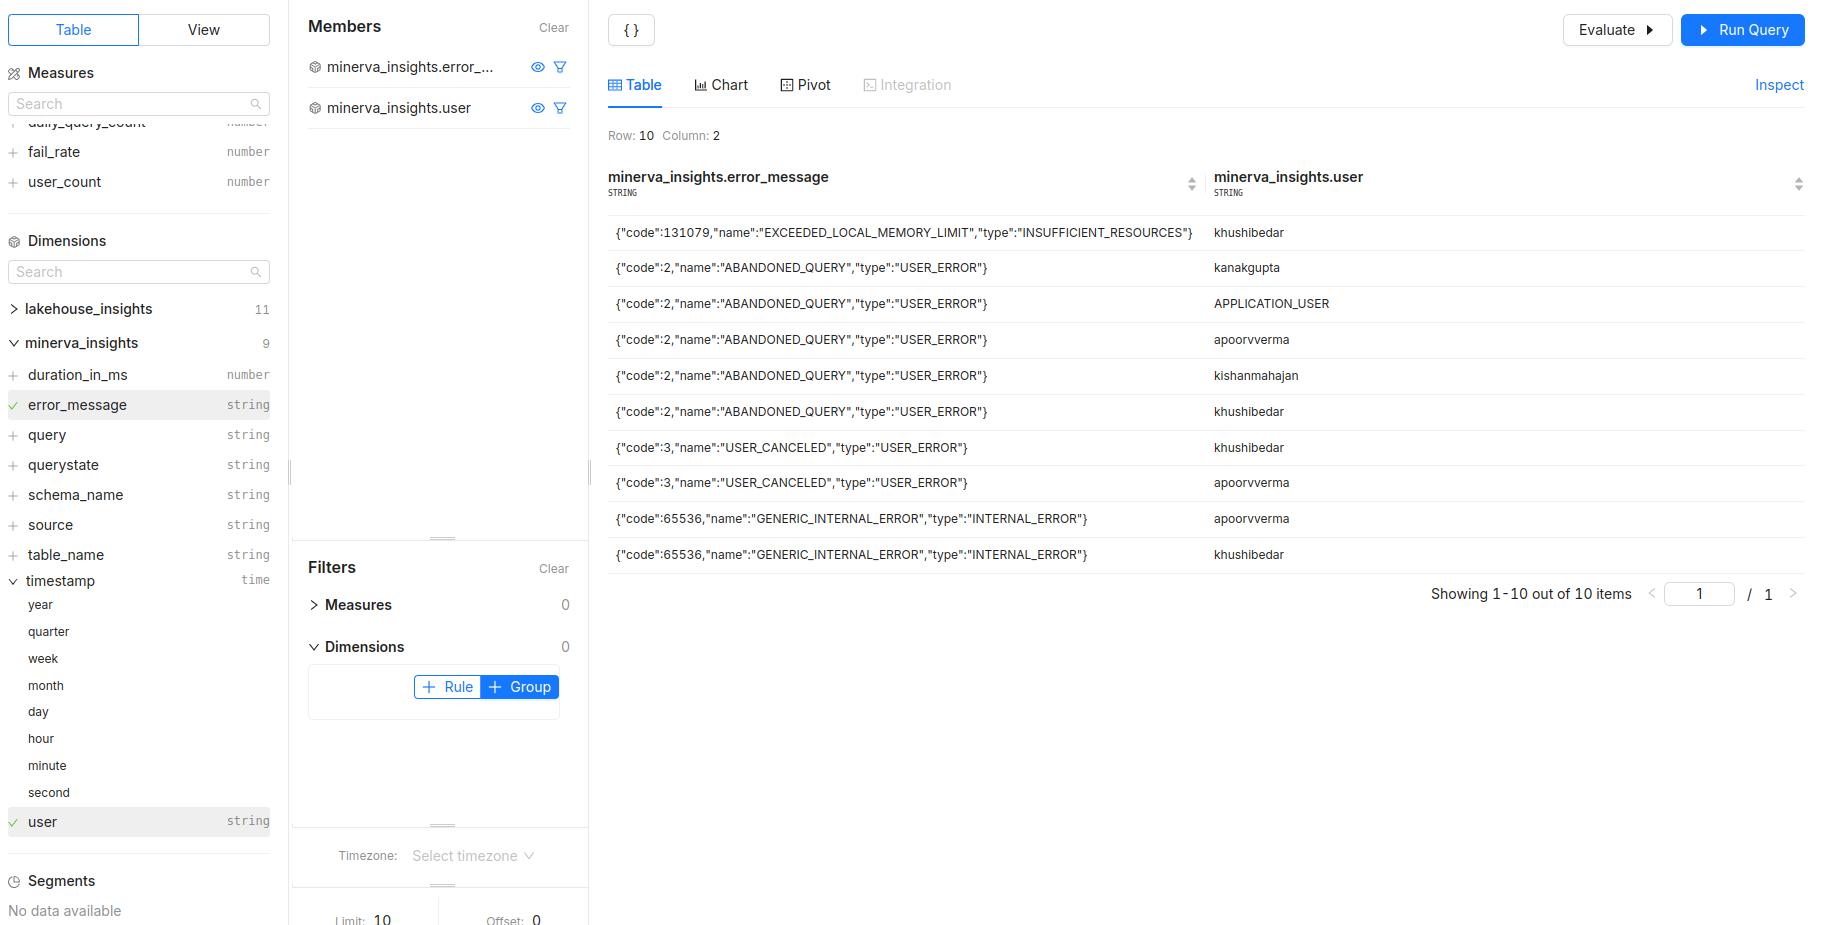
- Dimensions: