Configuring Alerts and Dashboards using Grafana
This topic details the steps to configure alerts for key performance indicators and troubleshooting performance issues.
Scenario
Imagine you're responsible for ensuring the reliability of a critical application in DataOS. Your job is to monitor the system for any signs of issues, such as unexpected traffic spikes, high CPU usage, or incoming alerts that indicate something might be wrong. To do this effectively, you need a tool that lets you visualize what’s happening within your system in real-time.
Grafana as observability tool
In DataOS, Grafana helps you track the health and performance of your systems by creating visual dashboards. Grafana gathers data from Prometheus, a monitoring system that collects time-series metrics (like CPU usage, memory consumption, or alert counts) about your infrastructure. This setup allows you to see trends, spot unusual patterns, and respond to issues before they impact users.
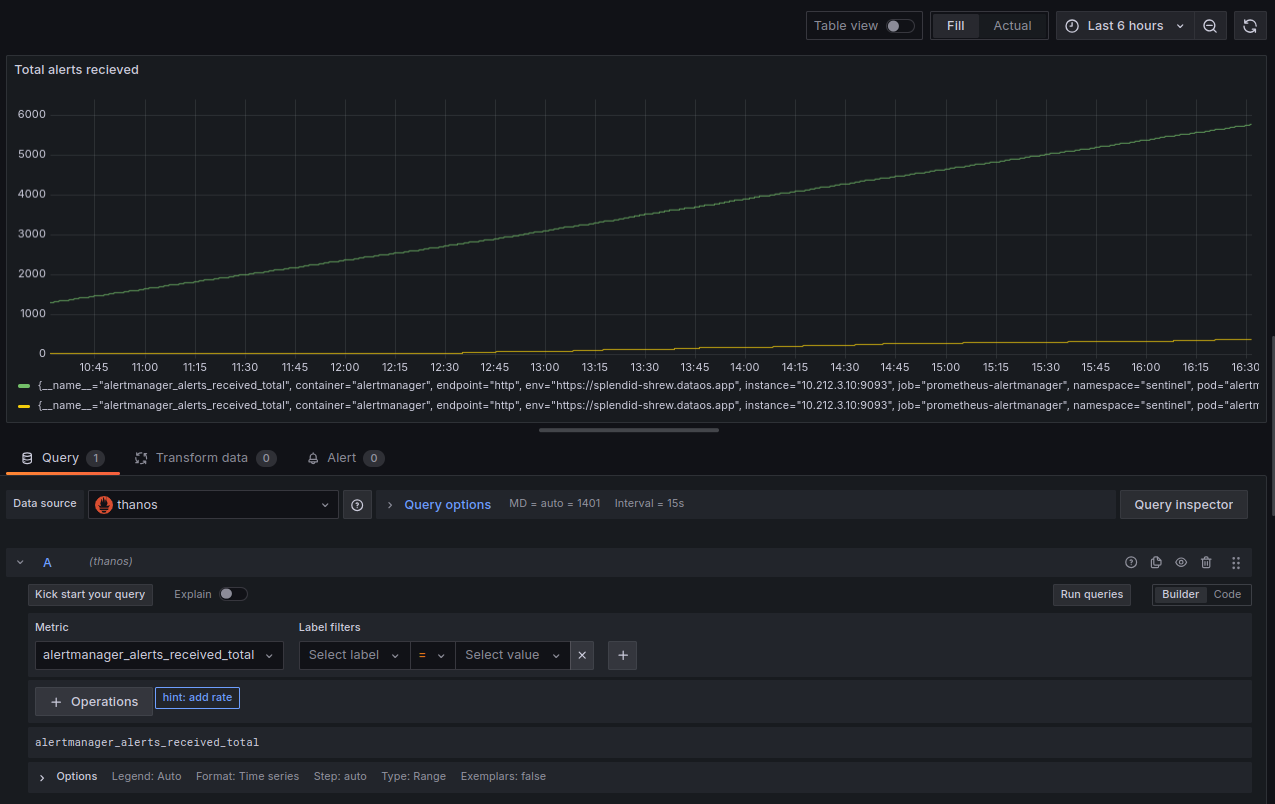
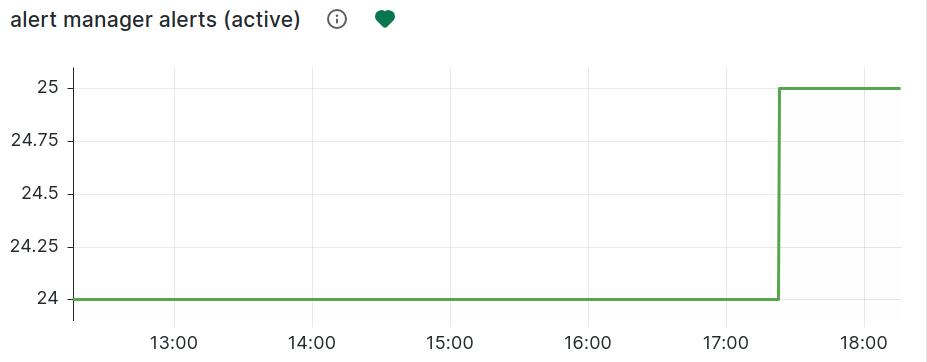
In the example shown, Grafana is displaying a dashboard that tracks ‘Total alerts received’ over the past six hours. This metric shows the number of alerts received by the alert manager, giving insights into potential issues. You can see a steady increase in alerts over time, represented by the green line.
With Grafana, you can customize these visualizations to suit your monitoring needs. You can filter by specific labels (such as the environment or container) and adjust the time range to focus on different periods. This flexibility helps you quickly diagnose issues, identify trends, and keep your systems running smoothly.
Configure the Prometheus data source
Follow the below steps to configure the Prometheus data source in Grafana.
-
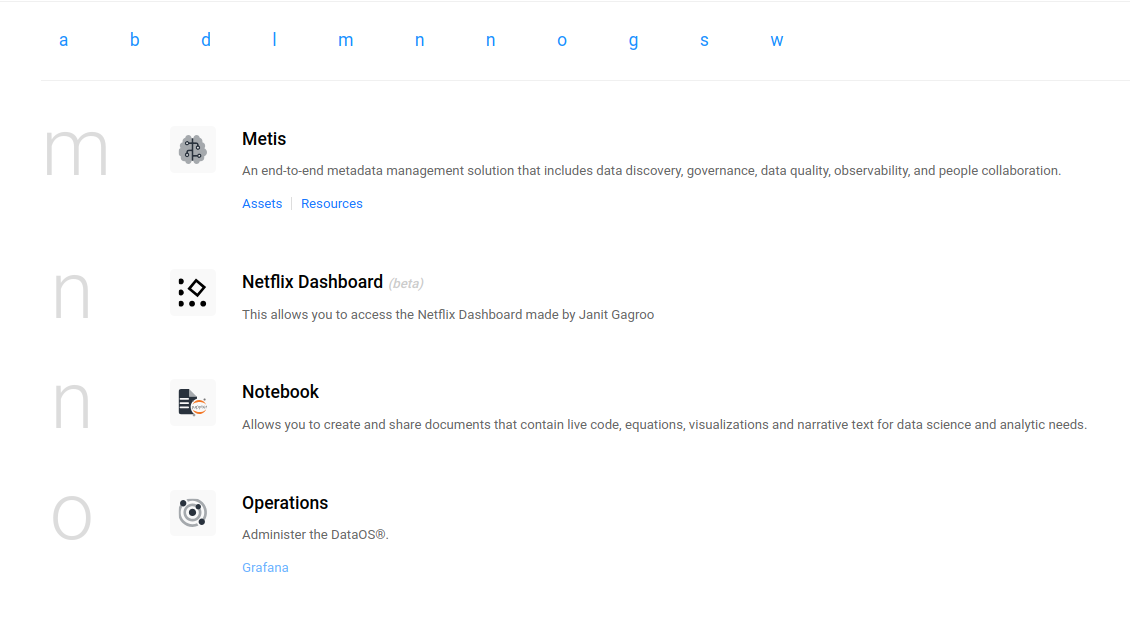
Open the Grafana app.
-
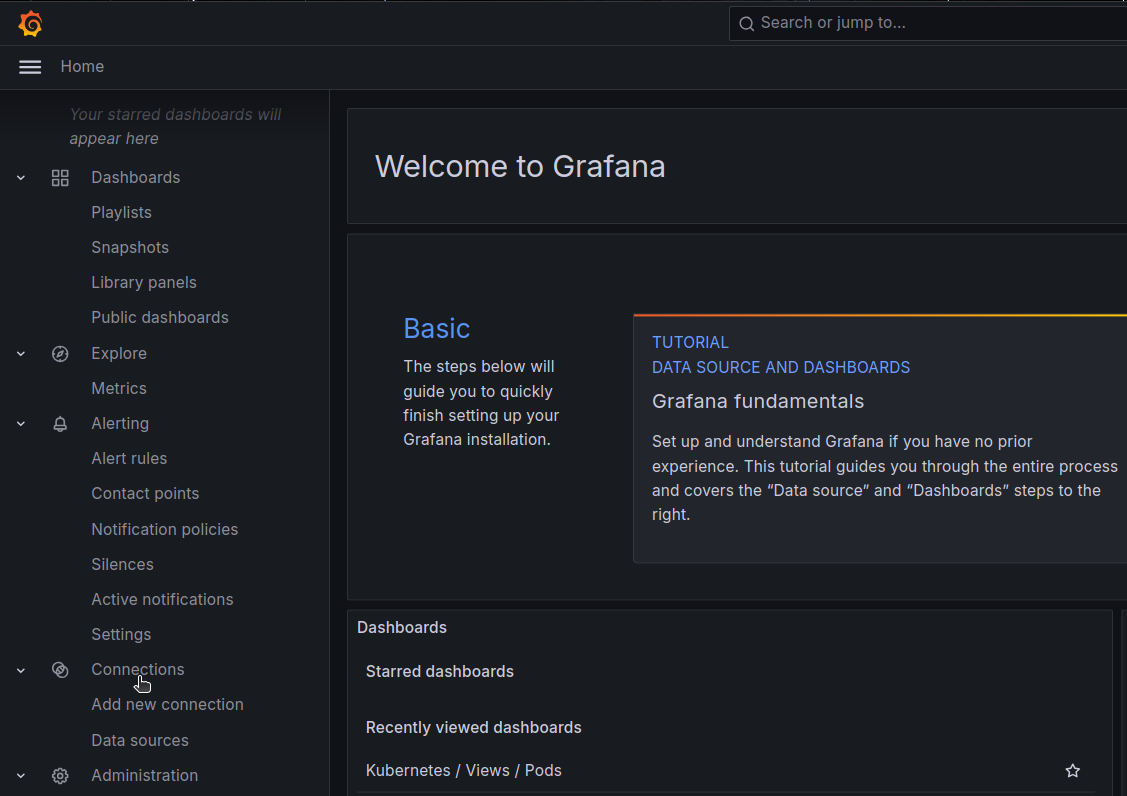
Navigate to the connections section.
-
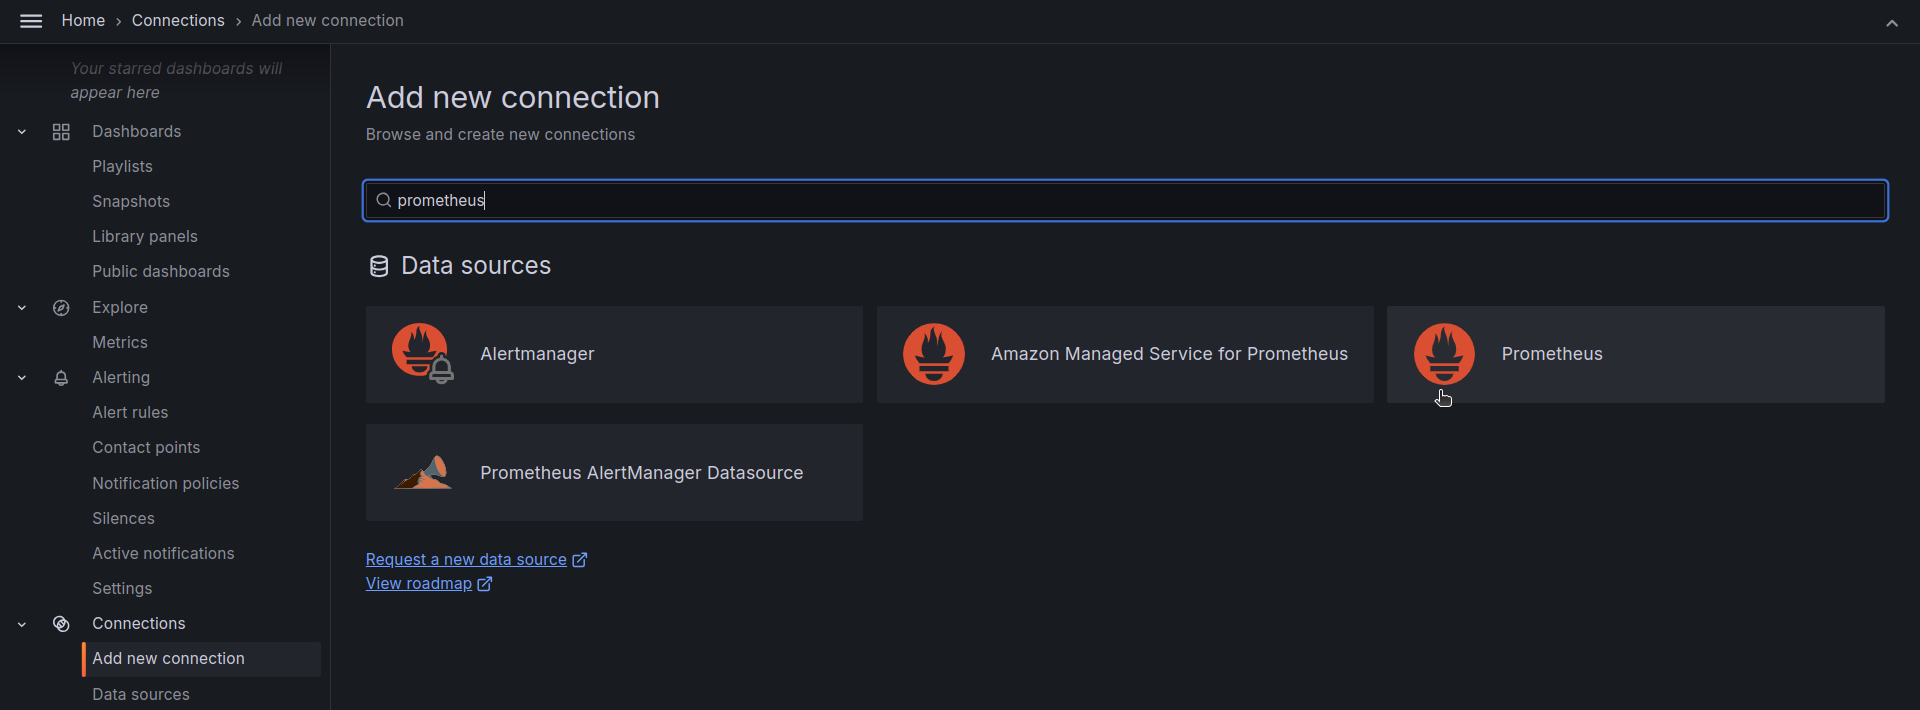
Search for the Prometheus.
-
On clicking the Prometheus data source, navigate to the ‘Add new data source’ button.

-
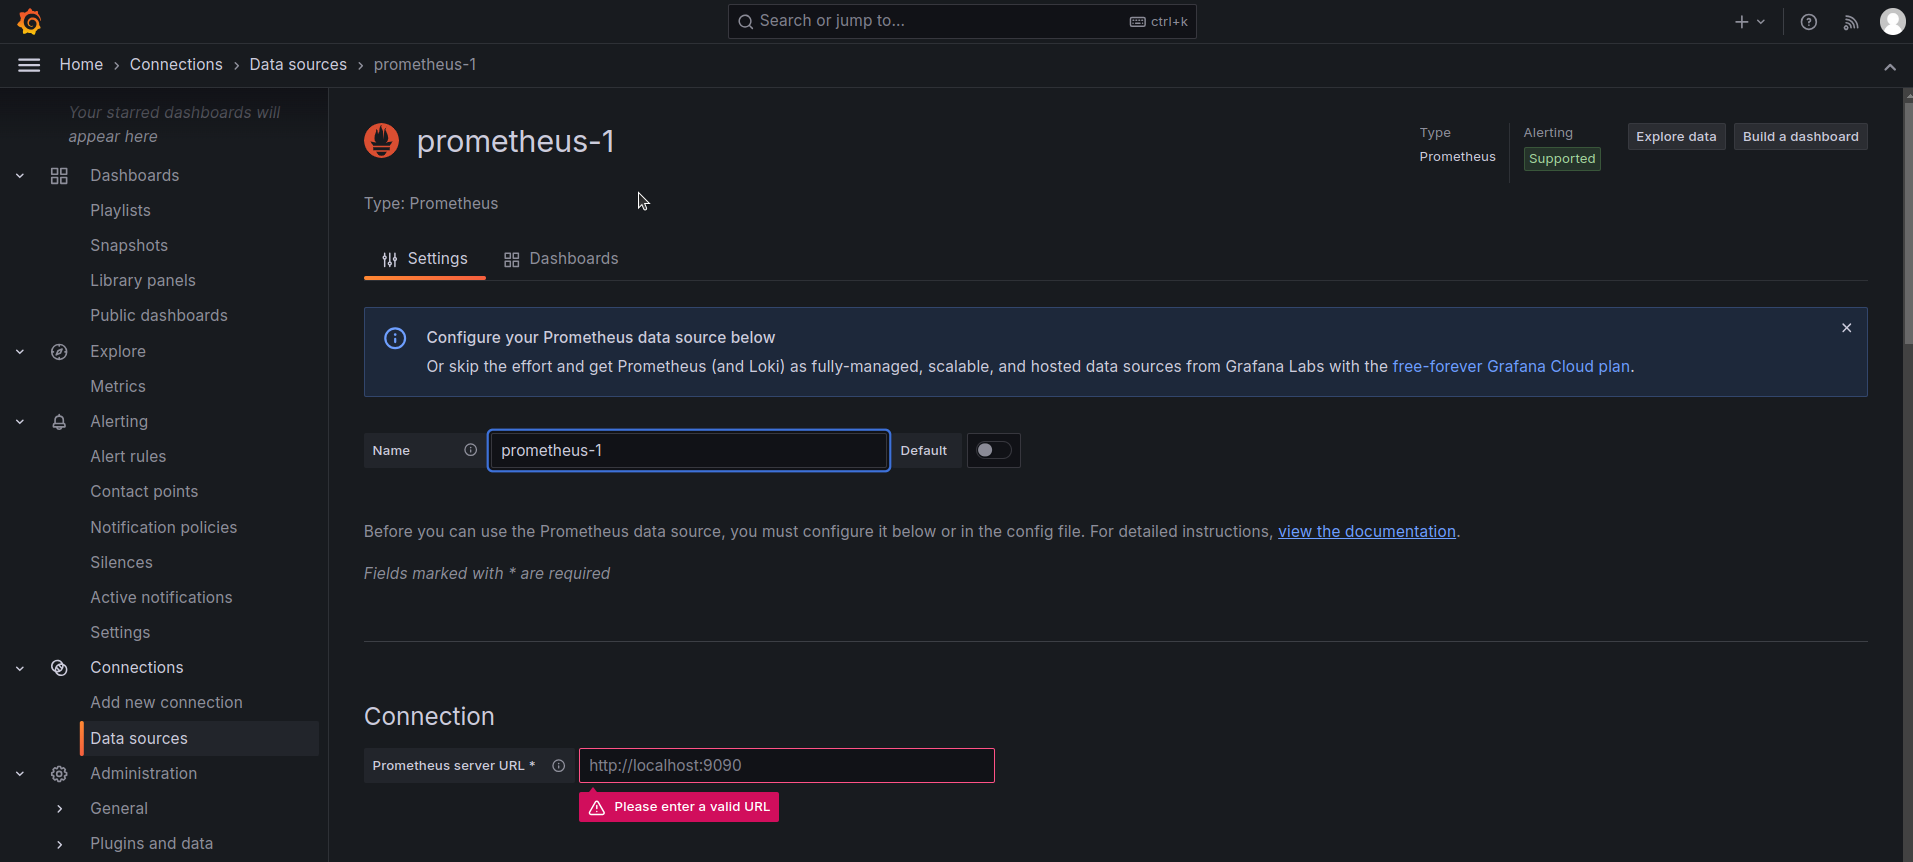
On clicking the ‘Add new data source’ button, you now here need to provide the name, Prometheus server URL, and authentication details for setting up the connection. Then click on the ‘save and test’ button.
-
Now you can create the dashboard.
Create a Grafana dashboard
After successfully connecting to the Prometheus, now you can move into building the dashboard. This section provides a step-by-step walk through for creating dashboards.
Before you begin
- Ensure that you have the necessary tags to create the dashboard.
- Understand the query language (PromQL) of the target data source (Prometheus).
Steps to create a dashboard
This section provides a step-by-step walk-through for creating dashboards.
-
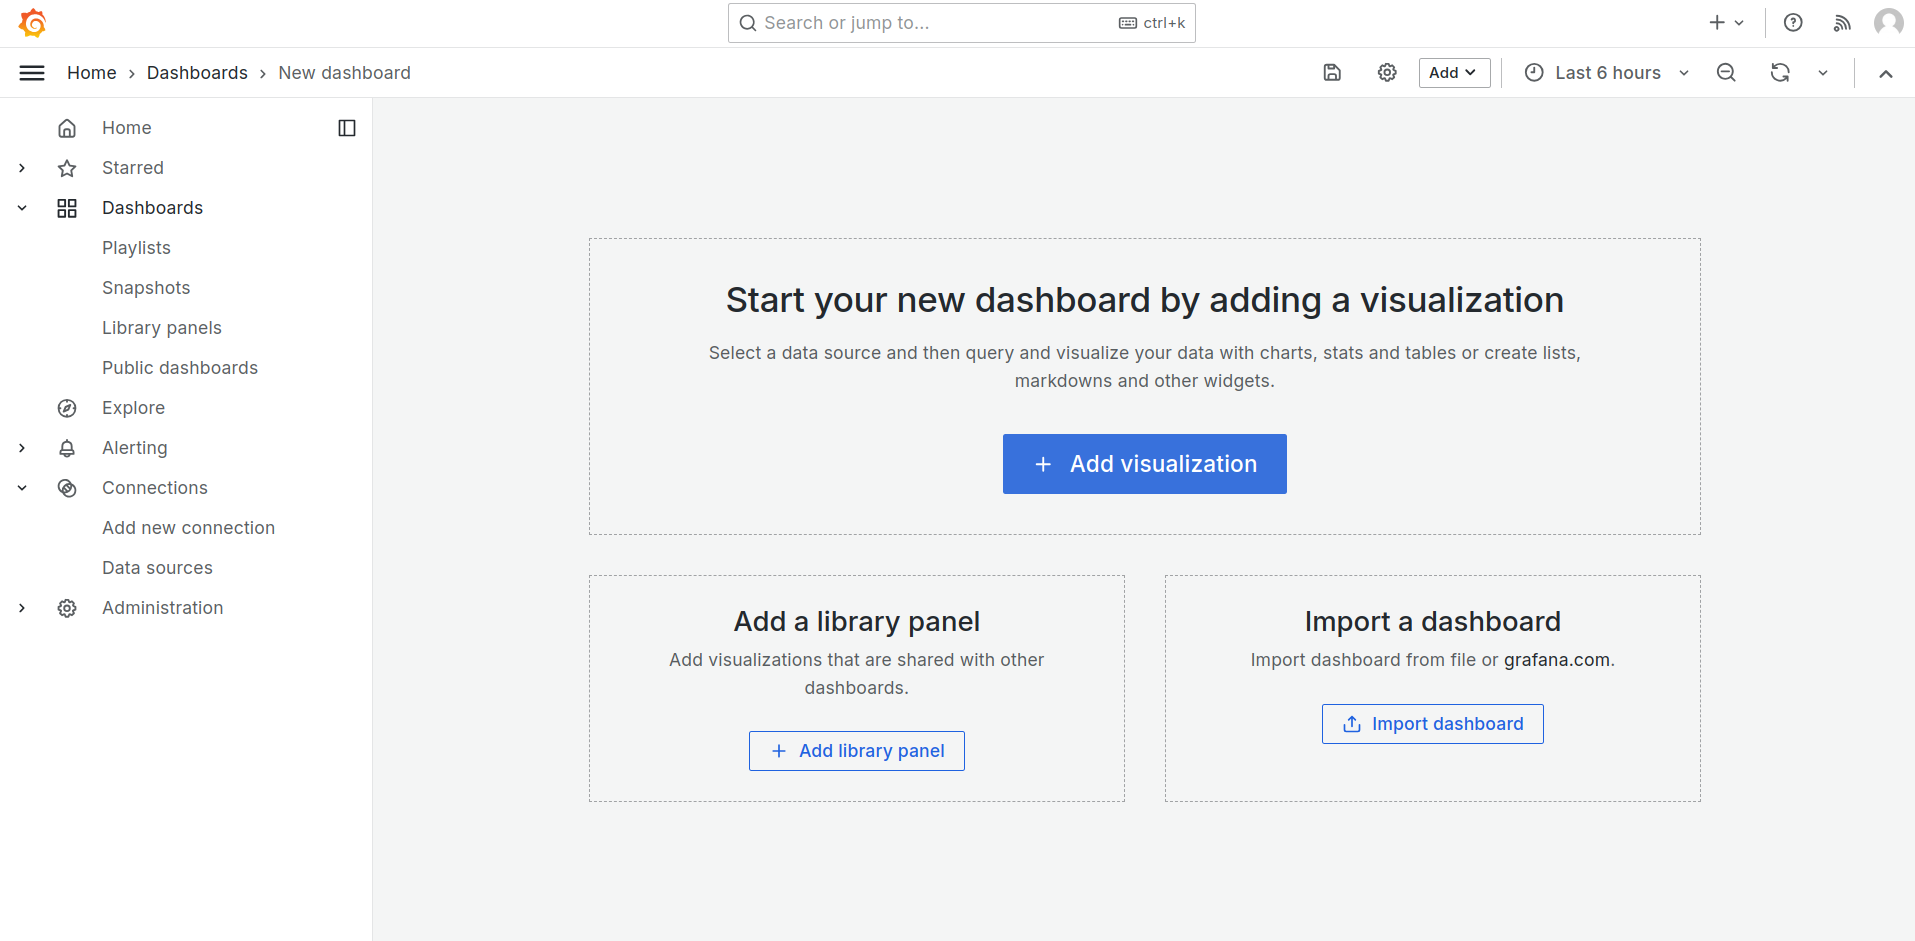
Click Dashboards in the left-side menu.
-
Click New and select New Dashboard.
-
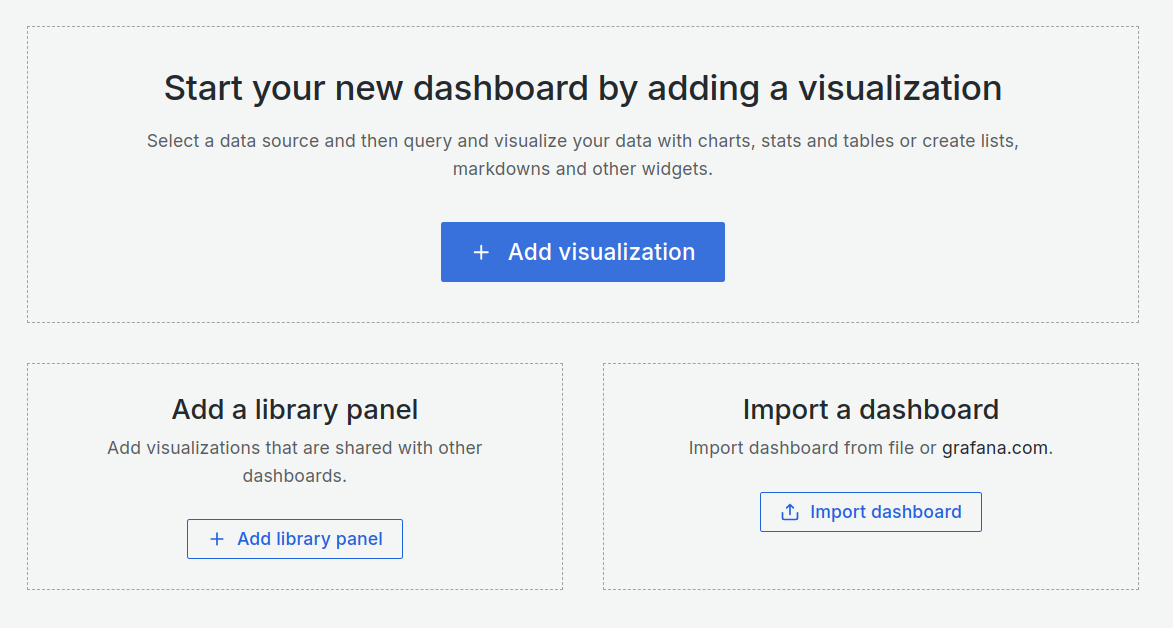
On the empty dashboard, click + Add visualization.
-
In the dialog box that opens, do one of the following:
-
Select one of your existing data sources.
-
Click Configure a new data source to set up a new one (Admins only).
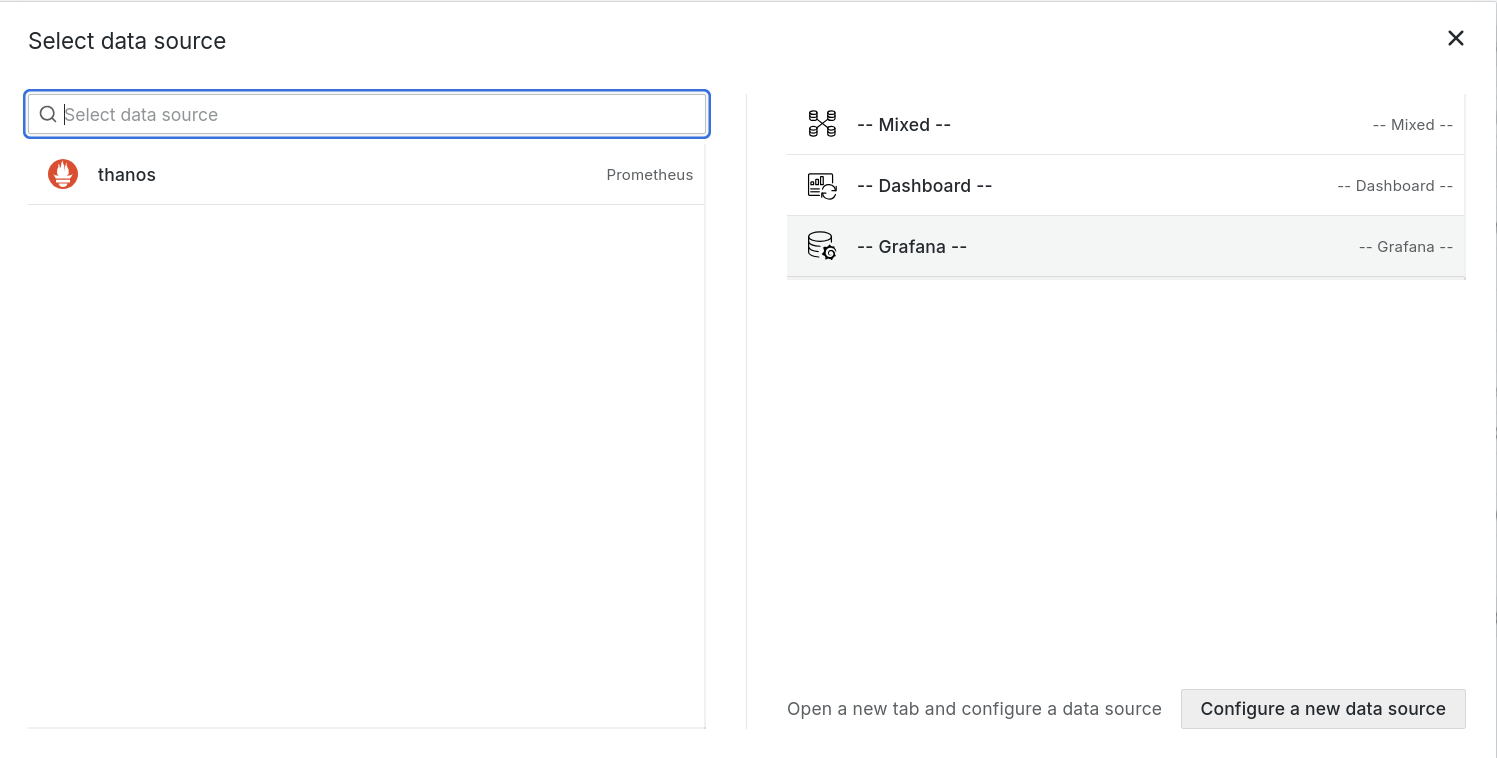
The Edit panel view will open when you select the data source. You can change the panel data source later using the drop-down in the Query tab of the panel editor if needed.
-
-
Write or construct a query in PromQL.

-
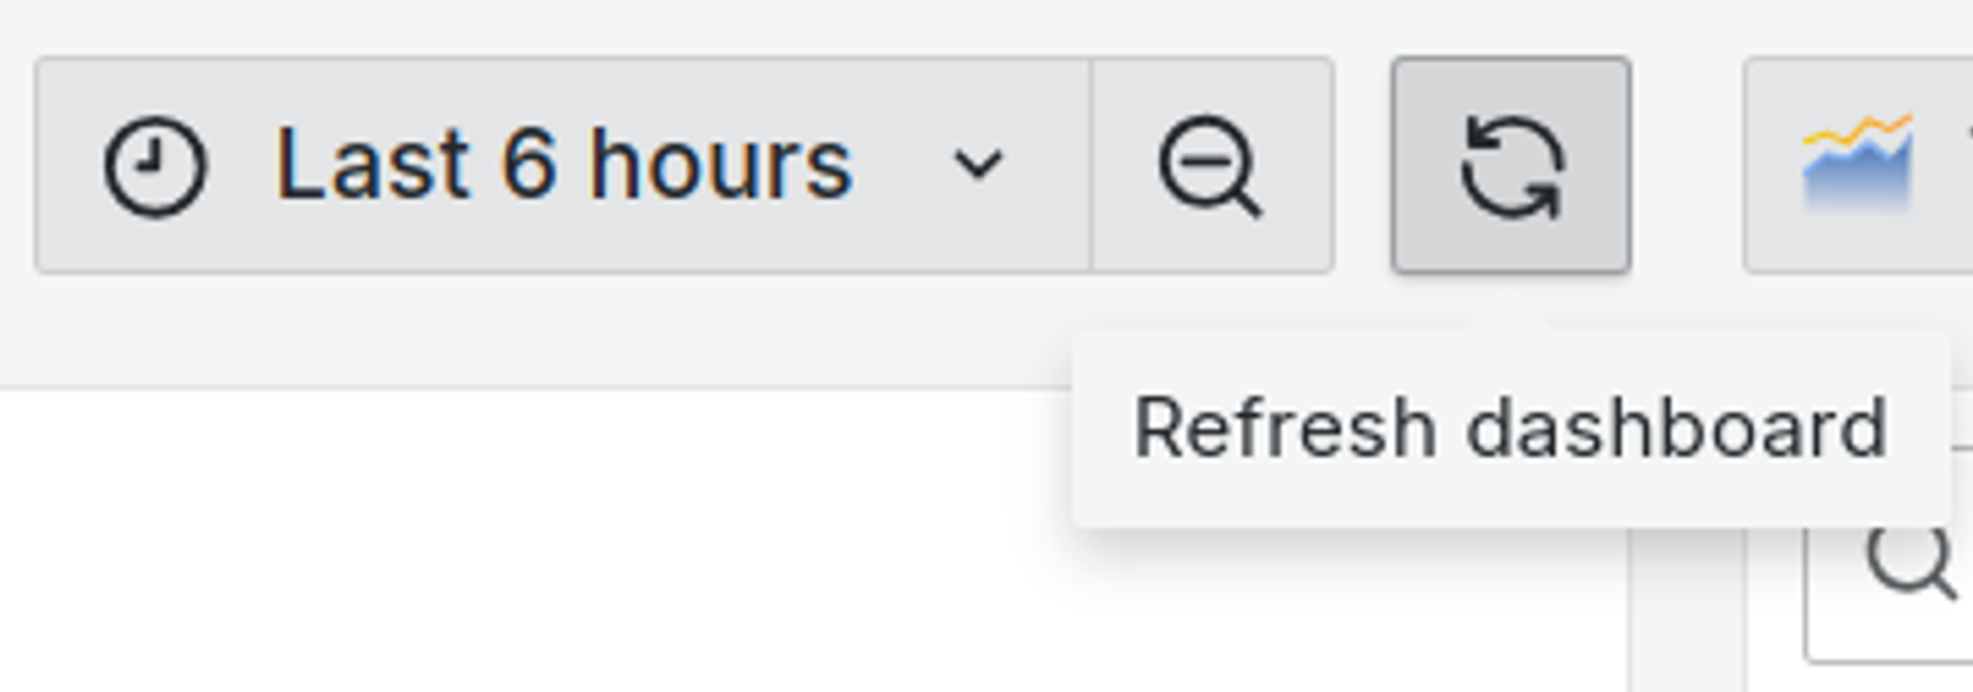
Click the Refresh dashboard icon to query the data source.
-
In the visualization list, select a visualization type.
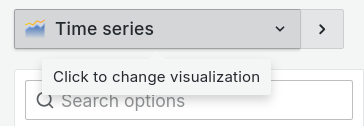
Grafana displays a preview of your query results with the visualization applied.
For more information about individual visualizations, refer to Visualizations options.
-
Under Panel options, enter a title and description for your panel.
-
After editing your panel, click Save to save the dashboard.
Alternatively, click Apply to see your changes applied to the dashboard first. Then click the save icon in the dashboard header.
-
Enter a title for your dashboard and select a folder.
- Click Save.
-
To add more panels to the dashboard, click Add in the dashboard header and select Visualization in the drop-down.
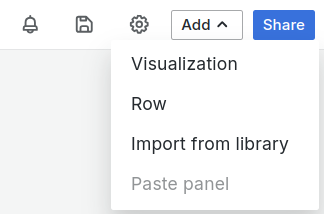
When you add additional panels to the dashboard, you’re taken straight to the Edit panel view.
Explore the system metrics
Exploration in Grafana allows you to query data from connected data sources (Prometheus) and visualize it to monitor the metrics without creating dashboards. You can retrieve the metrics either by querying using PromQL in the Code view or by manually selecting the metrics and their labels in the Builder view.
Builder View
Builder View is the default view in the Explore section. It allows you to build queries using a graphical interface interactively. Here's how to use it:
- Click Explore in the left-side menu.
- Choose the data source you want to query from the dropdown menu.
- Use the query builder to select metrics, specify filters, and define aggregations.
- Set the time range for your query.
- View the results of your query in a tabular format.
- Optionally, visualize your data using various chart types.
Builder View is great for exploring your data interactively and quickly creating queries without writing any code.
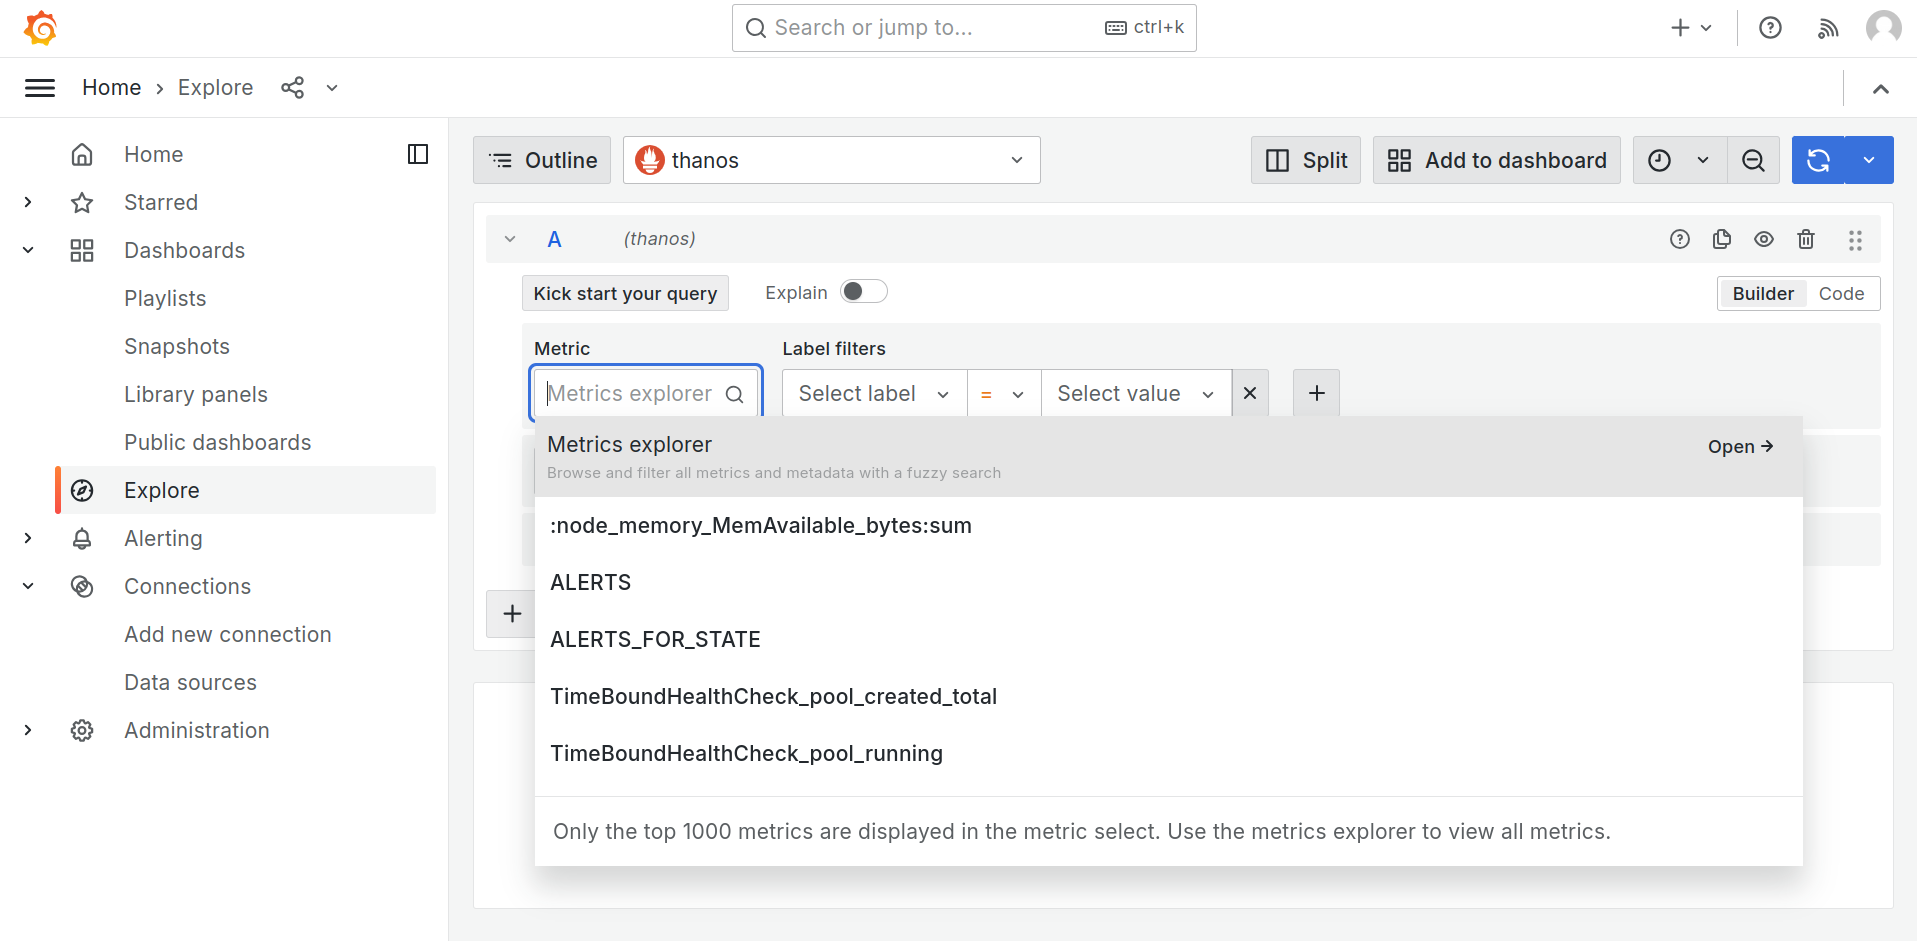
You can also explore the metrics, using Metrics Explorer.
Code view
Code View allows you to write and execute queries directly using the query language supported by your data source such as Prometheus supports PromQL.
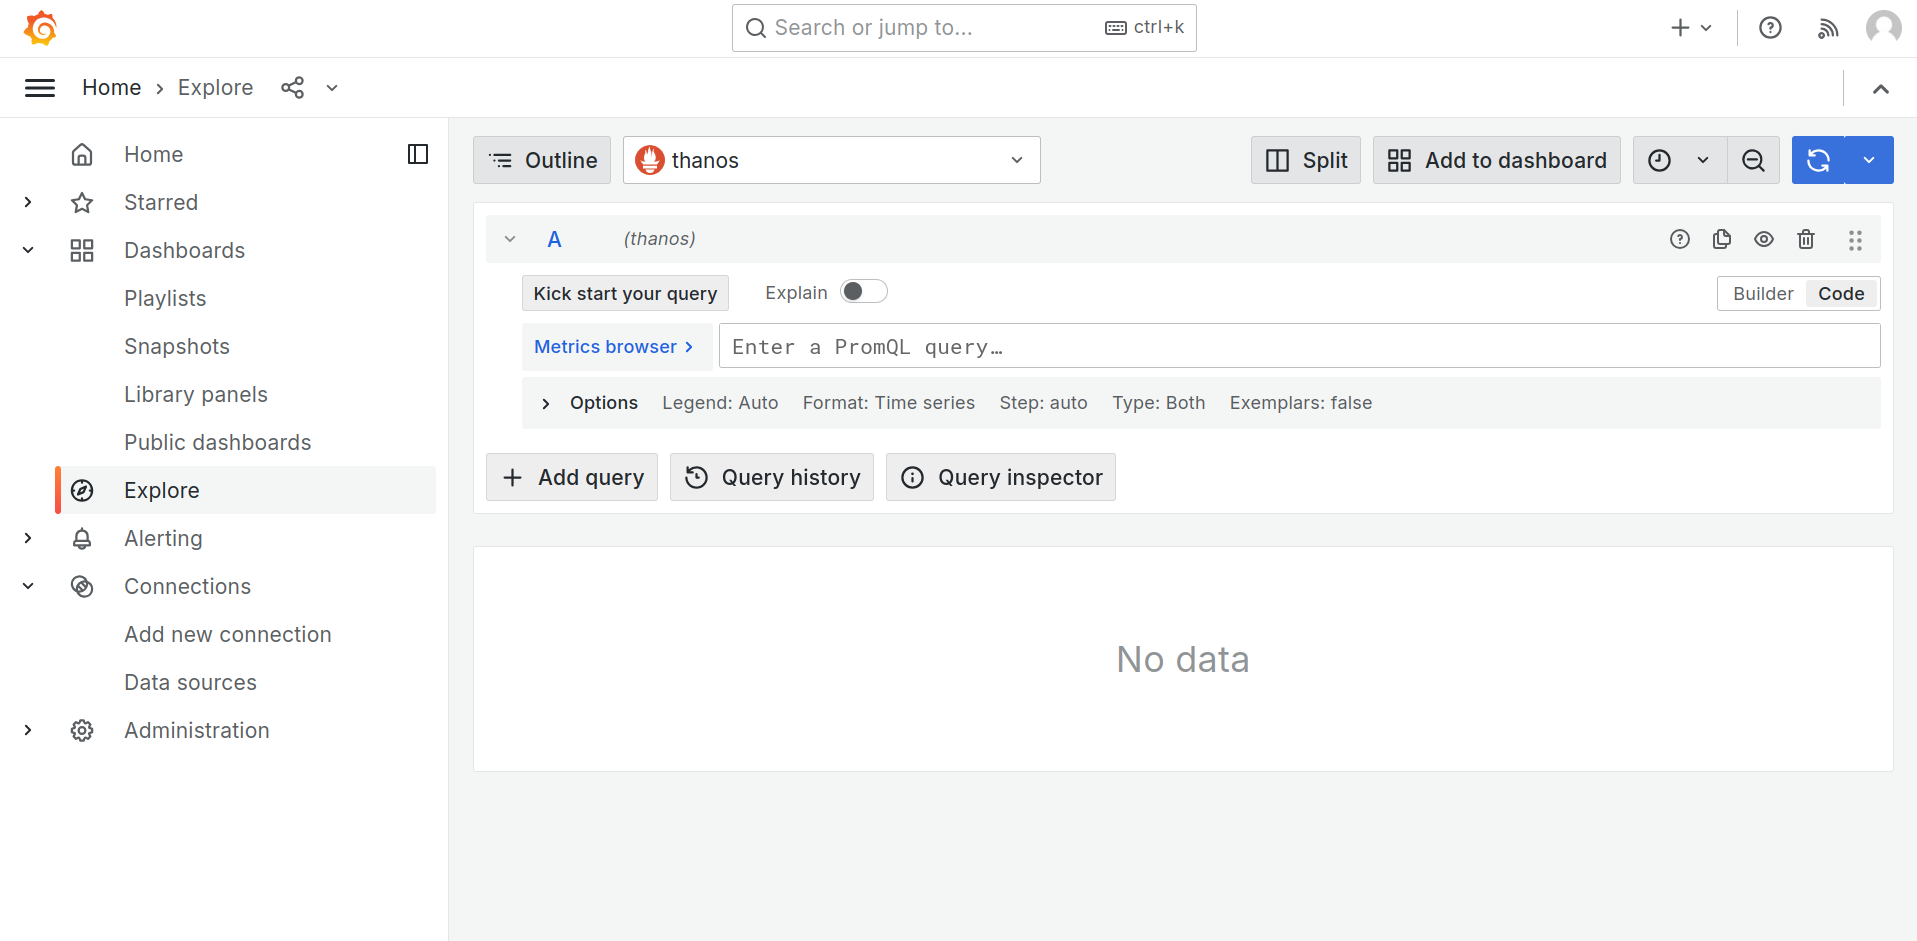
Here's how to use it:
- Click Explore in the left-side menu.
- Choose the data source you want to query from the dropdown menu.
- Write your query in the query editor using PromQL.
- Set the time range for your query.
- Click the Refresh icon to run the query.
- View the results of your query in a tabular format.
Code View provides more flexibility and control over your queries, especially if you're familiar with the query language of your data source.
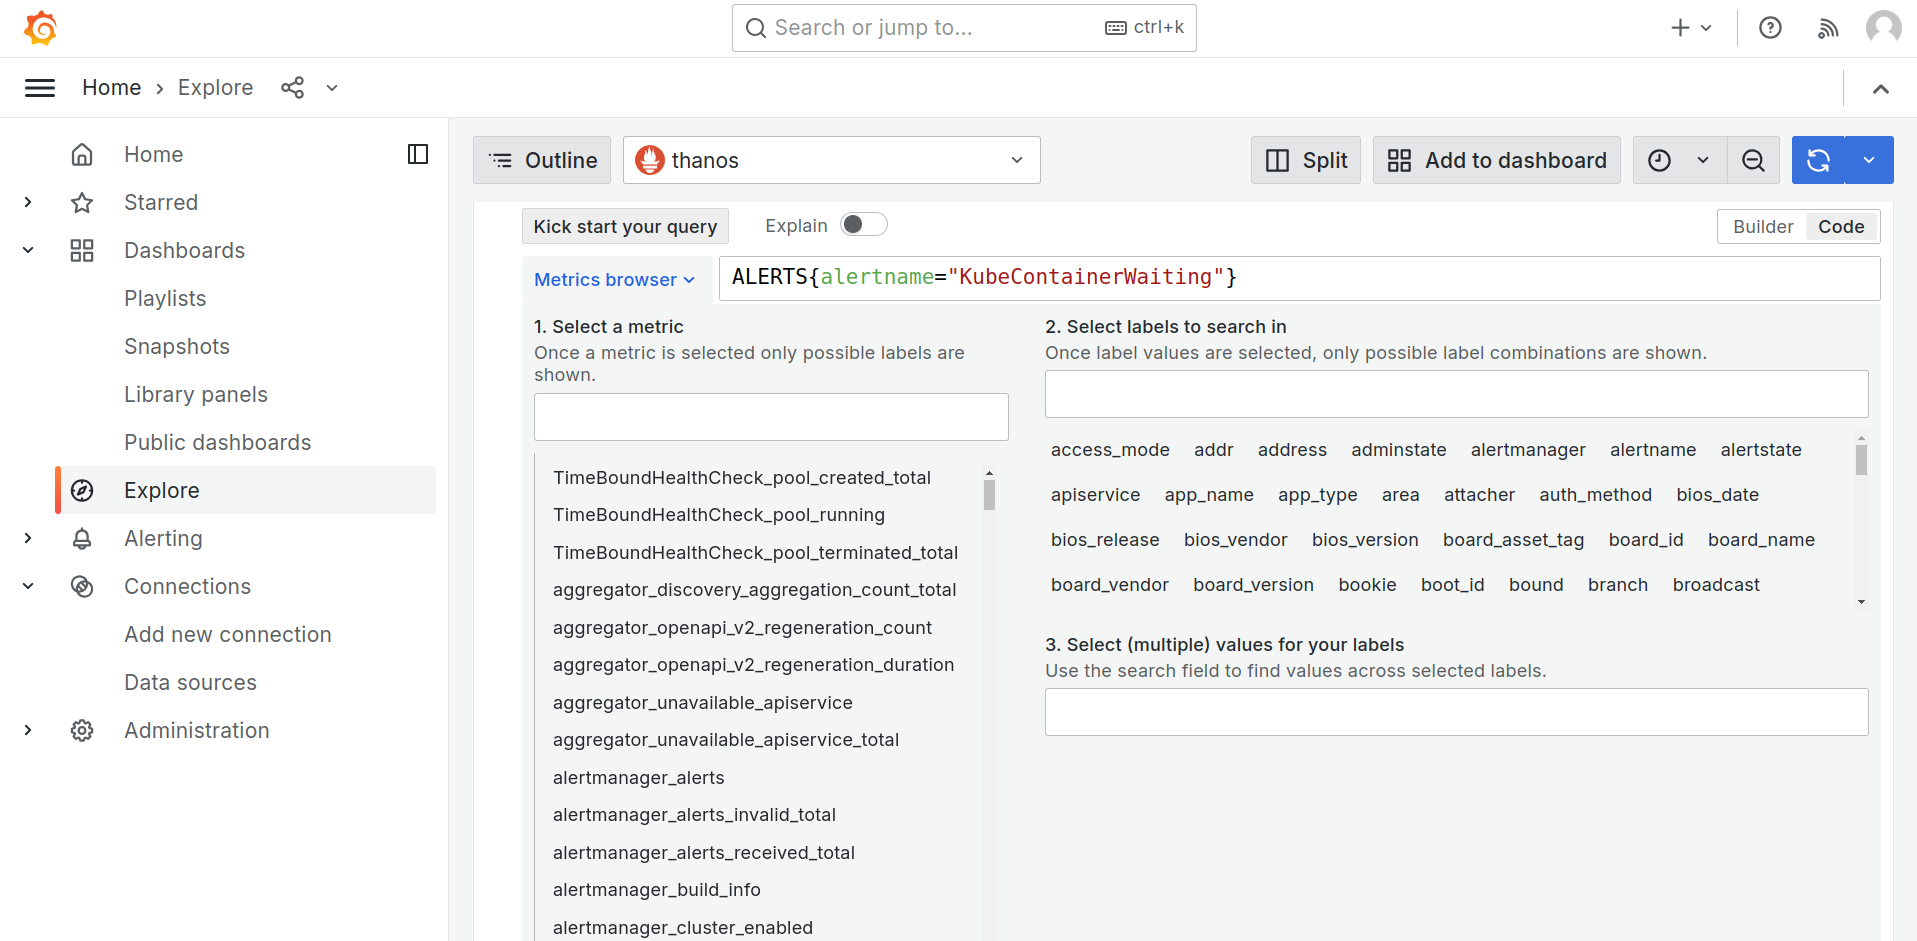
You can also manually select the metrics, labels, and values which will automatically generate the query in PromQL using the metrics browser.
Set up Alerting
Alerting in Grafana allows you to define rules and conditions based on your data queries to trigger notifications or take actions when certain criteria are met. This section guides you to setting up and managing alerts within Grafana.
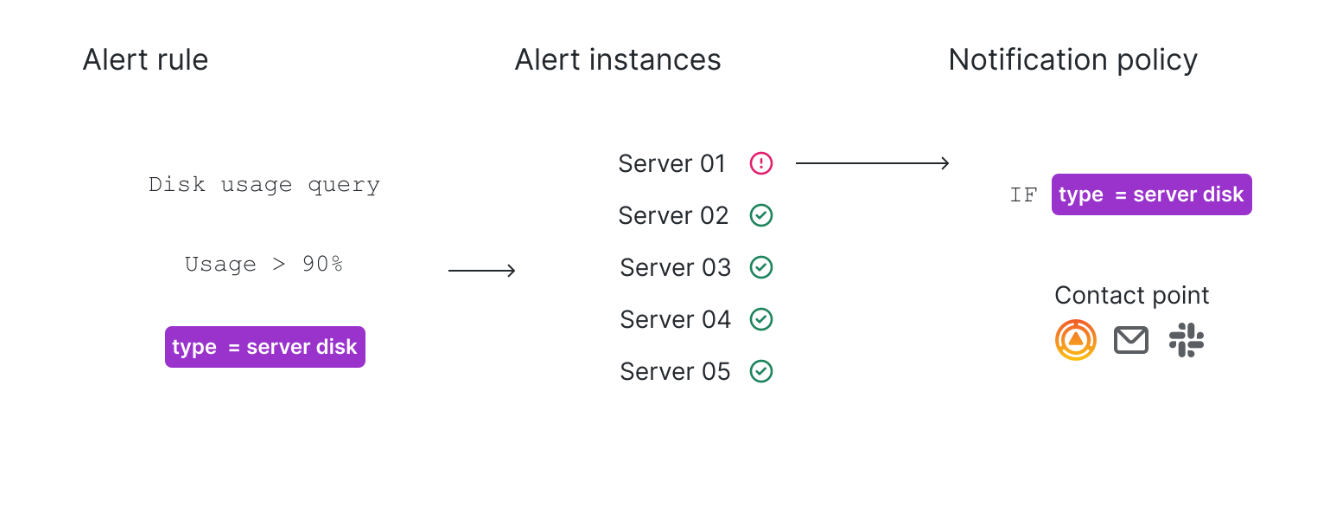
Before you begin Configure your Prometheus data source.
To set up Alerting, you need to:
-
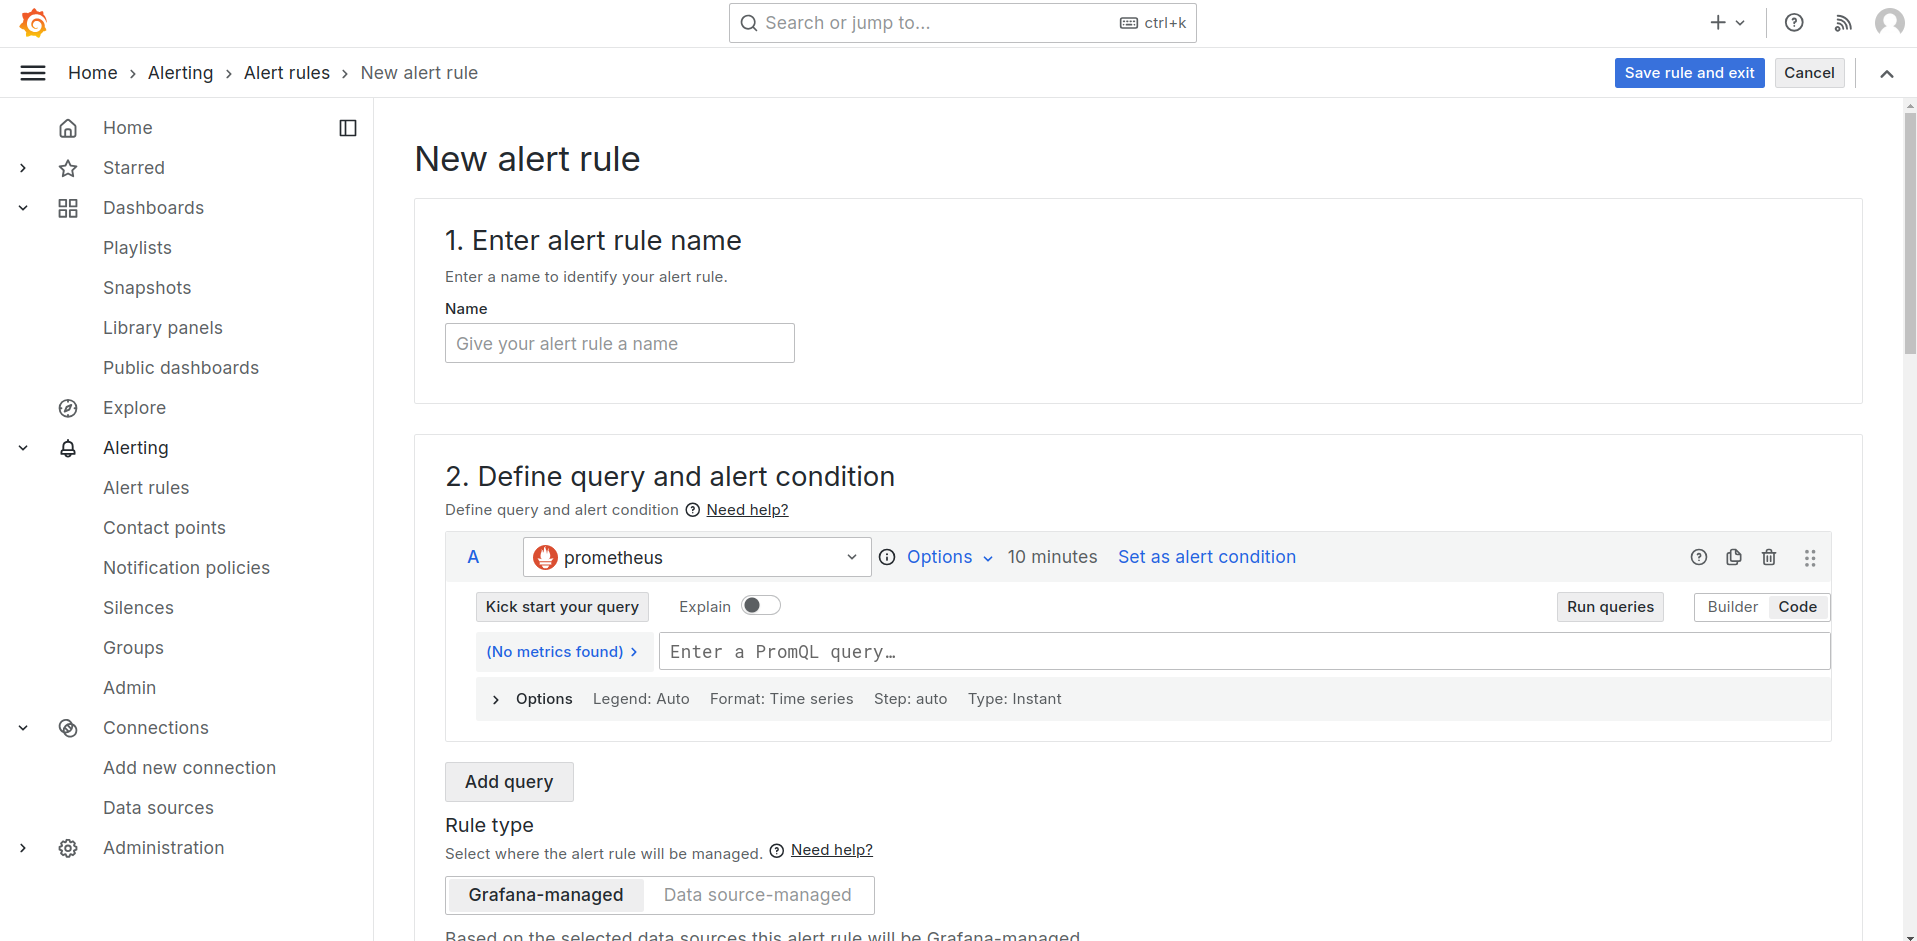
Configure alert rules
-
Create Grafana-managed or Mimir/Loki-managed alert rules and recording rules.
-
-
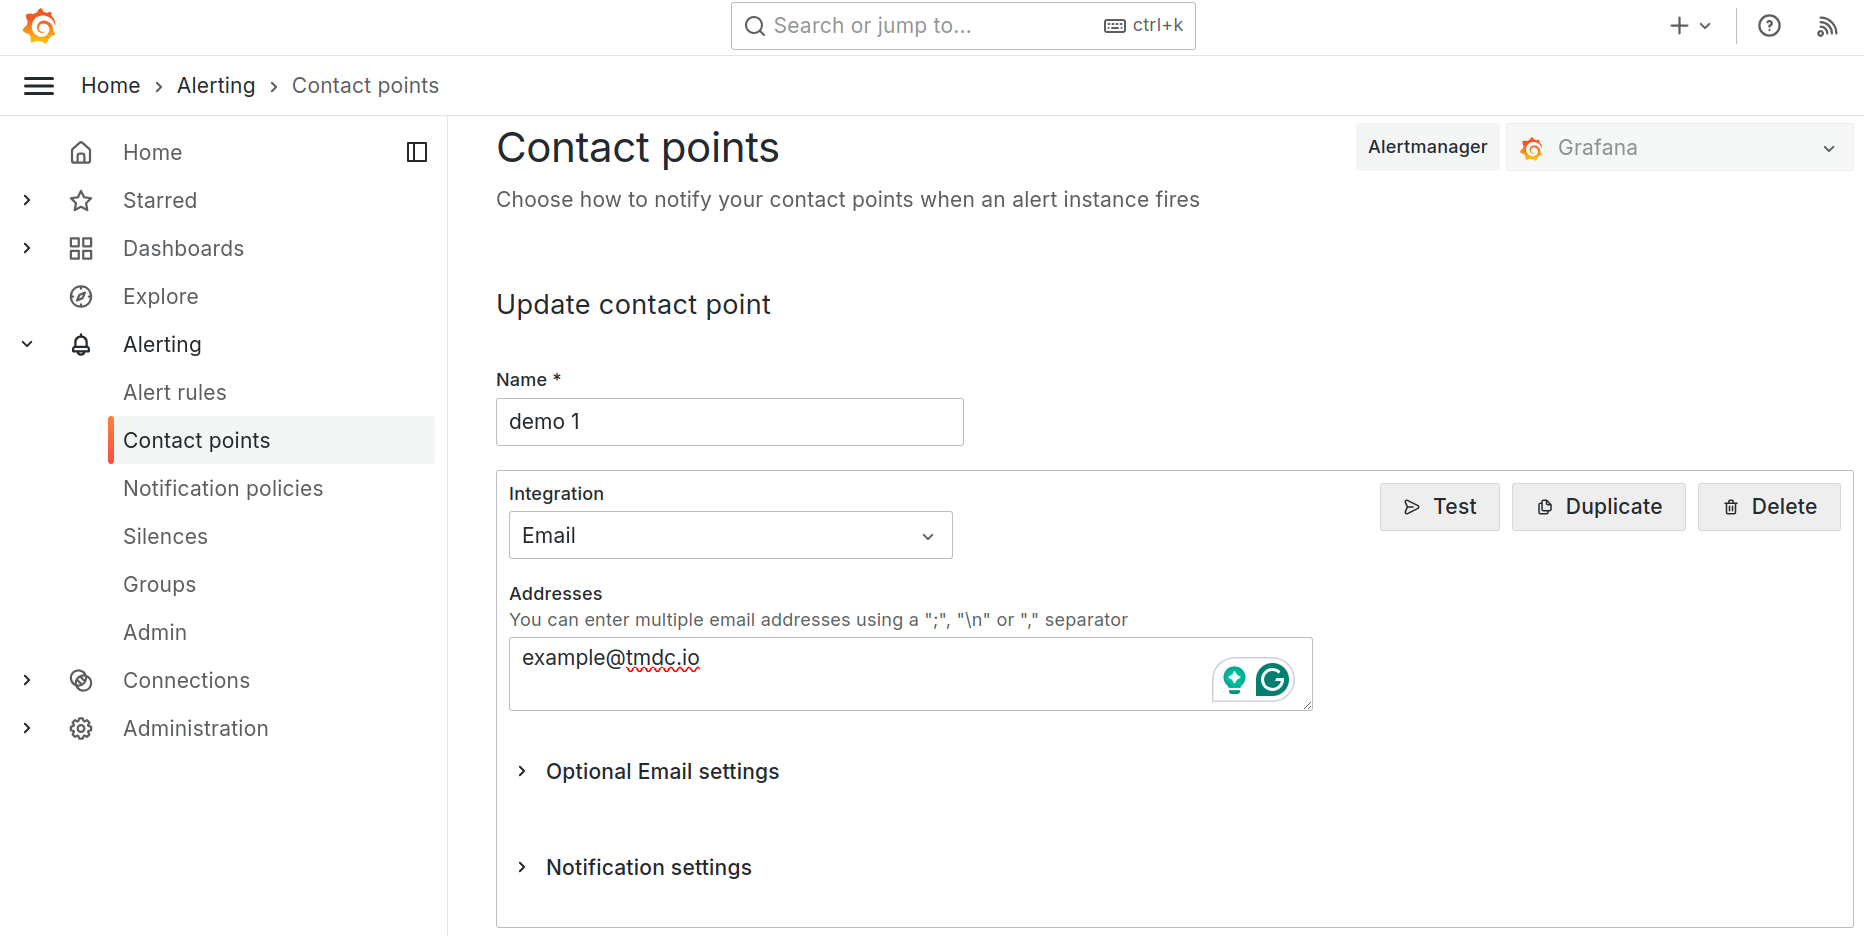
Configure contact points
- Check the default contact point and update the email address.
-
[Optional] Add new contact points and integrations.
-
To verify the contact points, click on the Test, which will send a test alert to the mentioned email.
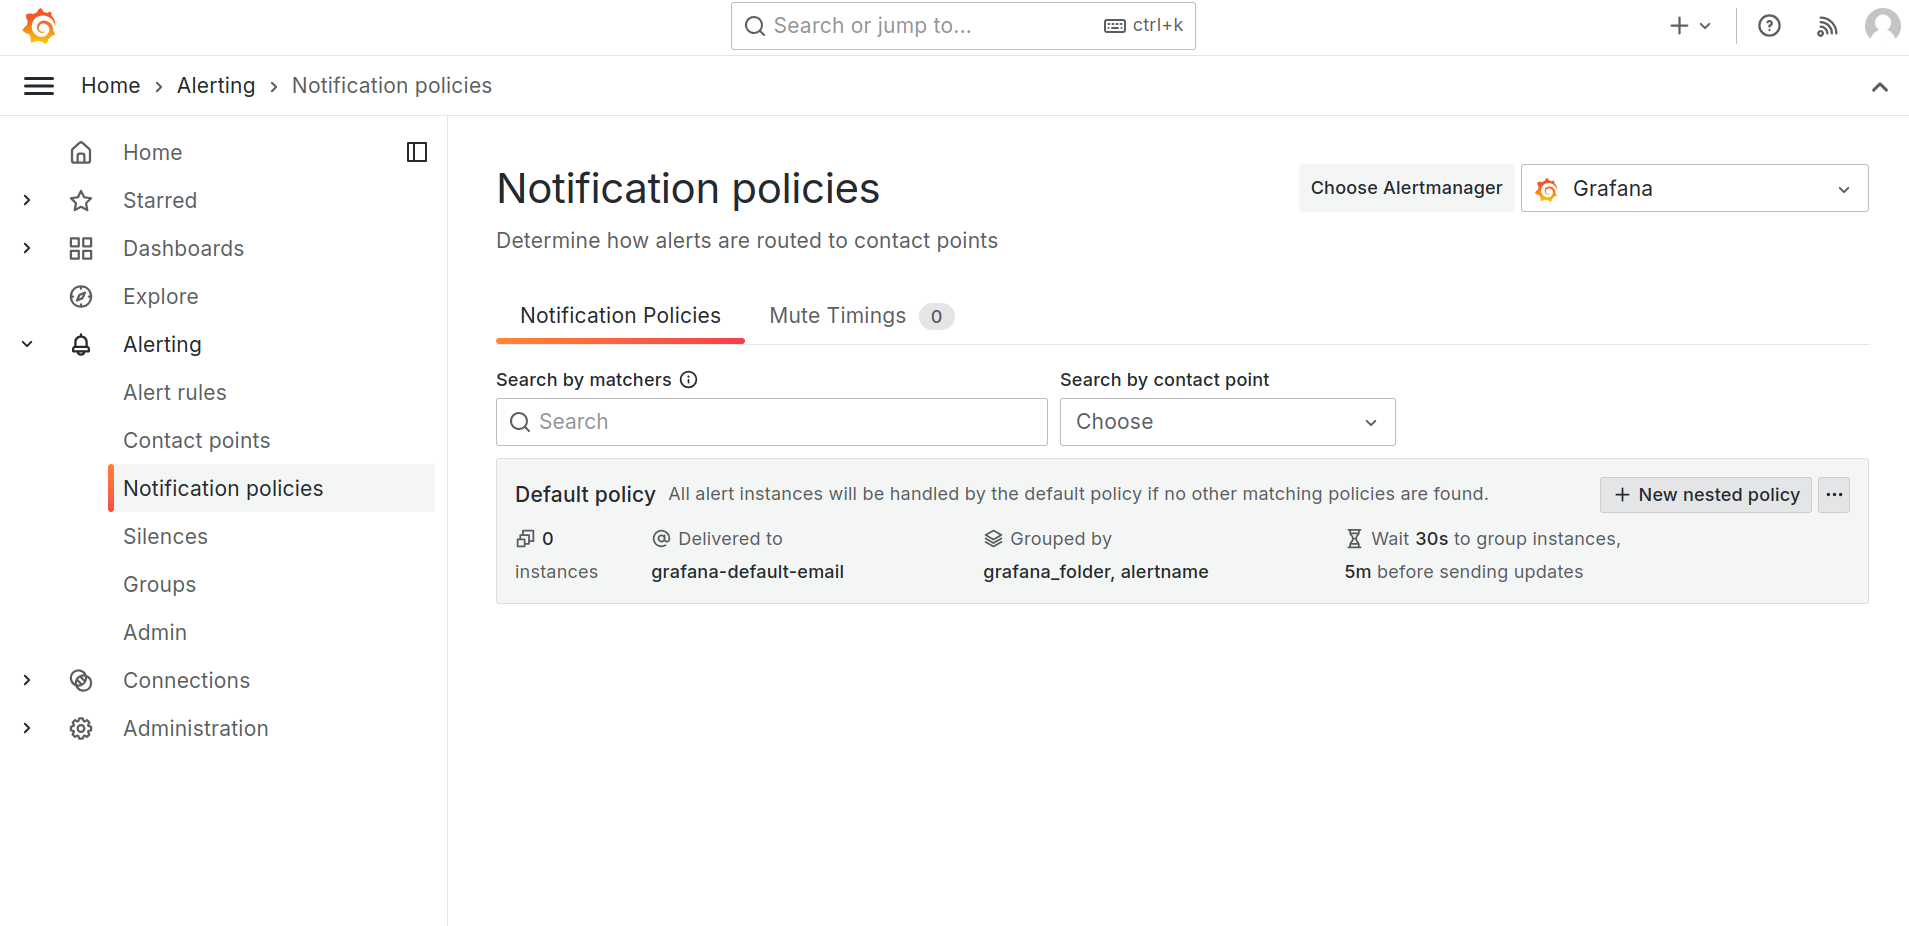
- Configure notification policies
-
Check the default notification policy.
-
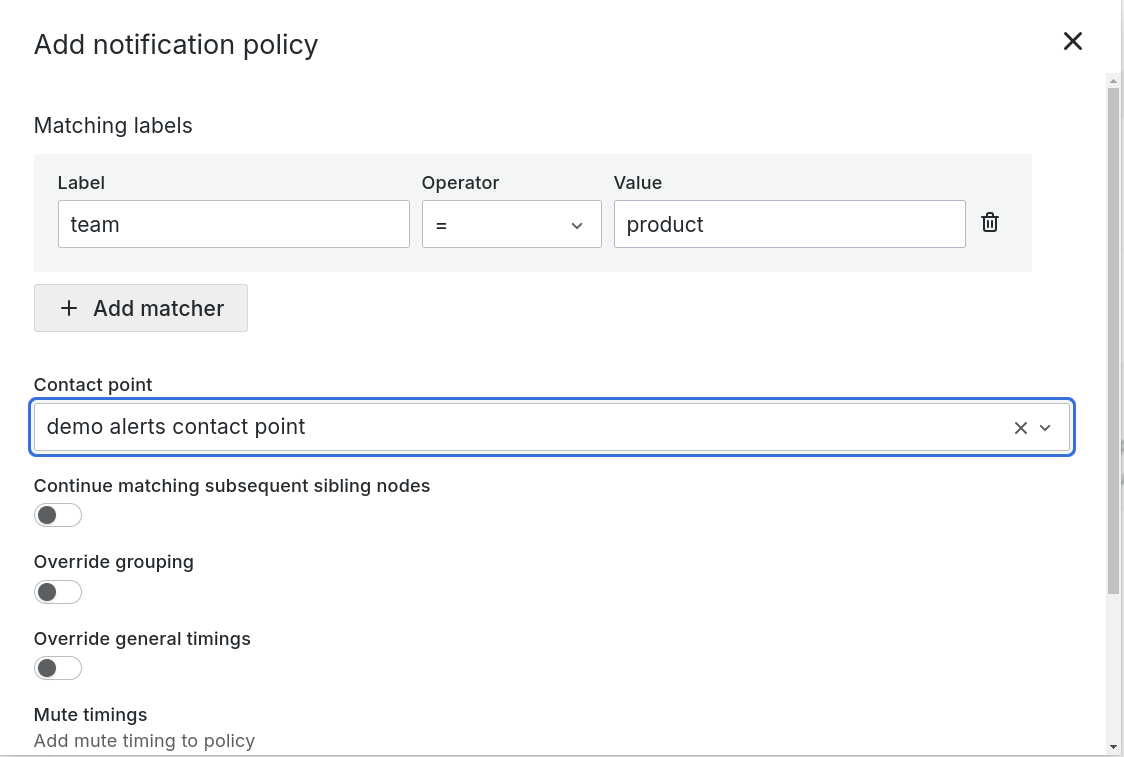
[Optional] Add additional nested policies.
-
[Optional] Add labels and label Values to control alert routing.
-
Connect alerts to the dashboard and panel
- Go to the existing alert rules, click on Link dashboard and panel, then select the dashboard and panels of your choice to link the alert.
-
After successfully linking the alert to the dashboard or panel, you can check the alert status directly on the dashboard or panel.
For more information on managing alerts, refer to Manage Alerts.