Pipeline observability
In this topic, you will learn how to configure a Monitor Resource to generate incidents whenever a workflow fails and set up a Pager Resource to send notifications for these incidents.
Scenario
Imagine you are a Data Product Developer, responsible for ensuring seamless workflow operations and prompt incident detection. Recently, your team has faced delays in identifying workflow failures, resulting in slower response times and reduced efficiency. To address this challenge and enhance observability, you decide to leverage the Monitor Resource in DataOS.
Quick concepts
-
Monitor Resource: A key component of DataOS' observability system, designed to track specific events or metrics and trigger incidents when predefined thresholds or conditions are met.
-
Pager Resource: A notification tool in DataOS that sends real-time alerts to designated channels, enabling proactive incident management and swift response to workflow issues.
Configuring Monitor
Let us consider that for the given scenario, you decide to configure a Monitor for a workflow named wf-purchase-data. Your goal is to receive an incident notification every time the workflow status changes to 'failed'. Here’s how you can set it up:
Step 1: Define Resource metadata
Begin by defining the metadata for the Monitor Resource. This metadata ensures the monitor is uniquely identifiable and properly tagged.
# Resource meta section
name: runtime-monitor
version: v1alpha
type: monitor
tags:
  - dataos:type:resource
  - dataos:layer:user
description: Attention! workflow run is succeeded.
layer: user
Step 2: Specify Monitor configuration
Next, Configure the Monitor-specific section. You can set a schedule to check the workflow status every 3 minutes and defines the incident details to be triggered upon detecting the desired condition.
# Monitor-specific section
monitor:
  schedule: '0 7 * * 1-5'  # Check at 7 am (UTC) Mon-Fri
  incident:
    name: workflowrunning
    severity: high
    incidentType: workflowruntime
  type: report_monitor
Step 3: Configure the Report Monitor specification
To track the workflow runtime status, set up the Report Monitor’s report specification. You need to use the DataOS API endpoint to fetch runtime details and define the condition to match the “failed” status.
# Report Monitor specification
  report:
    source:
      dataosInstance:
        path: /collated/api/v1/reports/resources/runtime?id=workflow:v1:wf-purchase-data:public
    conditions:
      - valueComparison:
          observationType: workflow-runs
          valueJqFilter: '.value[] | {completed: .completed, phase: .phase} | select (.completed | fromdateiso8601 > (now-3600)) | .phase'
          operator: equals
          value: failed
Testing the configuration
Before finalizing the monitor, test the API endpoint using a tool like Postman. Replace placeholders such as resource name, version, and workspace with actual values to ensure the API returns the expected runtime status. Once satisfied, you can proceed to deploy the configuration.
Deploying the Report Monitor
Now you can apply the YAML configuration using the DataOS CLI:
Monitoring Workflow failure
With the Monitor in place, you receive high-severity incident alerts whenever the scan-data-product-test workflow succeeds. This ensures that your team can respond promptly, optimizing their operational efficiency.
Click here to see the complete Monitor manifest file
name: failedworkflowmonitor
version: v1alpha
type: monitor
tags:
  - dataos:type:resource
  - workflow-failed-monitor
description: Attention! The workflow in the Public Workspace has experienced a failure.Please be rest assured,We are currently investigating the cause of the failure.Your patience is appreciated as we work to resolve this issue.Please refer to the logs for additional information.
layer: user
monitor:
  schedule: '0 7 * * 1-5'
  type: report_monitor
  report:
    source:
      dataosInstance:
        path: /collated/api/v1/reports/resources/runtime?id=workflow:v1:wf-purchase-data:public
    conditions:
      - valueComparison:
          observationType: workflow-runs
          valueJqFilter: '.value[] | {completed: .completed, phase: .phase} | select (.completed | fromdateiso8601 > (now-3600)) | .phase'
          operator: equals
          value: failed
  incident:
    name: monitorbuildfailed
    severity: high
    incident_type: monitorerrorworkflow
Configuring Pager
The Pager, together with the Monitor Resource, forms the core of DataOS Observability, enabling proactive alerts based on threshold metrics and events.
In DataOS, a Pager Resource allows data developers to define criteria for identifying incidents within the incident stream. It evaluates predefined conditions against incoming data and, upon detecting a match, triggers an alert that is sent to a user-specified destination.
Create a Pager manifest
To create a Pager, the first step is to create a Pager manifest file.
The Pager manifest file is structurally comprised of the following sections:
Step 1: Define Resource metadata
In DataOS, a Pager is classified as a Resource type. The Resource meta section in a manifest file contains metadata attributes that are universally applicable to all DataOS Resources.
name: failedworkflowpager
version: v1alpha
type: pager
tags:
  - dataos:type:resource
  - workflow-failed-pager
description: This is for sending Alerts on Microsoft Teams Alert Test Channel.
workspace: public
Step 2: Configure the Pager-specific section
The Pager-specific section of a Pager manifest comprises attributes-specific to the Pager Resource. This comprise of two separate sections.
Define conditions
Conditions are defined based on the incident payload, which is used to match specific criteria. Each condition is represented as a YAML mapping, uniquely identified by a combination of three attributes: valueJqFilter, operator, and value. You can provide multiple conditions.
pager:
  conditions:
    - valueJqFilter: .properties.name
      operator: equals
      value: monitorbuildfailed
    - valueJqFilter: .properties.incident_type
      operator: equals
      value: monitorerrorworkflow
Define output
An output is the destination for alert notifications triggered by the Pager Service. Supported destinations include Email, Microsoft Teams, and Web Hook.
output:
webHook:
url: {{webhook url}}
verb: post
headers:
content-type: application/json
bodyTemplate: |
{
"@type": "MessageCard",
"summary": "Workflow has Failed",
"themeColor": "0076D7",
"sections": [
{
"activityTitle": "Dear Team,",
"activitySubtitle": "âš ï¸ Our system detected an issue with the workflow and was unable to complete the process as expected.",
"facts": [
{
"name": " The following workflow has failed:",
"value": "{{ index (splitn ":" 4 .ReportContext.ResourceId) "_2" }}"
},
{
"name": " Failure Time:",
"value": "{{ .CreateTime }}"
},
{
"name": " Severity:",
"value": "{{ .Properties.severity }}"
},
{
"name": " Run Details:",
"value": "<a href=\"https://dataos-training.dataos.app/operations/user-space/resources/resource-runtime?name={{ index (splitn ":" 4 .ReportContext.ResourceId) "_2" }}&type=workflow&workspace=public\">Operation</a>"
},
{
"name": " Logs:",
"value": "<a href=\"https://dataos-training.dataos.app/metis/resources/workflow/dataos.public.{{ index (splitn ":" 4 .ReportContext.ResourceId) "_2" }}/run_history\">Metis</a>"
}
]
},
{
"text": "We understand the importance of timely and accurate data processing, and our team is actively working to resolve the issue and get the pipeline back up and running as soon as possible. In the meantime, please be aware that the data processing for the affected workflow may be delayed or incomplete.\n\nIf you have any questions or concerns, please do not hesitate to reach out to us on our support portal. We will keep you updated on the status of the resolution efforts."
},
{
"text": "Best regards,\n\nThe Modern Data Company"
}
]
}
Click here to view the complete manifest file
name: failedworkflowpager
version: v1alpha
type: pager
tags:
- dataos:type:resource
- workflow-failed-pager
description: This is for sending Alerts on Microsoft Teams Alert Test Channel.
workspace: public
pager:
conditions:
- valueJqFilter: .properties.name
operator: equals
value: monitorbuildfailed
- valueJqFilter: .properties.incident_type
operator: equals
value: monitorerrorworkflow
output:
webHook:
url: {{webhook-url}}
verb: post
headers:
content-type: application/json
bodyTemplate: |
{
"@type": "MessageCard",
"summary": "Workflow has Failed",
"themeColor": "0076D7",
"sections": [
{
"activityTitle": "Dear Team,",
"activitySubtitle": "âš ï¸ Our system detected an issue with the workflow and was unable to complete the process as expected.",
"facts": [
{
"name": " The following workflow has failed:",
"value": "{{ index (splitn ":" 4 .ReportContext.ResourceId) "_2" }}"
},
{
"name": " Failure Time:",
"value": "{{ .CreateTime }}"
},
{
"name": " Severity:",
"value": "{{ .Properties.severity }}"
},
{
"name": " Run Details:",
"value": "<a href=\"https://dataos-training.dataos.app/operations/user-space/resources/resource-runtime?name={{ index (splitn ":" 4 .ReportContext.ResourceId) "_2" }}&type=workflow&workspace=public\">Operation</a>"
},
{
"name": " Logs:",
"value": "<a href=\"https://dataos-training.dataos.app/metis/resources/workflow/dataos.public.{{ index (splitn ":" 4 .ReportContext.ResourceId) "_2" }}/run_history\">Metis</a>"
}
]
},
{
"text": "We understand the importance of timely and accurate data processing, and our team is actively working to resolve the issue and get the pipeline back up and running as soon as possible. In the meantime, please be aware that the data processing for the affected workflow may be delayed or incomplete.\n\nIf you have any questions or concerns, please do not hesitate to reach out to us on our support portal. We will keep you updated on the status of the resolution efforts."
},
{
"text": "Best regards,\n\nThe Modern Data Company"
}
]
}
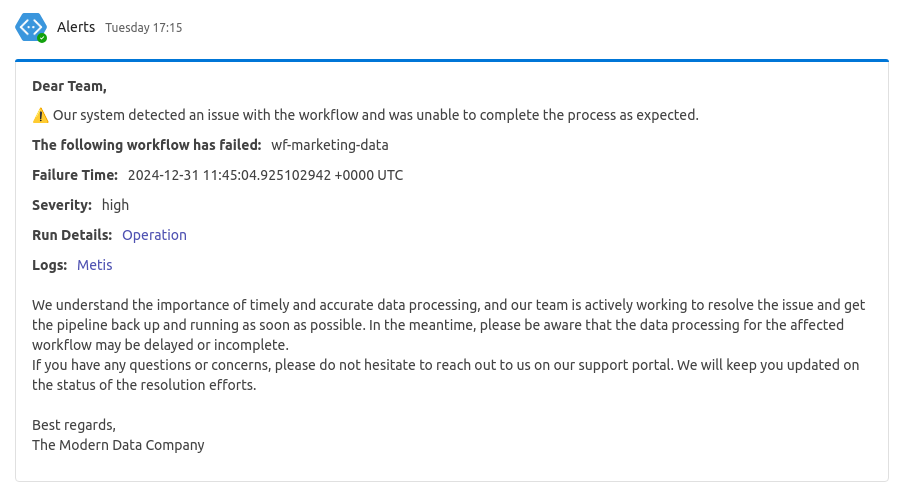
In case the Workflow fails, you will get the following notification in the configured channel.
FAQs
Q1: How are monitors scheduled?
Monitors are scheduled to run at specific times using a cron-like expression.
Q2: How do pagers connect to monitors? Pagers connect to monitors by matching the incident details (name, severity, incident type) generated by the Monitor.
Q3: Can Pagers be scheduled? No, Pagers are not scheduled. They listen for incidents generated by the Monitors.
Q4: Where are incidents stored? Incidents are stored in a Pulsar topic, not exposed on the UI, but accessible with a provided address.
Q5: Why are Monitors and Pagers separate Resources? Monitors and Pagers are separate Resources because they serve distinct functions. Monitors detect issues and generate incidents, while Pagers send alerts based on those incidents. This separation gives customers flexibility—they can choose to use only Monitors, integrate with third-party alerting tools like Datadog, or rely on DataOS Pager based on their needs.