Excel via Power BI
This topic introduces the methods to connect with Excel via PowerBI to create visuals and perform analysis.
Scenario
Use Excel's robust data visualization and analytics capabilities to connect with 'Product Affinity'. Build real-time, interactive dashboards that provide insights into customer buying patterns and help forecast demand, enabling proactive marketing decisions.
Use the following method to interact with the Excel via PowerBI.
Using Analyze in Excel
Step 1: Install Analyze in Excel plugin in PowerBI
Visit the Analyze in Excel for Power BI Desktop link and follow the instructions to download and install the necessary extension.
Step 2: Use the Analyze in Excel feature
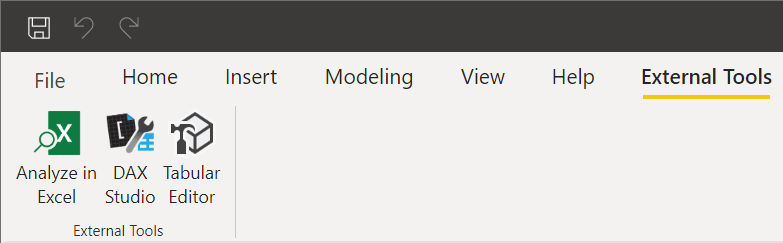
Once the extension is installed, a new tab labeled 'Analyze in Excel' will appear in Power BI Desktop.
Step 3: Export to Excel
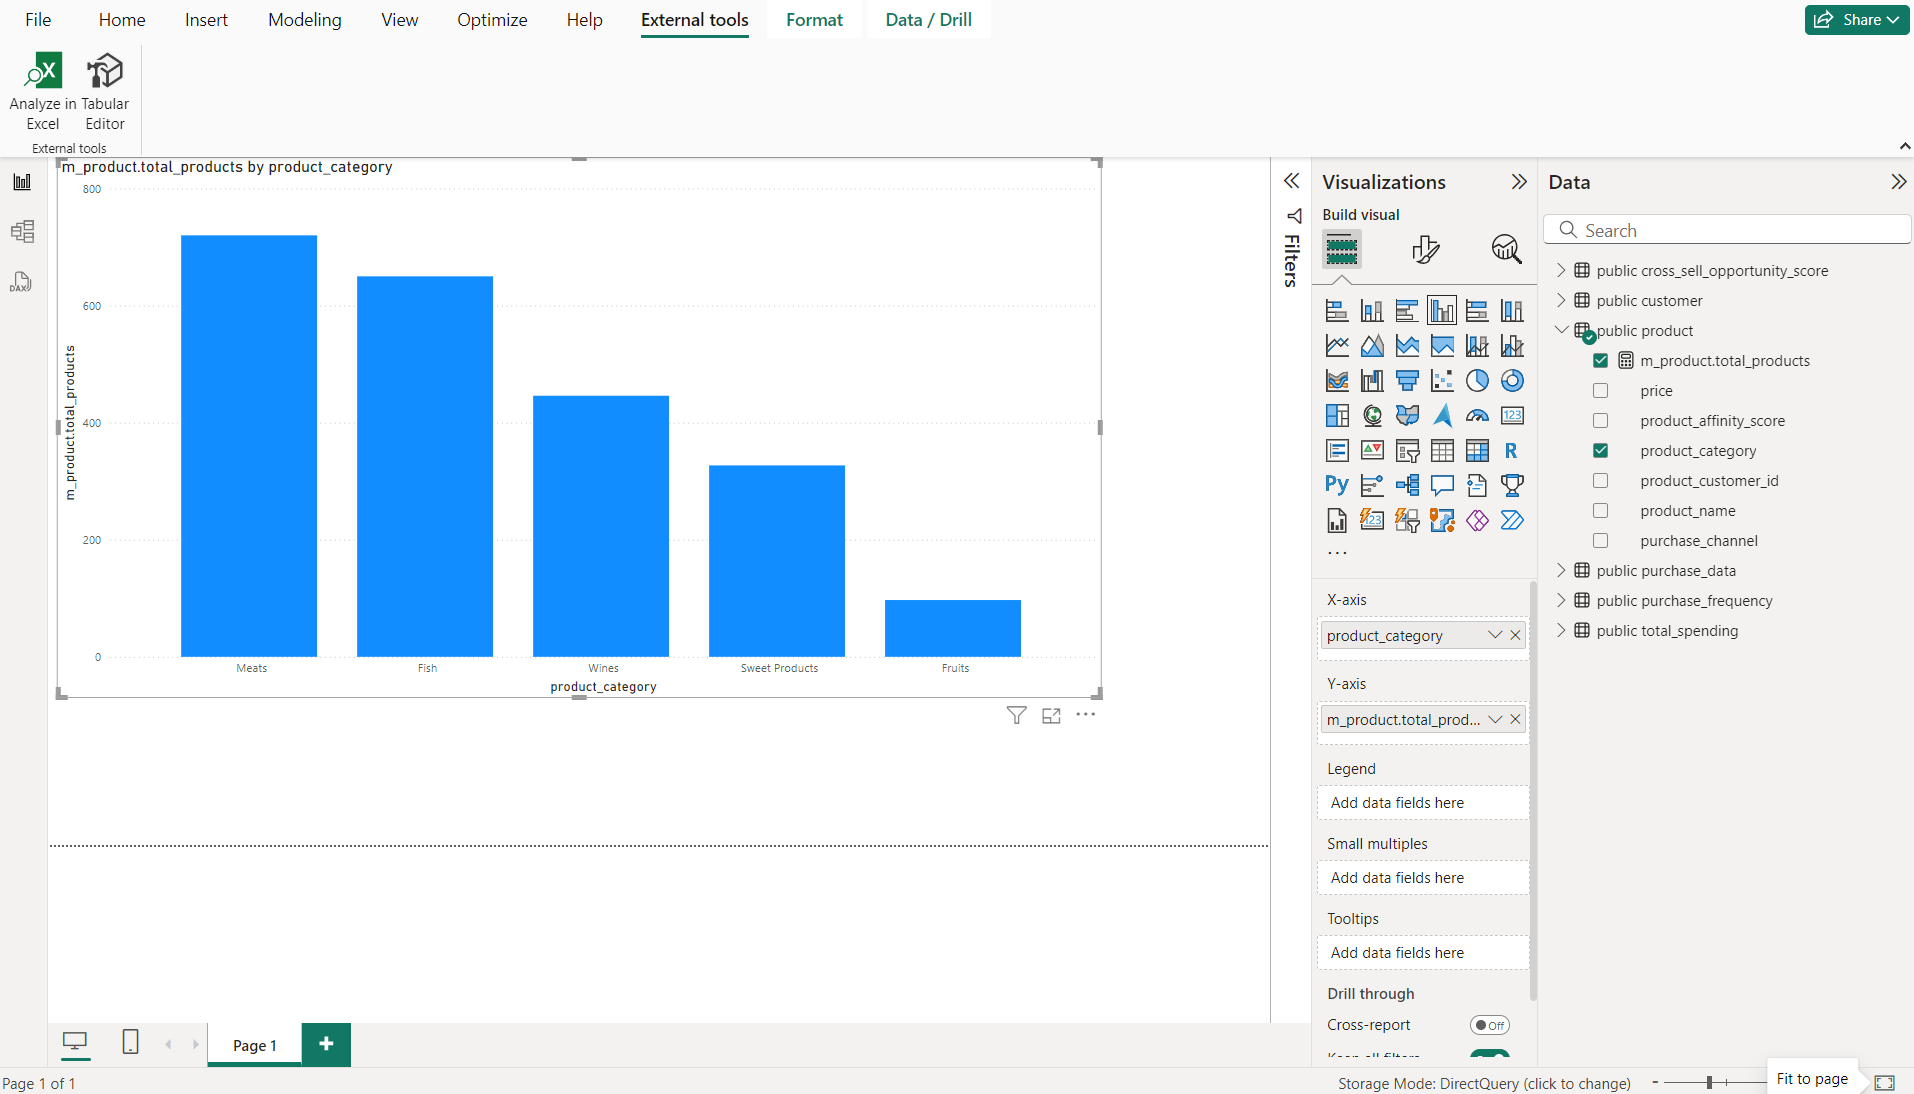
Click on the 'Analyze in Excel tab. This action will open Excel and establish a connection to the Power BI dataset or report.
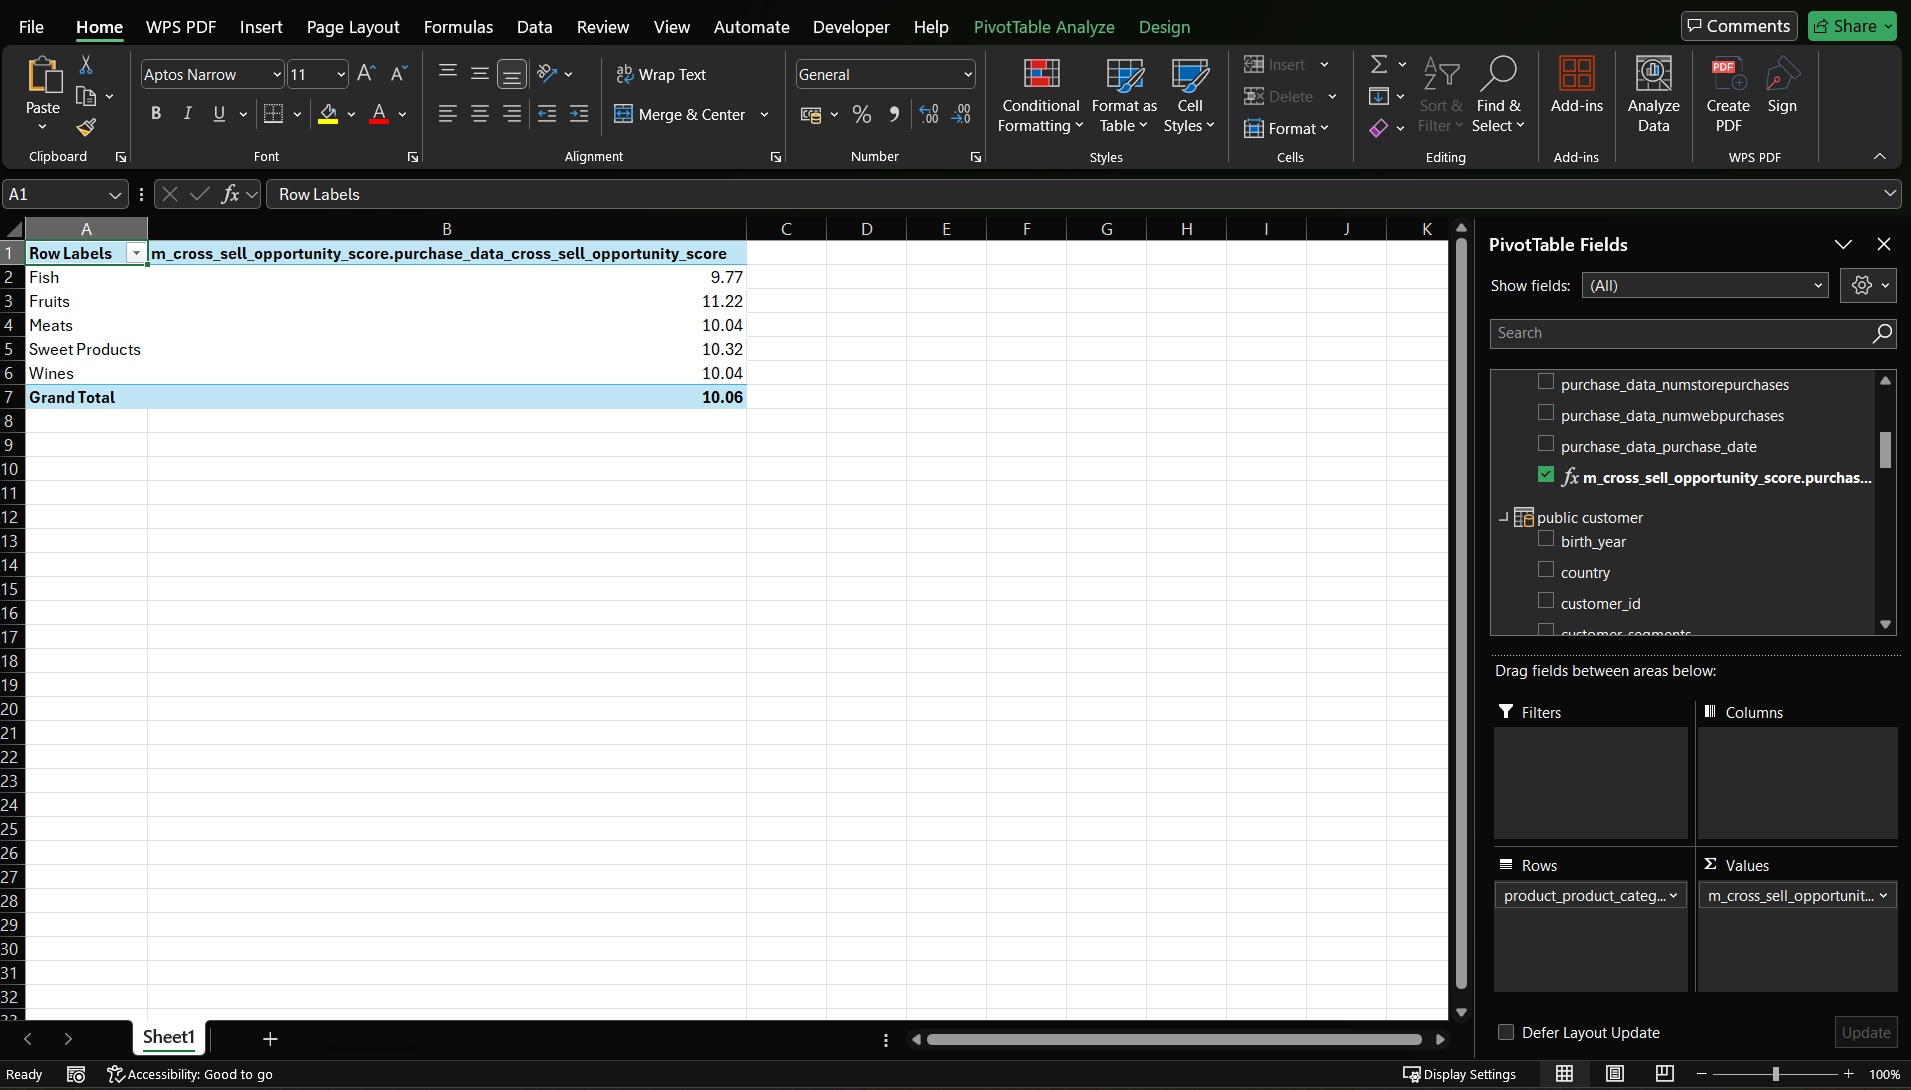
Step 2: Work in Excel
In Excel, you can now use PivotTables, charts, and other Excel features to analyze the data coming from Power BI.