Integrate semantic model with Power BI
Overview
In this guide, you will learn how to integrate a Data Product with Power BI and activate it to build rich, interactive dashboards.
Prerequisite
Power BI Desktop installed on the system(version released after June 15, 2023).
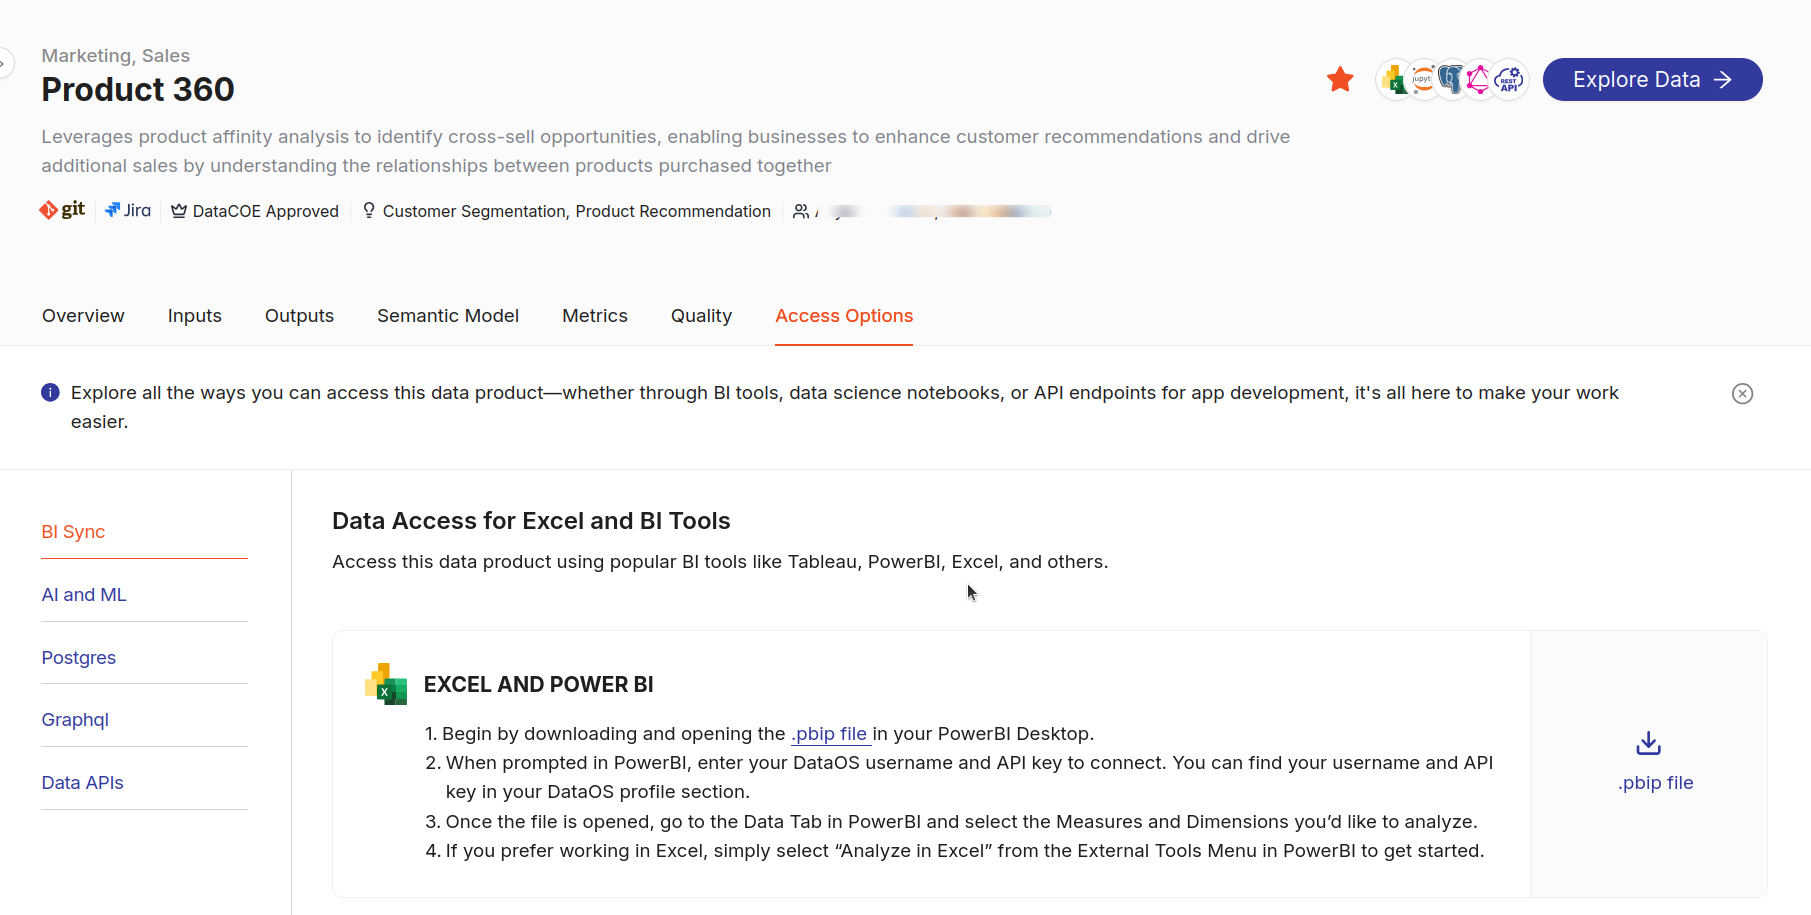
Step 1: Navigate to the BI sync option
To start the integration, go to the 'Access Options' tab and scroll to the 'Excel and PowerBI' option in the 'BI Sync' section. Click on the 'Download .pbip File' button to initiate the download of a ZIP folder.
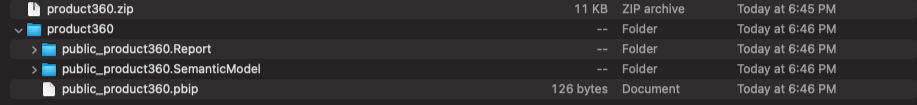
Step 2: Extract the files
After downloading the ZIP file, extract it to a directory on your local machine. Inside the extracted folder, you will find the essential files that help maintain semantic synchronization between the Data Product and Power BI.
The folder stores the main components of a Power BI project for syncing the Lens Model (here Product Affinity), including folders like the.Report and .SemanticModel.
Following is a brief description of each:
-
public_productaffinity.Report: This folder contains
definition.pbirfile related to the report definition in Power BI. It stores the report metadata such as the version and dataset reference in JSON format. -
public_productaffinity.SemanticModel: This folder contains files that define the underlying data model for Power BI project. The semantic model plays a crucial role in managing how Power BI interacts with data, setting up relationships, and measures.
-
definition.bism: Contains the overall definition of a semantic model and core settings. This file also specifies the supported semantic model definition formats through the 'version' property.
-
model.bim: The model.bim file is a JSON file that contains the Tabular Model Scripting Language (TMSL) definition of a Power BI semantic model. It's used to create a database from scratch by defining objects such as measures, tables, and connection sources.
-
-
public_productaffinity.pbip: The
.pbipfile contains a pointer to a report folder, opening a.pbipopens the targeted report and model.
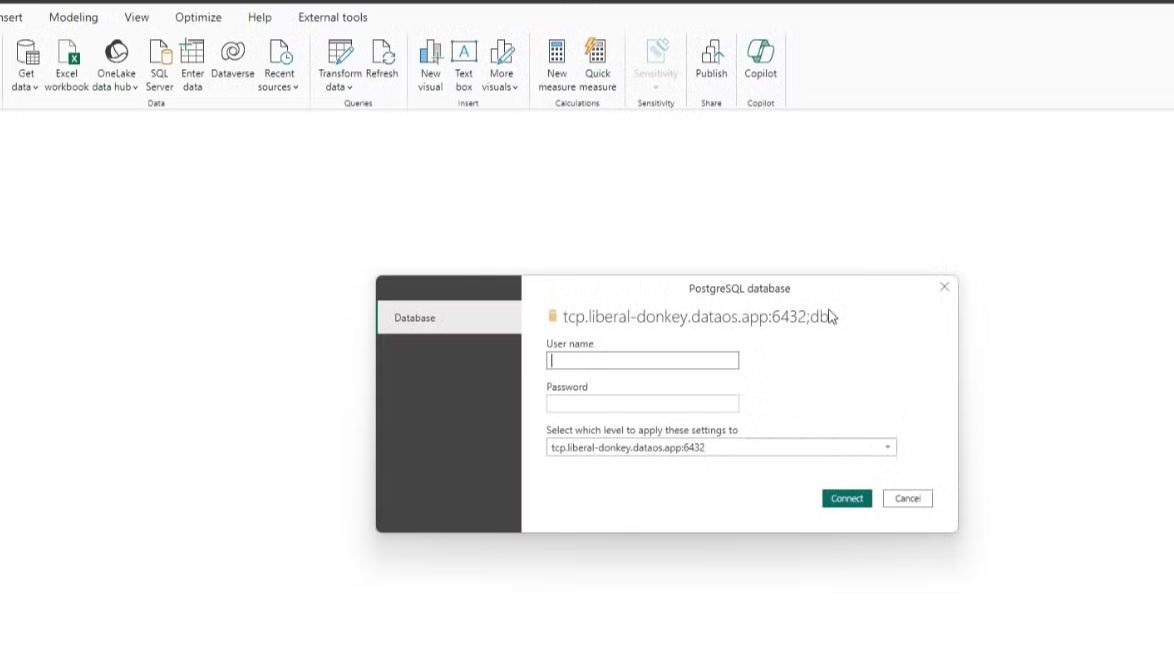
Step 3: Open the file in Power BI and connect
Open the public_productaffinity.pbip file in Power BI. A popup will appear prompting you to enter your 'DataOS username' and 'API key'.
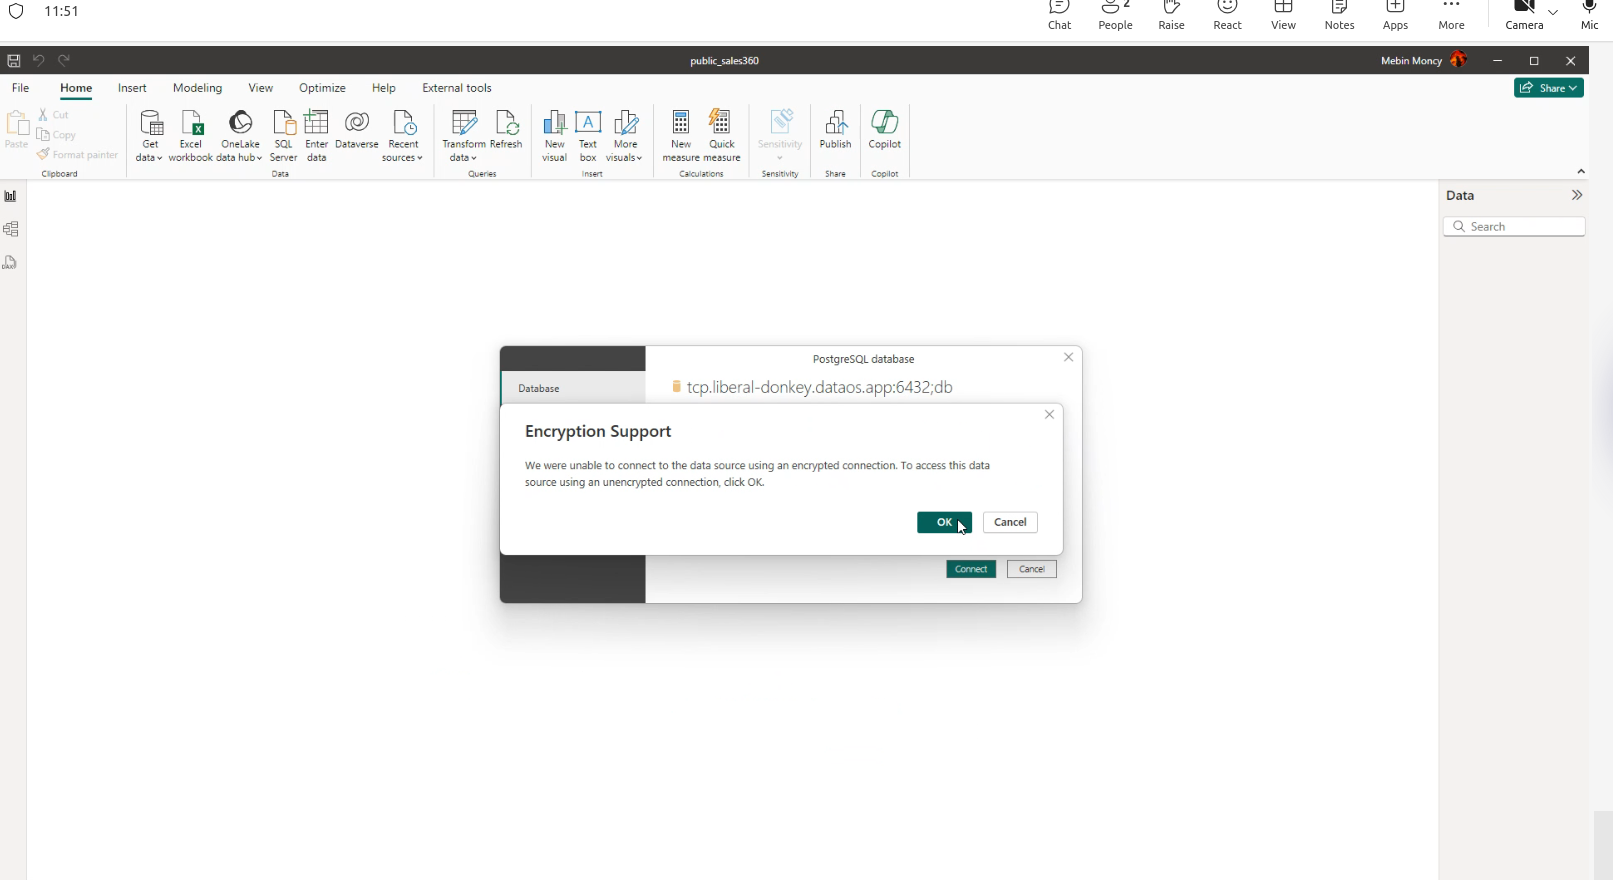
After entering your credentials, click 'Connect'. A confirmation popup will appear; click 'OK' to proceed.
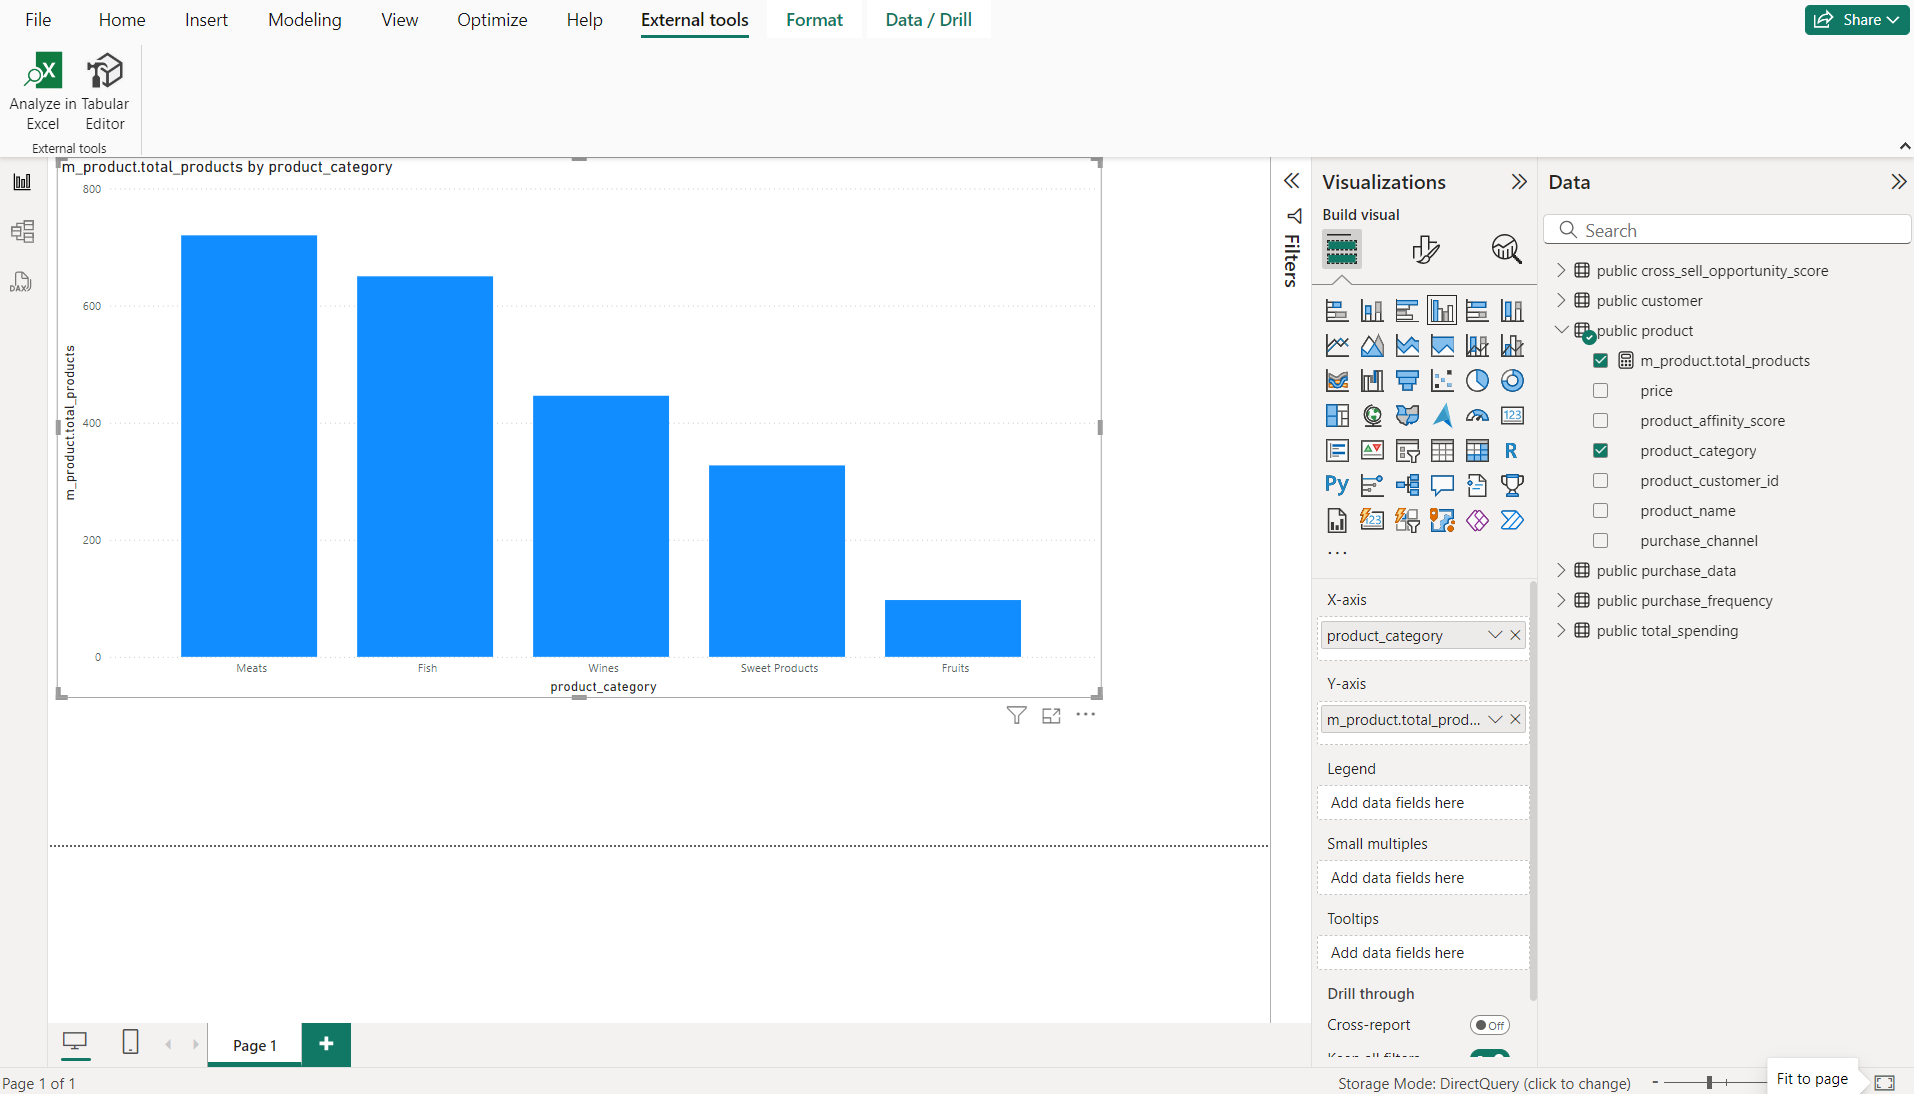
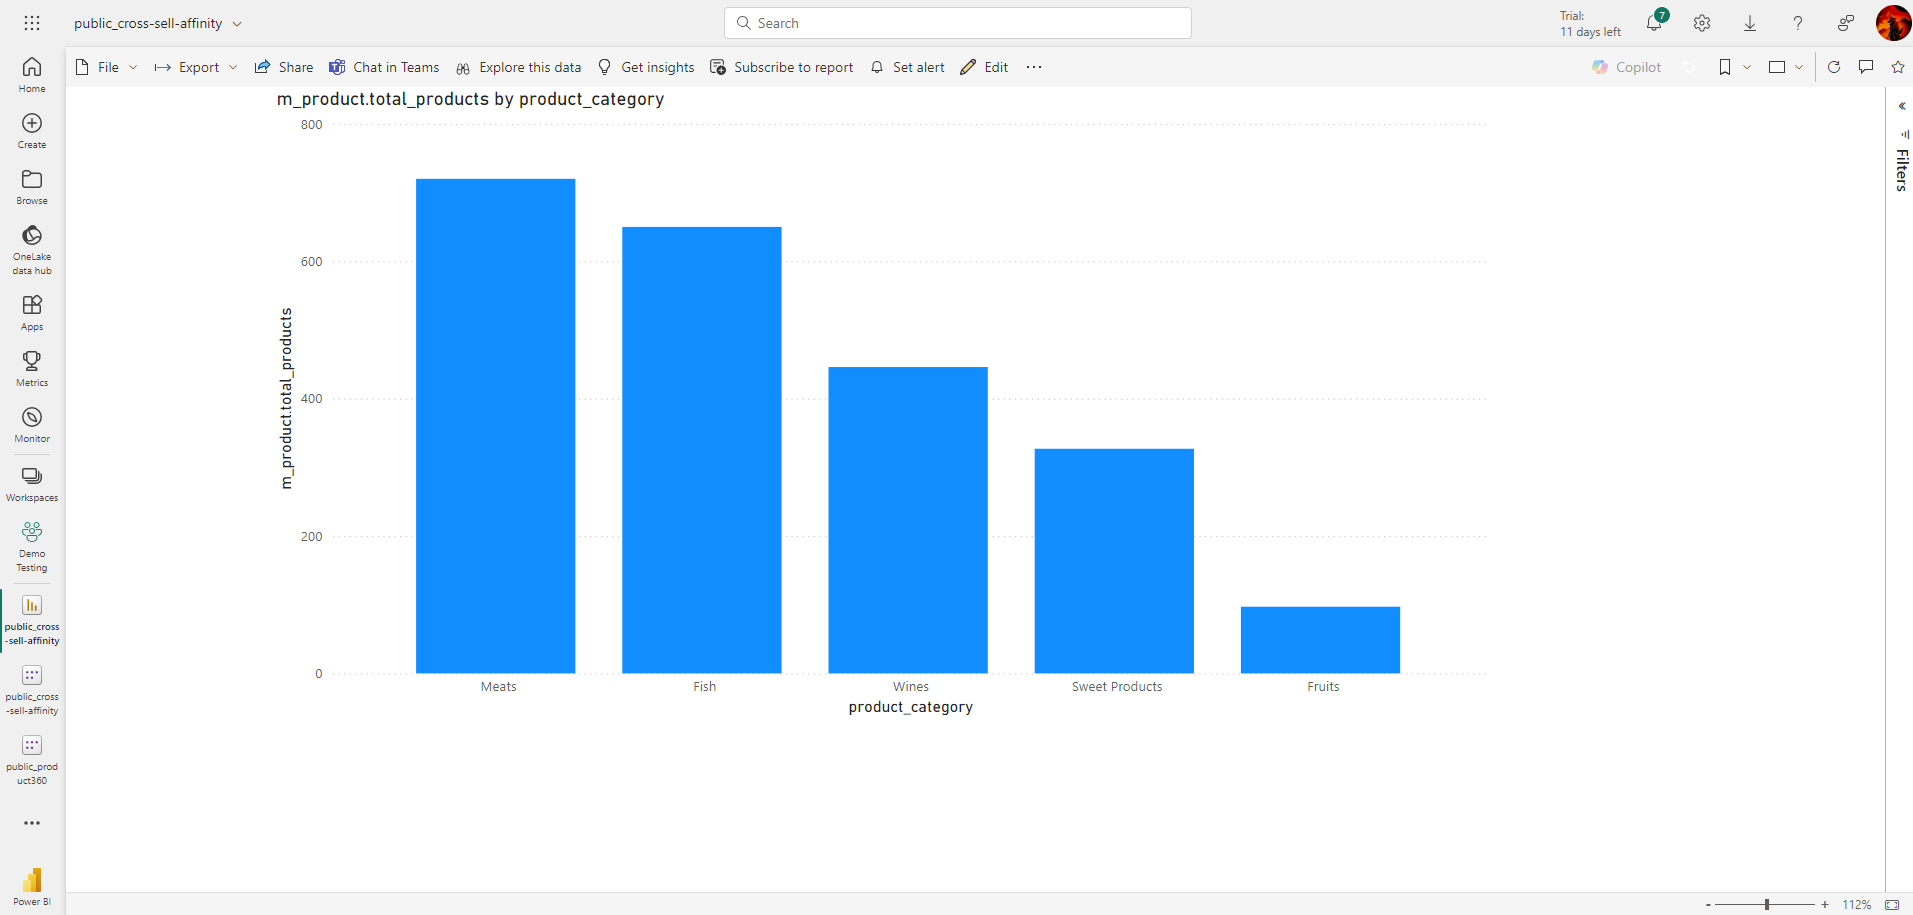
Step 4: Access data tables and start building dashboards
Once connected, you can see tables and views containing all dimensions and measures from the Data Product. You can now start building your dashboard by selecting the relevant fields for analysis.
Using PowerBI Service Account
To publish the created report to the Power BI service account for sharing and collaboration follow the below steps:
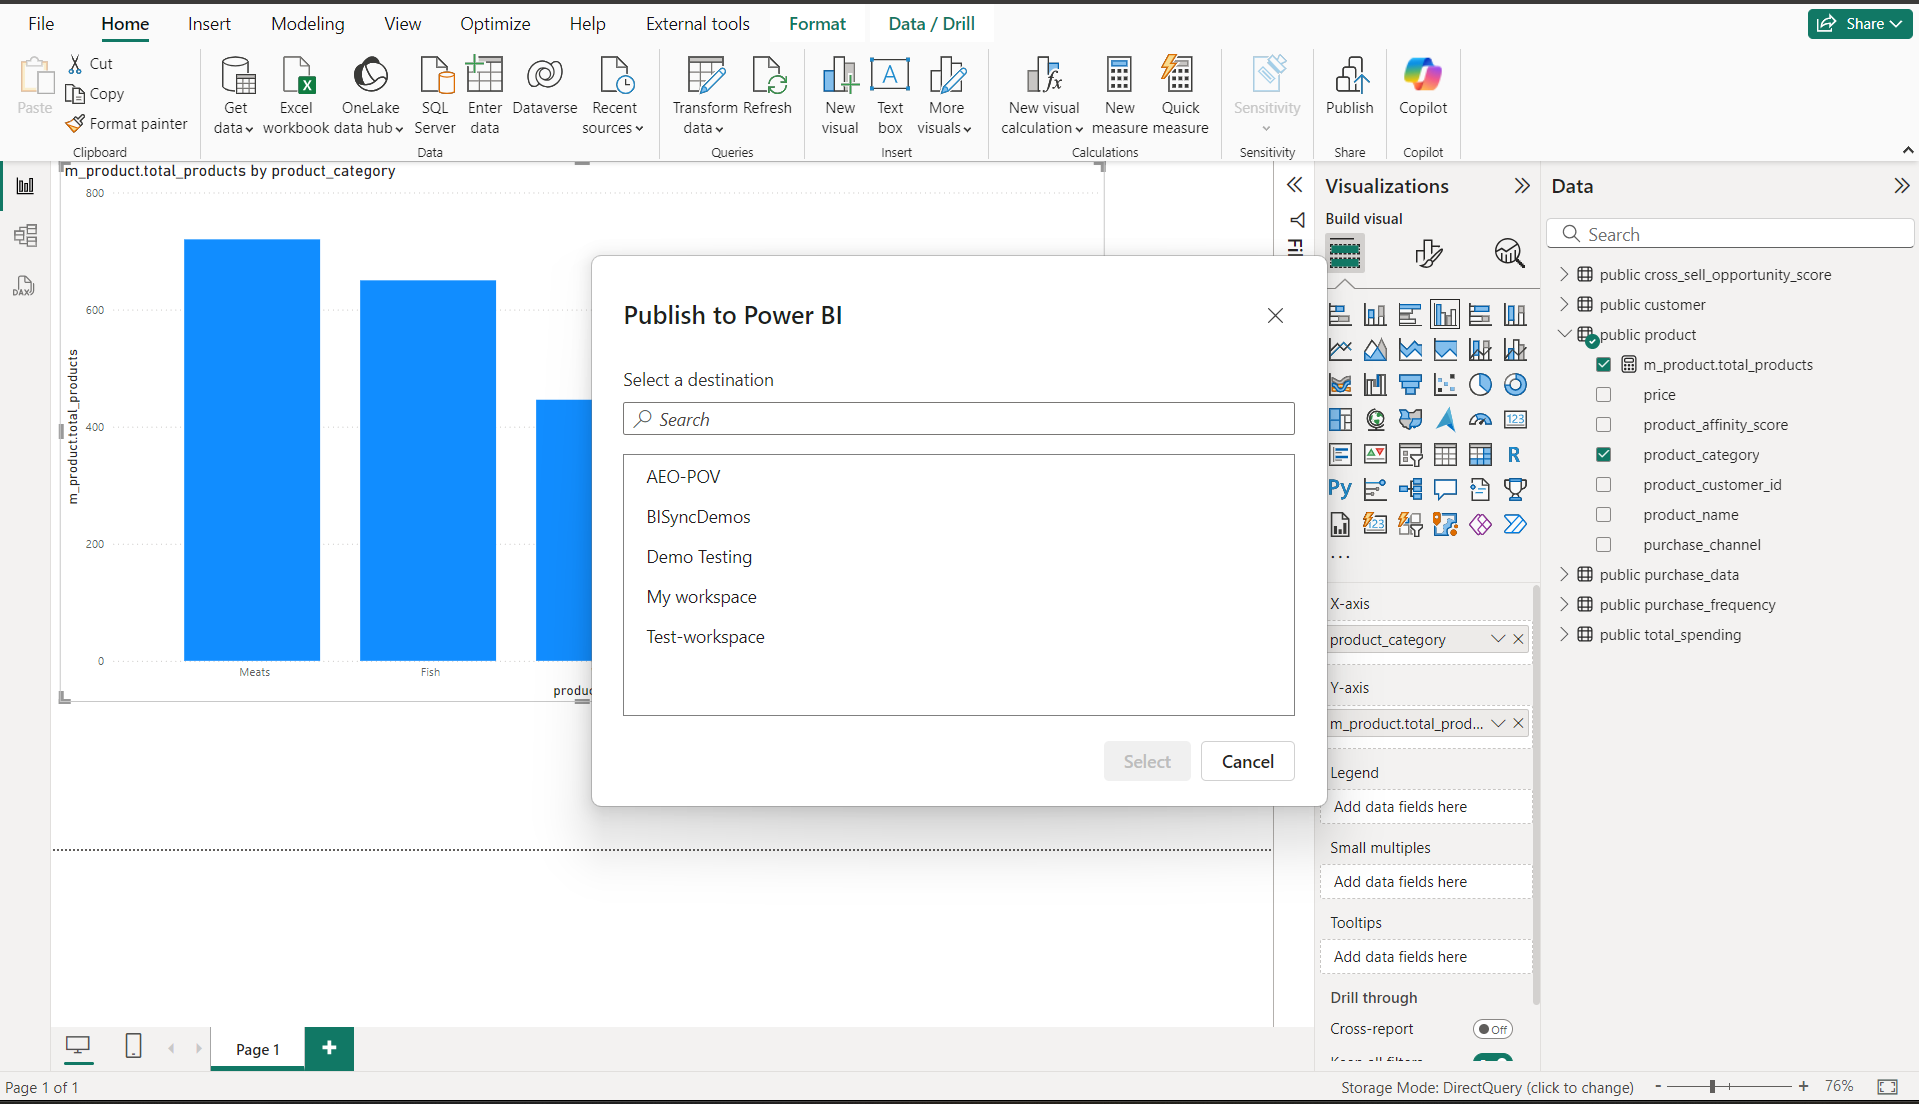
Step 1: Publish the report to Power BI Service
In the PowerBI, click 'Publish'. This action will push the report to your online Power BI service account, making it available for access in the Power BI workspace. Choose the required workspace.
Info
This step requires a valid Power BI service account, as the report will be published to the online service.
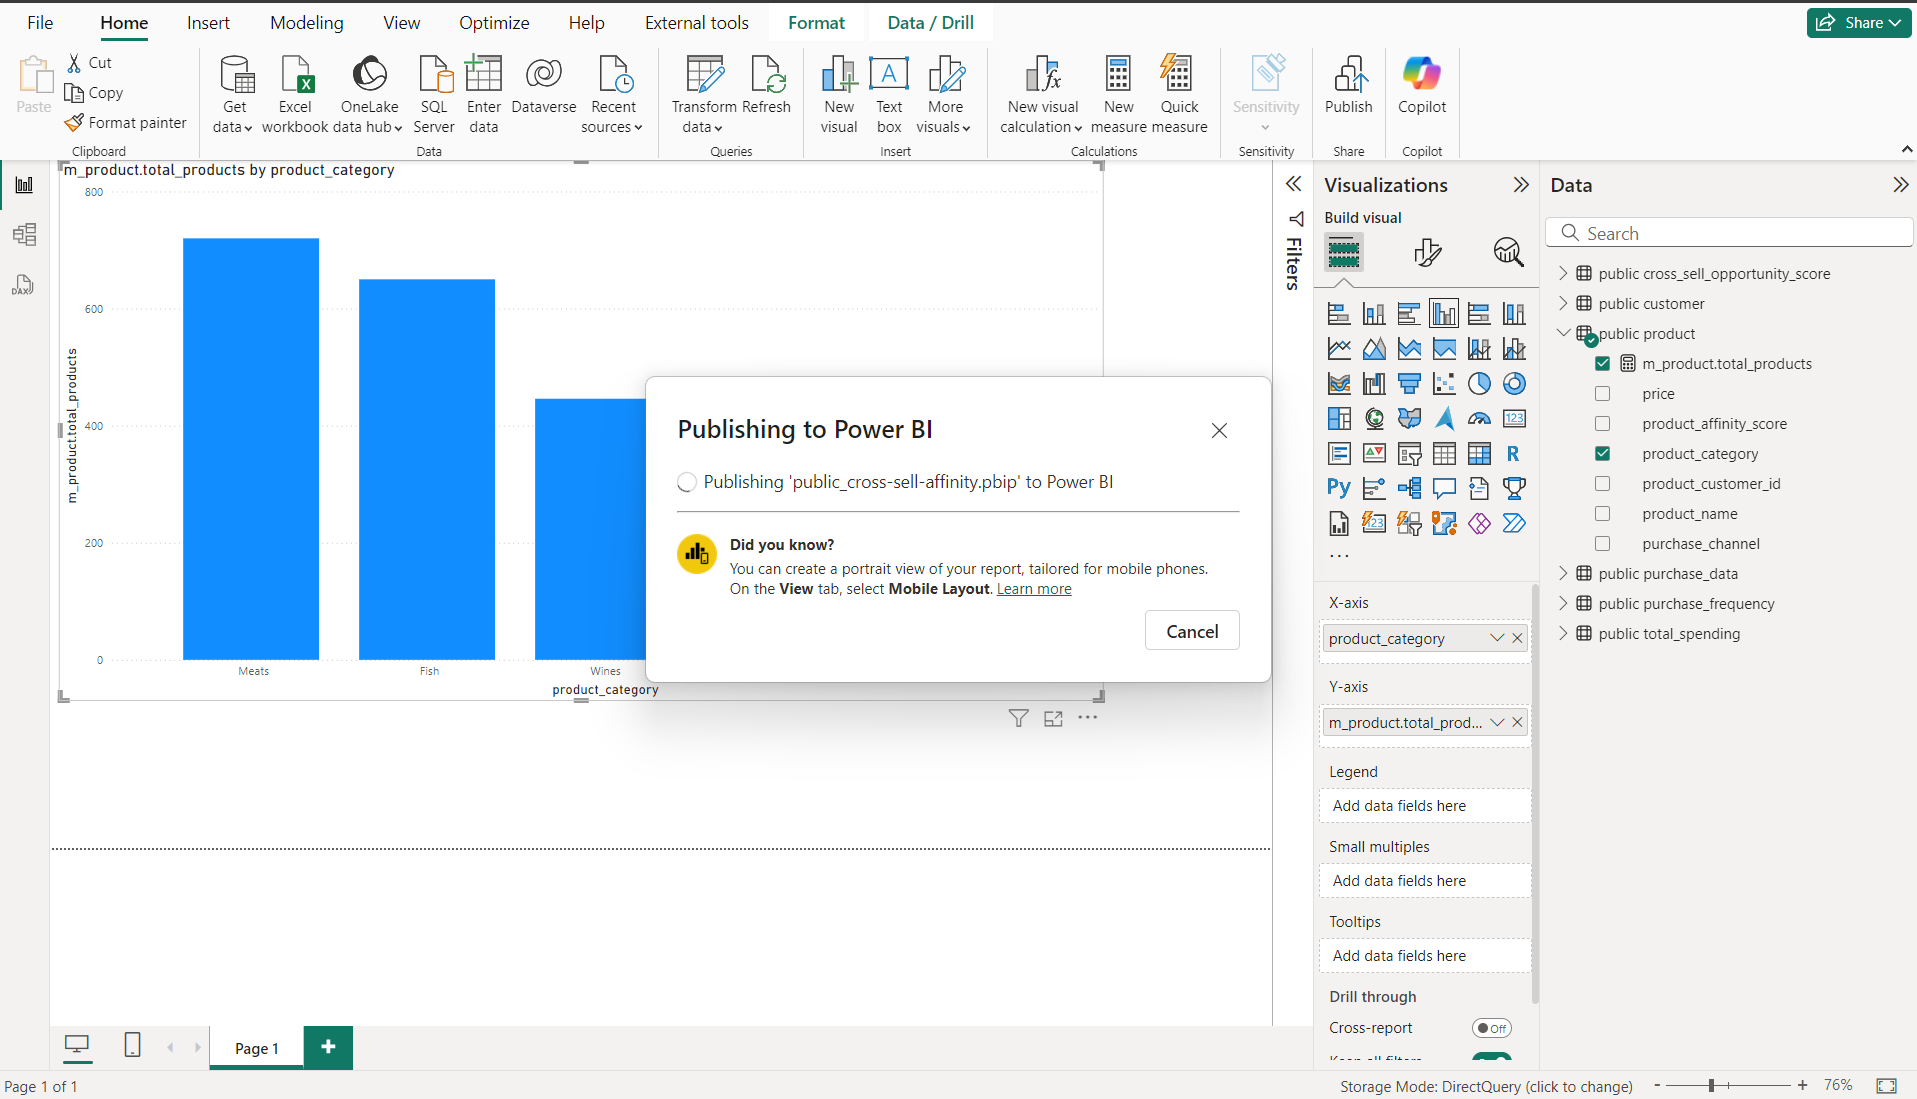
Step 2: Confirm publishing in the chosen workspace
The image below shows the power BI is publishing the report in the chosen workspace.
Step 3: Navigate to your workspace
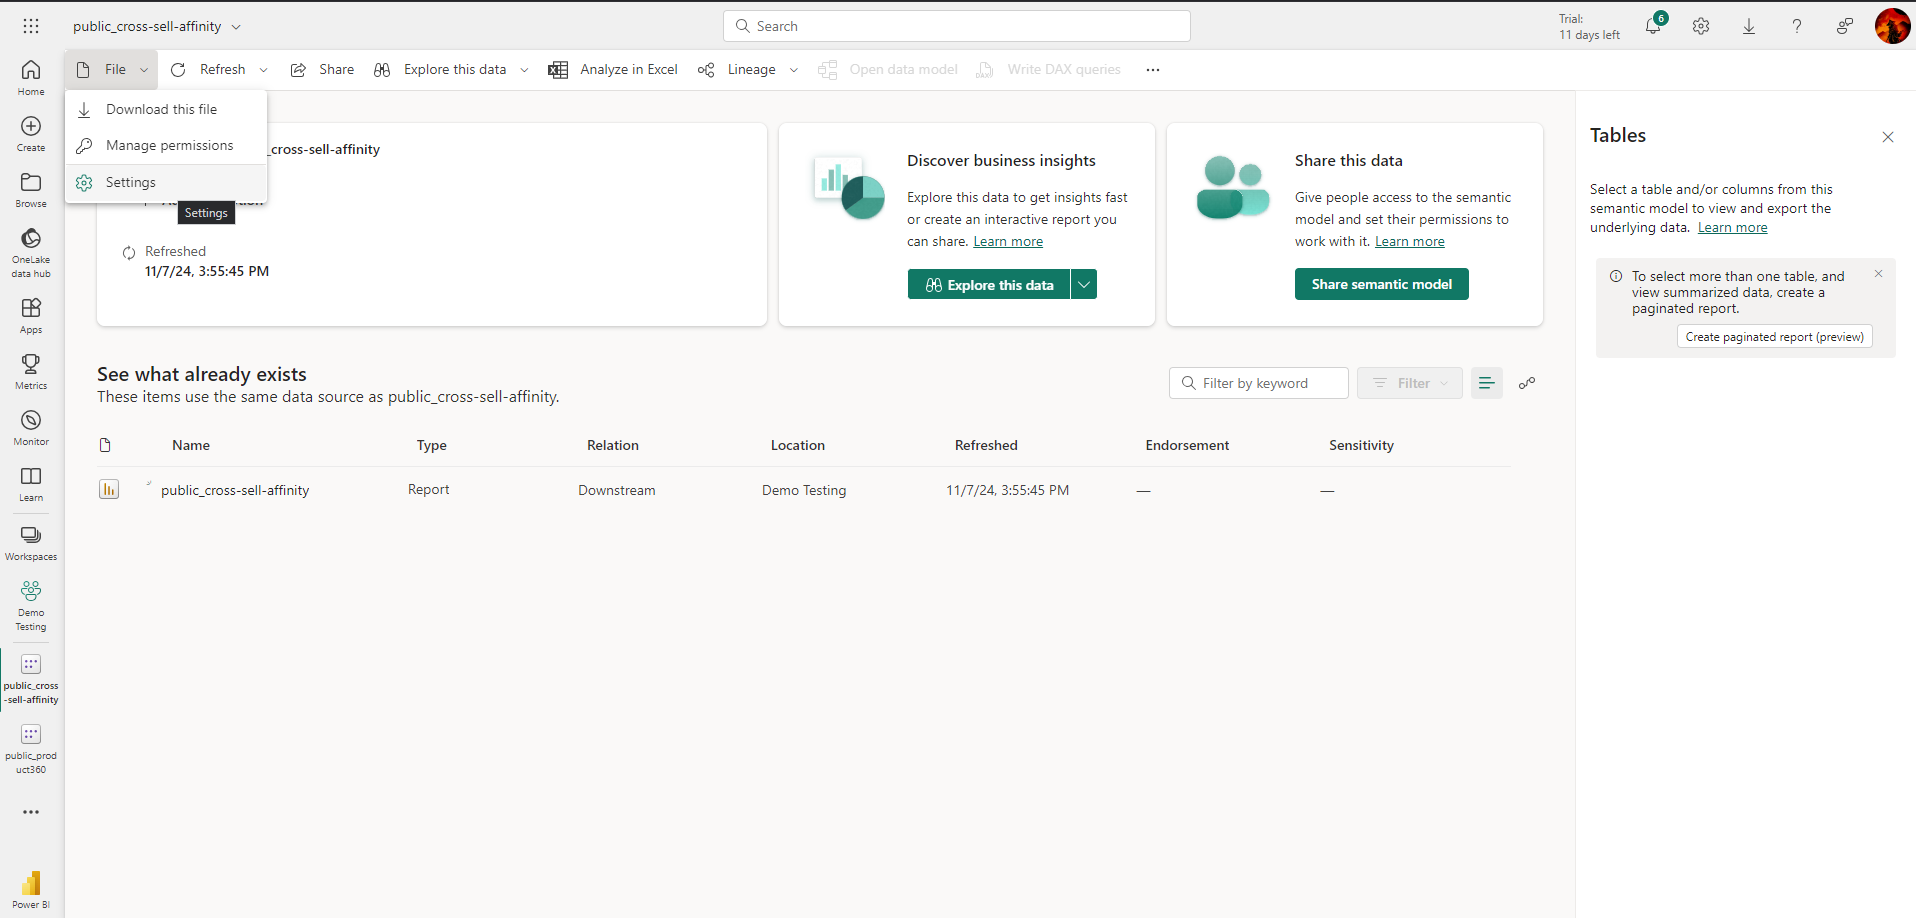
Once published, go to your 'workspace' where the report has been saved. Here it is Demo Testing.
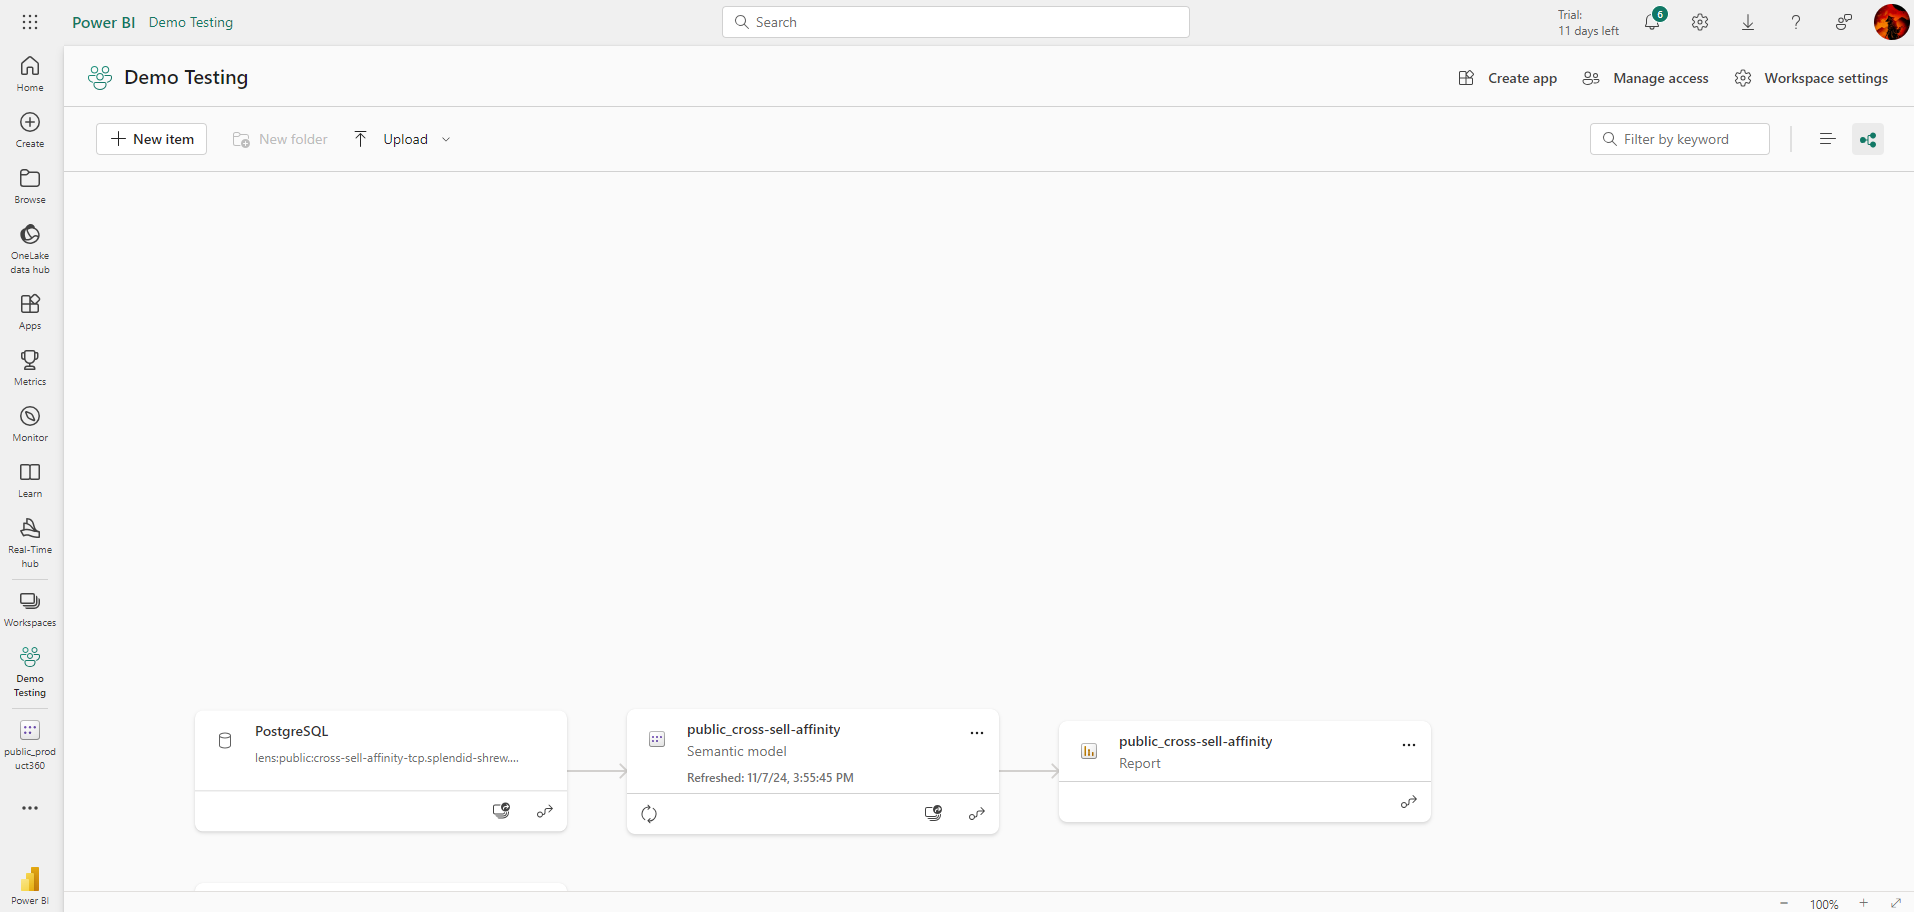
Click on the connected semantic model below the workspace with the name cross-sell-affinity.
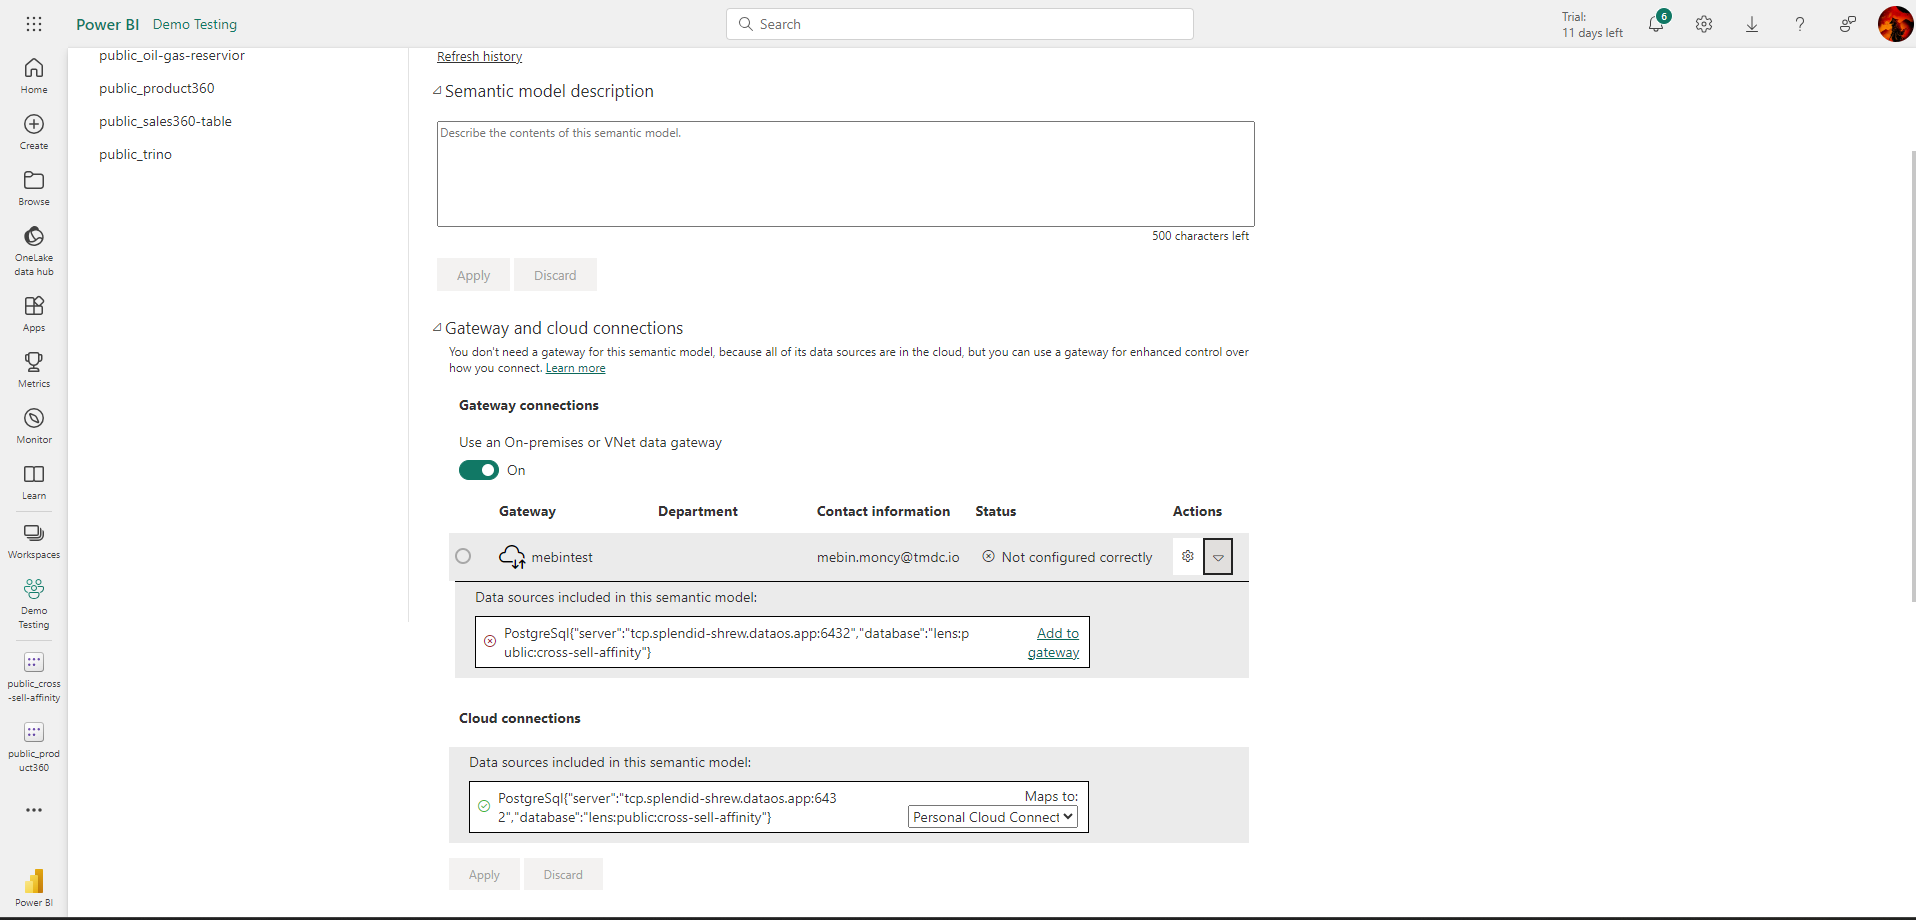
Step 4: Locate and access report settings
Scroll down to the 'Gateway and Cloud Connections' section. Toggle the switch to 'enable the gateway connection'. Click on the 'Add to Gateway' button to initiate the connection process.
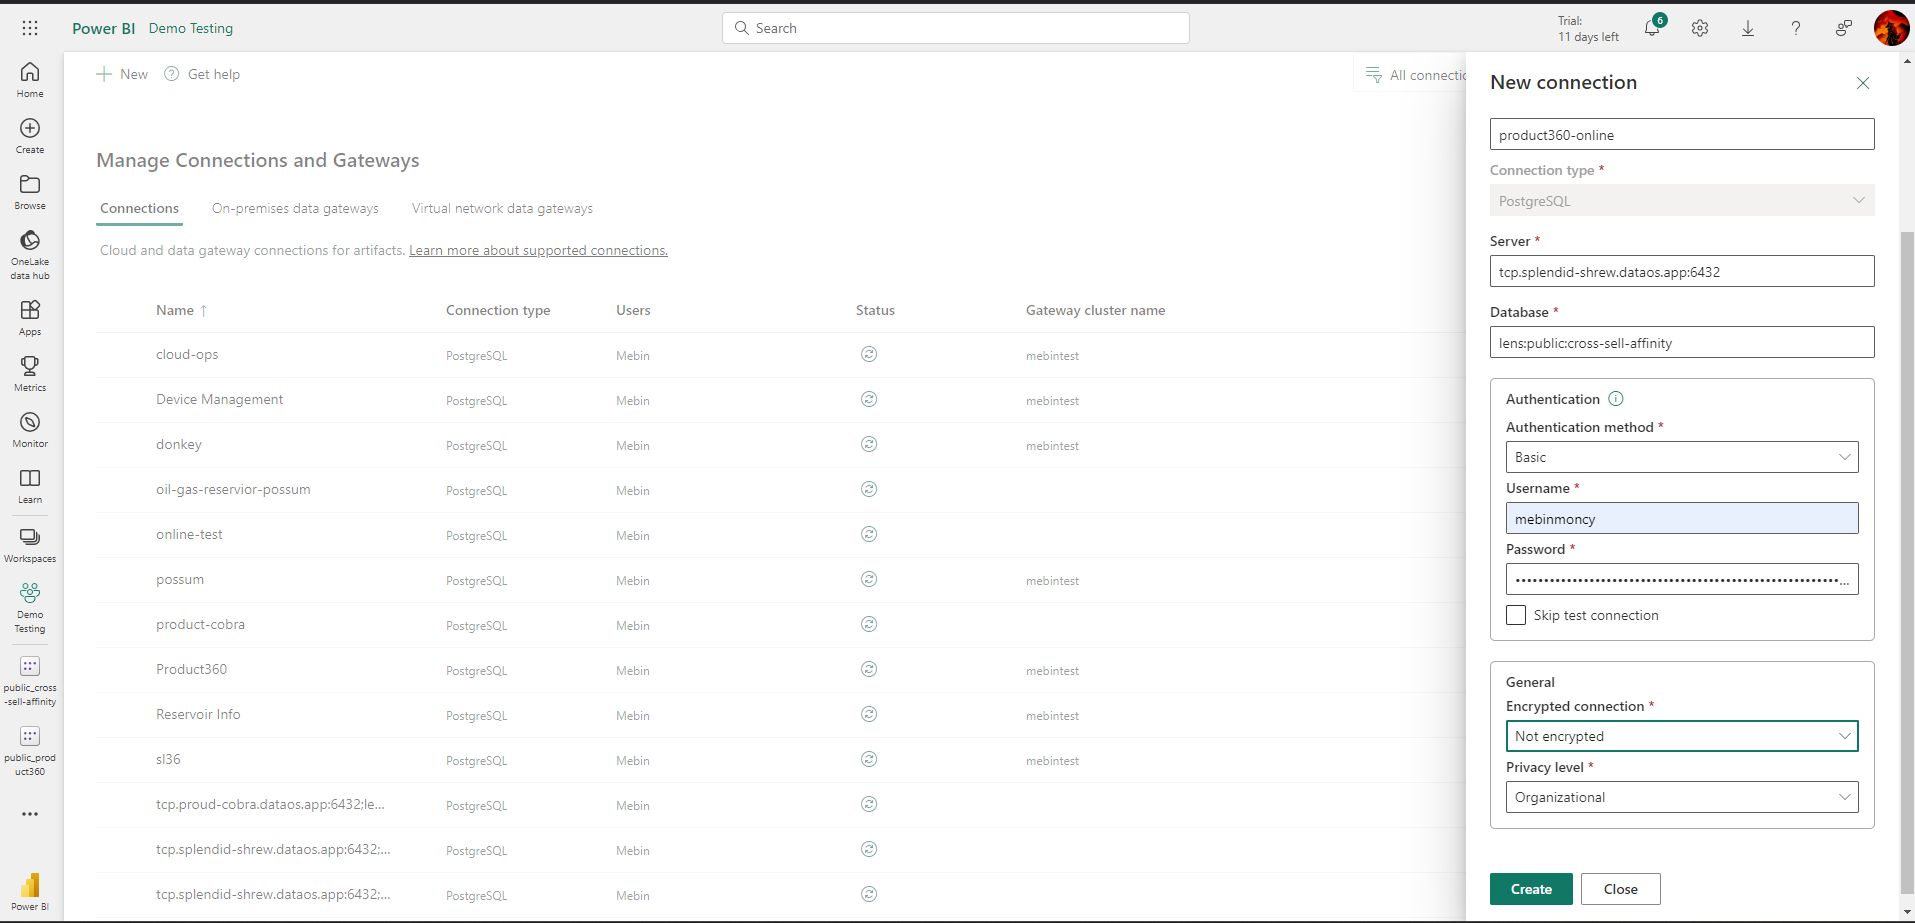
Step 5: Enable gateway connection
After clicking the 'Add to Gateway' button, you'll be prompted to enter the necessary 'connection details' for the data source. Once you’ve entered the required connection information, finalize the connection setup.
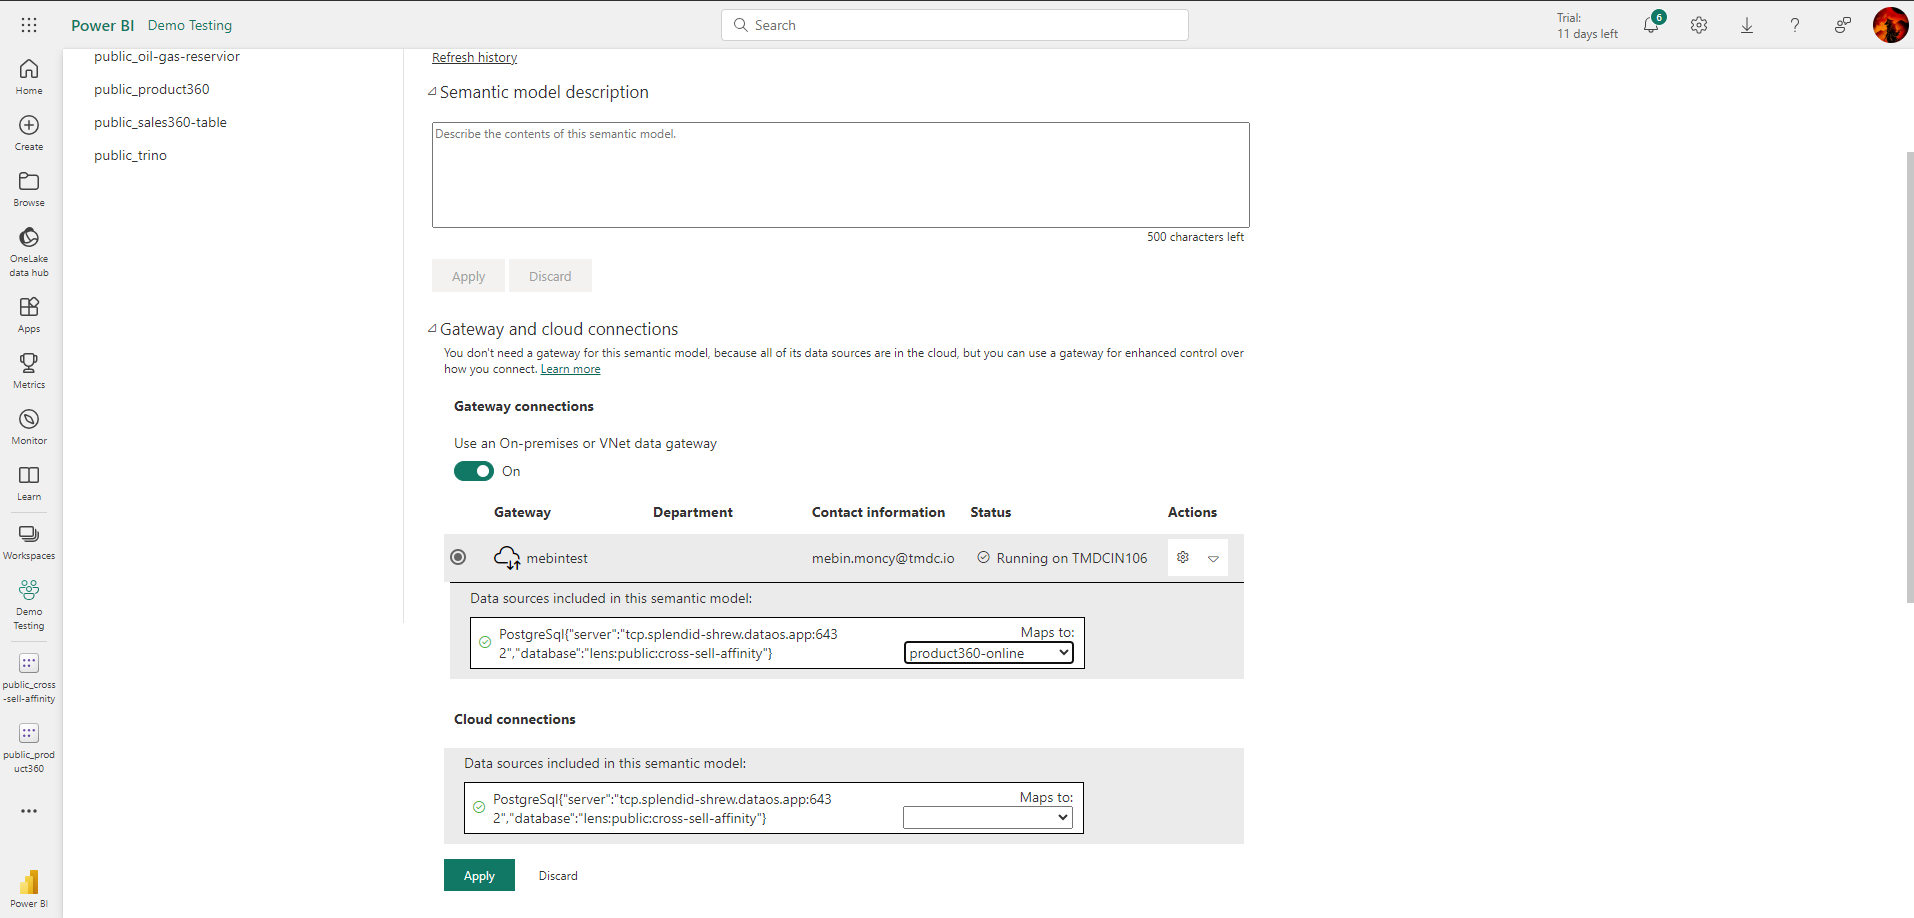
Step 7: Confirm successful connection
After successfully connecting,you will be mapped to the semantic model as shown in the image below:
Step 8: Access the semantic model
After successfully connecting, you will be able to access the dashboard.
Info
Power BI also provides the functionality to interact with the downloaded file in Excel.
Supported data types
| Category | Data Types | Support Status |
|---|---|---|
| Dimension | time, string, number, boolean |
Supported |
| Measure | max, min, number, sum, count, boolean, string, time, avg, count_distinct |
Supported |
| Measure | count_distinct_approx |
Not Supported |
| Rolling Window | - | Not Supported (Power BI doesn’t support) |
Important considerations
- In Power BI, measures typically have an 'm_' prefix to indicate they represent a measure. For example, a measure calculating total revenue might be named
m_total_revenue. - The connection is live, meaning any changes to the underlying data will be reflected in Power BI.
- When schema changes occur, such as CRUD operations (Create, Read, Update, Delete) on dimensions, measures, or other elements of the semantic model, a re-sync is required. To prevent losing previously created reports after the re-sync, download the model folder from the Data Product Hub, extract the contents, and replace the existing folder with the new one.
Best practices
Adhering to best practices ensures that you effectively utilize the Data Product Hub and maintain compatibility with the latest features and updates. Following these guidelines will help optimize workflow, enhance performance, and prevent potential issues.
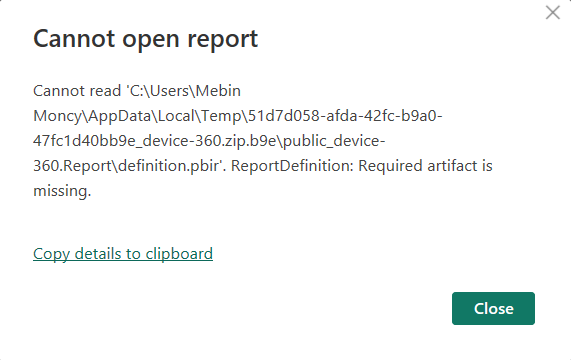
File handling
Ensure that .pbip folders are fully extracted before opening them. Failure to do so may result in missing file errors, as shown below:
Data retrieval and field selection considerations
It is important to select fields from tables that are directly related or logically joined, as the system does not automatically identify relationships between tables through transitive joins. Selecting fields from unrelated tables may result in incorrect or incomplete results.
Connection reset
If you encounter a 'connection reset' error during Power BI sync:
- Go to the Home tab in Power BI Desktop.
- Click the Refresh button in the Queries section.
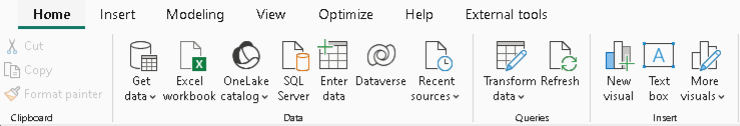
This should resolve the error and restore the sync.
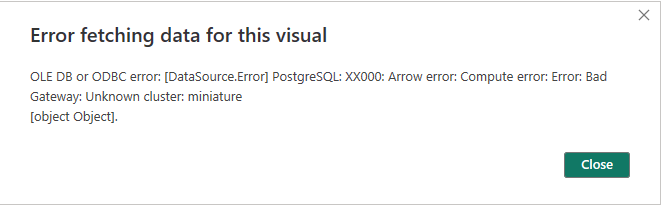
Unknown cluster
Whenever you encounter the error 'unknown cluster:
Limitations
- Power BI fails to handle special characters (e.g., &, %, #) when generating queries through the synced semantic model, causing errors in visualizations. Thus, it is best practice to address or remove special characters directly in the data itself.
- Power BI's Direct Query mode does not support creating custom dimensions and measures or querying the rolling window measure due to the lack of date hierarchy.
- DAX functions and Import query mode are not supported.
Governance of model on Power BI
Data masking, restrictions, and permissions established by the publisher are automatically enforced for all report viewers, ensuring consistent data security and compliance. The behavior of these data policies, such as masking, may vary based on the use of Power BI Desktop or other interfaces.
When the Lens semantic model is activated via BI Sync on Power BI, authentication and authorization are handled using the DataOS user ID and API key. This ensures that columns redacted by Lens data policies are restricted based on the user's group permissions.
For example, if a user named iamgroot, belonging to the 'Analyst' group, is restricted from viewing the 'Annual Salary' column, this column will not appear in either the Data Product exploration page or in Power BI after synchronization. Power BI requires the DataOS user ID and API key for authentication, ensuring that users can access the full model except for columns restricted by their data policies.
This approach ensures that users only see the data they are authorized to view, maintaining security and compliance.