Knowing About the Quality of Data Products
Overview
Let’s dive into how DataOS ensures your Product Affinity Data Product meets the mark for accuracy, freshness, and trustworthiness—so you can confidently use it for analysis.
Scenario
You’re preparing to analyze customer and sales data to uncover product affinities. But before diving into insights, how do you know the data is actually trustworthy?
Answer: You validate it with quality checks!
Quick concepts
Overview of data quality checks
Data quality checks verify that data meet predefined standards of accuracy, completeness, uniqueness, and validity. These checks are essential for:
-
Identifying and resolving data inconsistencies.
-
Ensuring data readiness for reliable analysis.
-
Maintaining compliance with defined Service Level Objectives (SLOs).
Common SLOs for data quality
| SLO | What It Means | Example |
|---|---|---|
| Accuracy | Data reflects real-world events | 99% of country names must be valid |
| Completeness | All required fields are filled | Customer ID cannot be missing |
| Freshness | Data is updated on time | No data older than 24 hours |
| Schema | Structure follows defined format | Birth year must be an integer |
| Uniqueness | No duplicate records | Max 0.5% duplicates allowed |
| Validity | Values meet expected rules/formats | Phone numbers follow valid format |
Steps to access Data Product quality
Follow the below steps to understand the quality of the Data Product on the Data Product Hub.
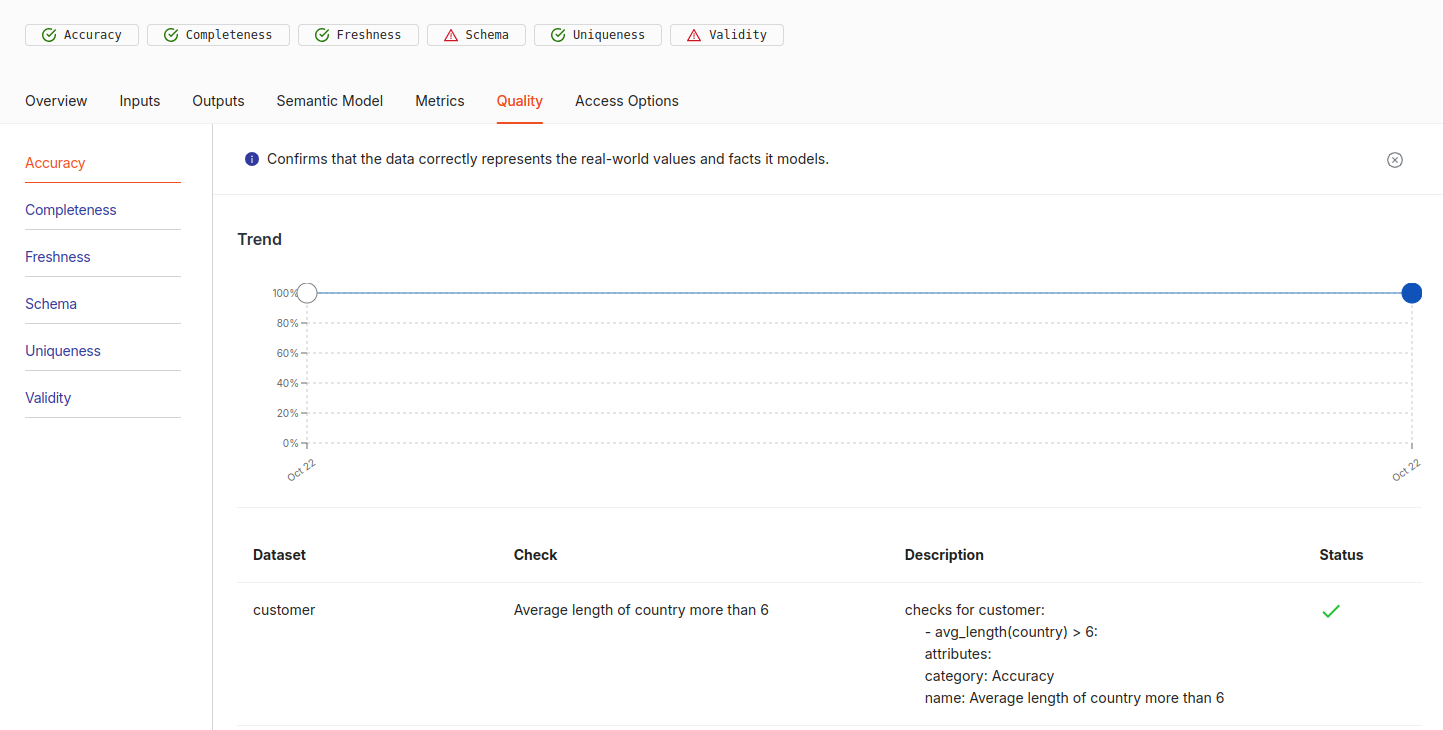
Access the quality tab on the Data Product details page
Navigate to the Data Product details page and click on the 'Quality' tab. The Accuracy section displays quality checks applied to the dataset. Example: country column has an average length over 6 characters = ✅ 100% accuracy
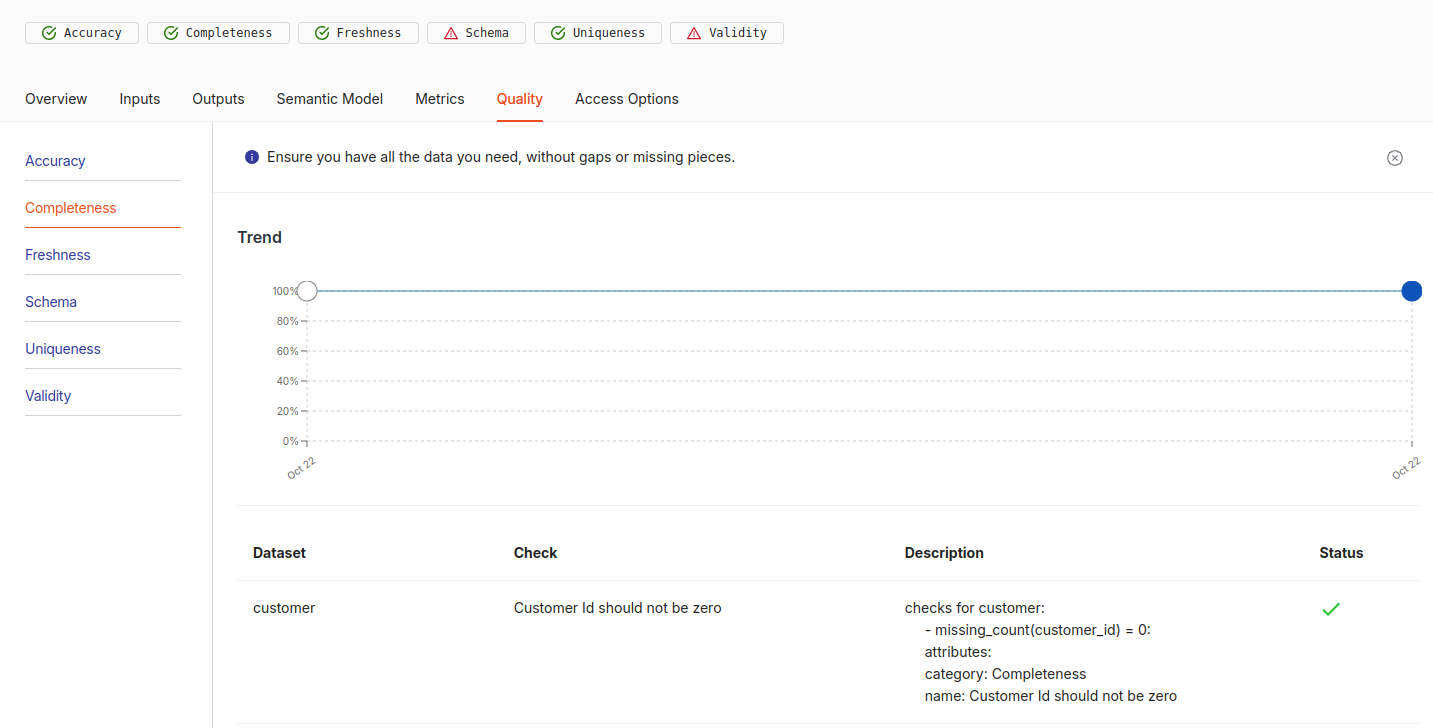
Understand the completeness of the data
Switch to the Completeness tab → No missing customer IDs = 100% score
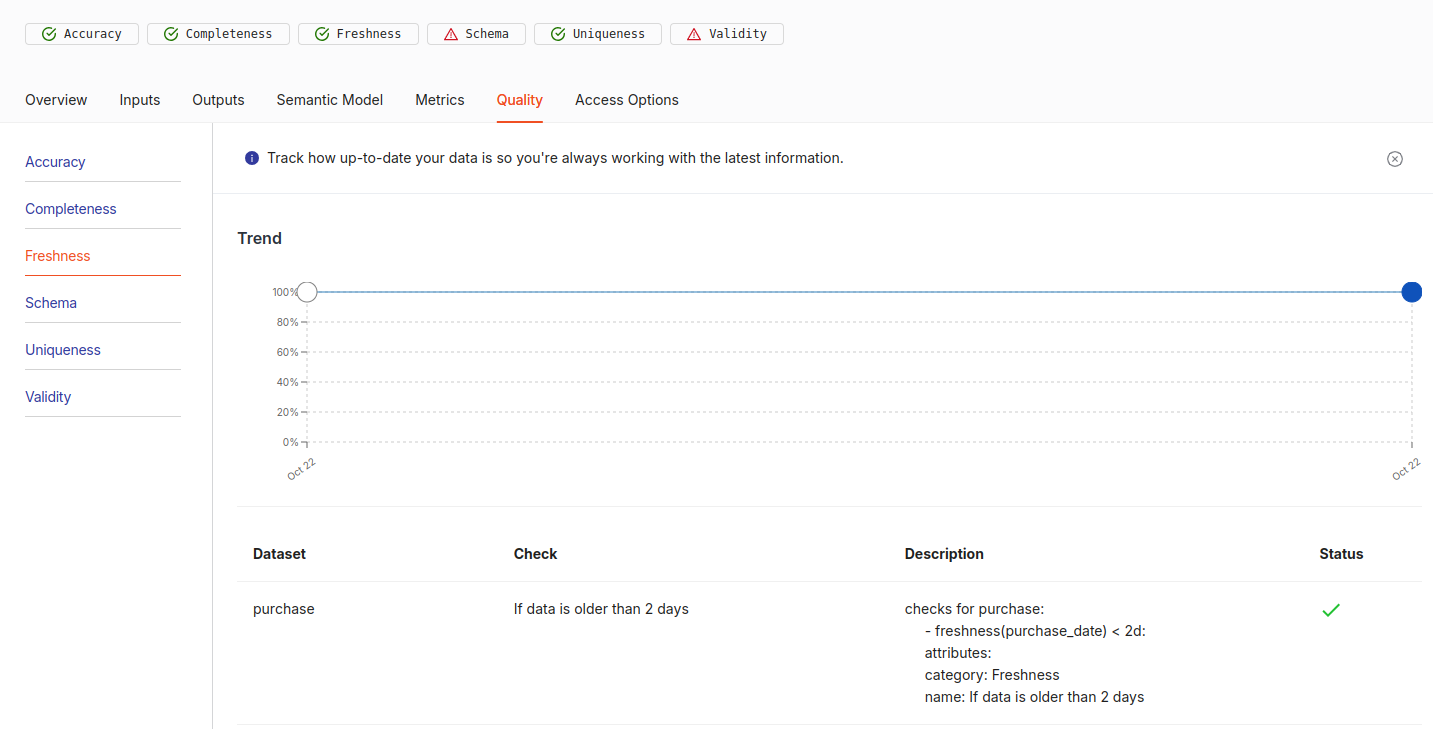
Know about the freshness of the data
In the 'Freshness' tab, you will see a 100% freshness rating, Data updated within 2 days = ✅ 100% freshness
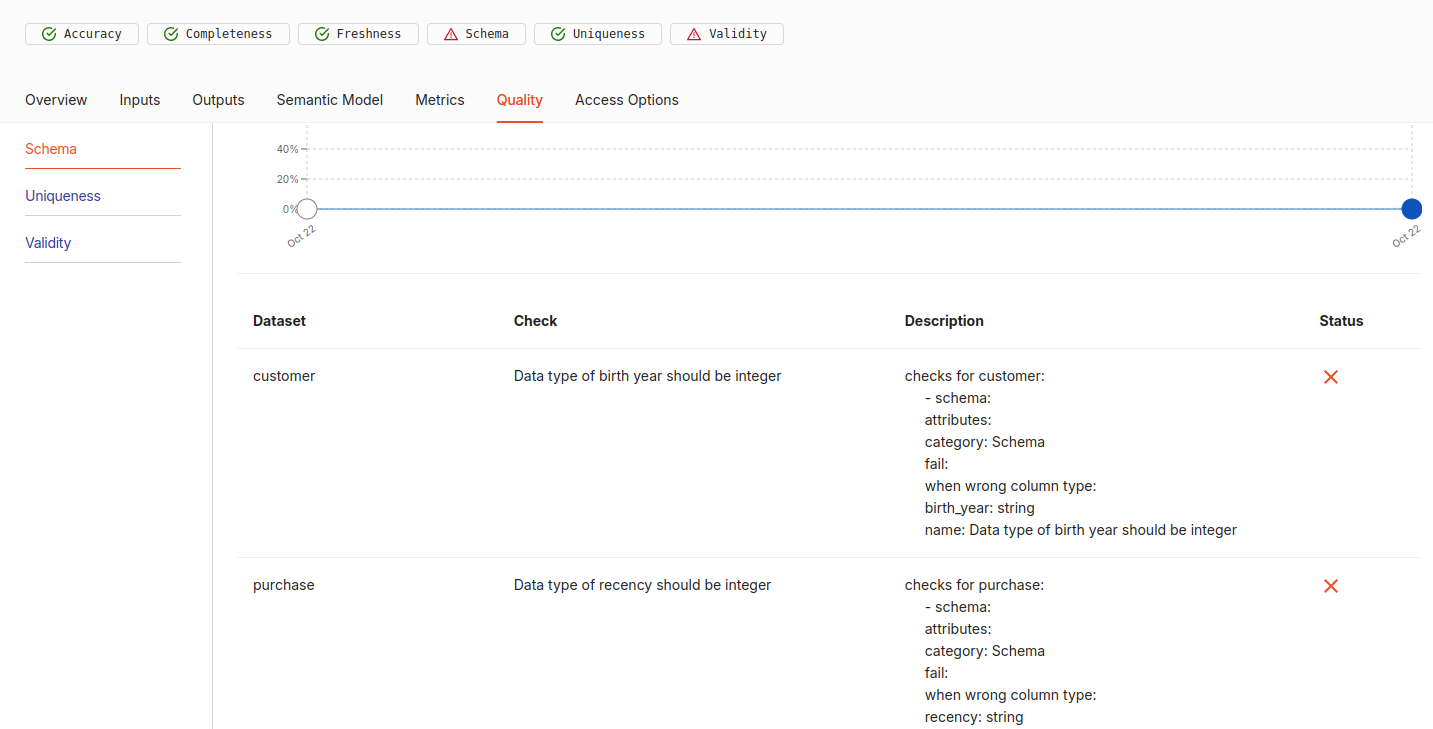
Understand the schema of the data
On the 'Schema' tab, you may find a trend line at zero, indicating that the data has not passed certain quality checks. This could mean that the data types of columns like 'birth_year' and 'recency' do not align with the established quality conditions.
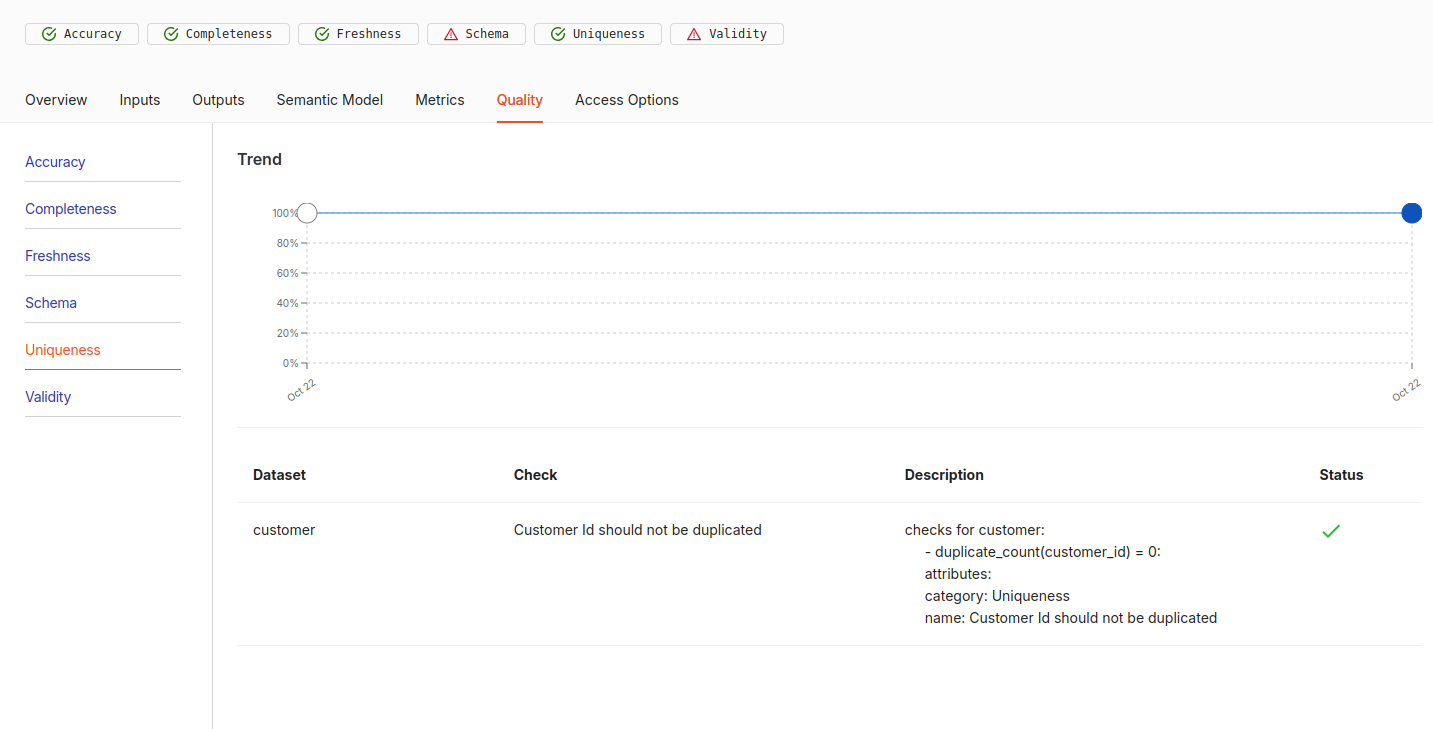
Assess uniqueness of the data
In the 'Uniqueness' tab, a trend line at 100% indicates that all customer IDs are unique = 100% data integrity.
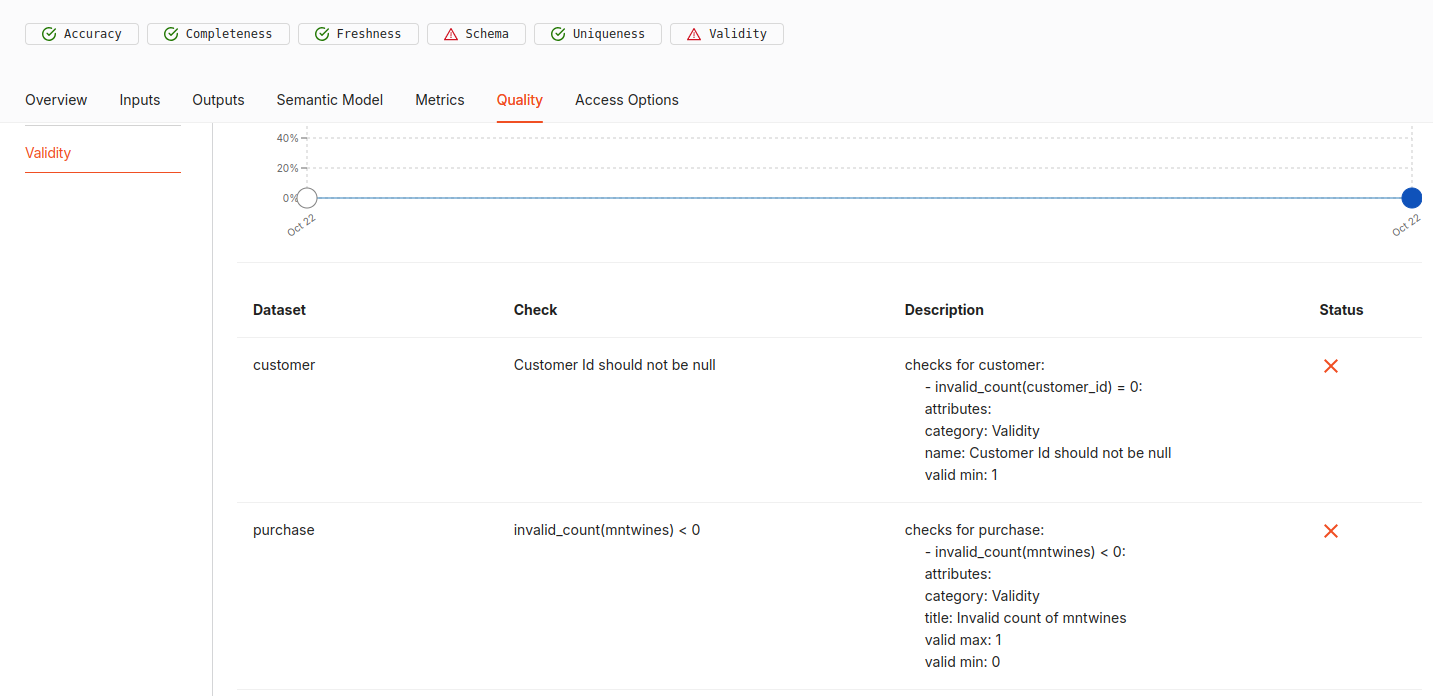
Check validity
The 'Validity' tab shows a 0% trend line, indicating that some quality checks have failed. For instance, there may be invalid customer IDs in the dataset.
Best practices
- Regularly review tabs like Accuracy, Completeness, and Freshness on Data Product Hub.
- Ensure the structure of datasets aligns with predefined schema rules.
- Run periodic checks for duplicate records, especially in critical fields like customer IDs.
- Schedule workflows to update data regularly, preventing outdated information from affecting analysis.
- Investigate and resolve issues flagged in tabs like Validity or Schema as soon as possible.
Self-check quiz
1. What does a 0% validity score indicate?
A. All data is valid
B. Schema is perfect
C. Several fields fail format checks
D. There are no customer IDs
2. Which tab would show duplicate issues?
A. Accuracy
B. Schema
C. Uniqueness
D. Freshness
Next step
Connect your Data Products with BI tools: