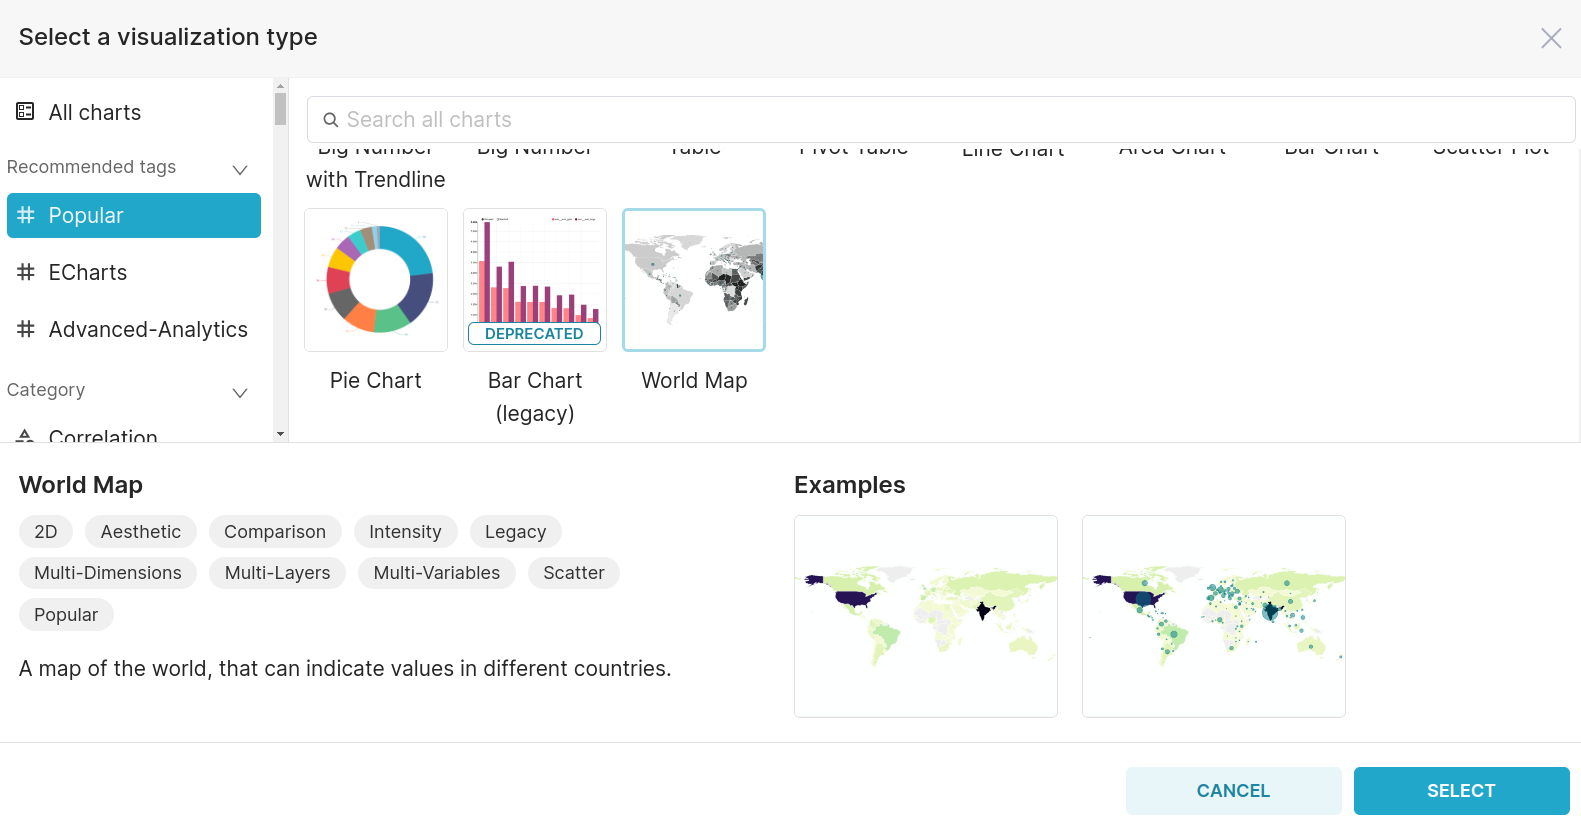
World map
The World Map Chart in Superset is a geographic visualization that highlights data points across different locations on a world map.

On selecting the World map chart, you can then proceed with its components.

- Country Column (Mandatory):
- Choose the column containing country names for mapping on the World Map Chart.
- Country Field Type (Mandatory):
- Specify the field type for the selected country column.
- Sort By Metric (Optional):
- Define the sorting order based on the metric values for an organized map representation.
- Show Bubbles (Optional):
- Toggle to display bubbles on the map, adding a visual element to the data.
- Bubble Size (Optional):
- Define the size of the bubbles displayed on the World Map Chart.
- Max Bubble Size (Optional):
- Set the maximum size limit for the bubbles, ensuring proportional representation.
- Bubble Color (Optional):
- Customize the color of the bubbles for a visually appealing display.
- Color By (Optional):
- Choose the metric that will determine the color of the bubbles.
- Country Color Scheme (Optional):
- Specify the color scheme for countries on the map, enhancing the visual presentation.