Pivot table
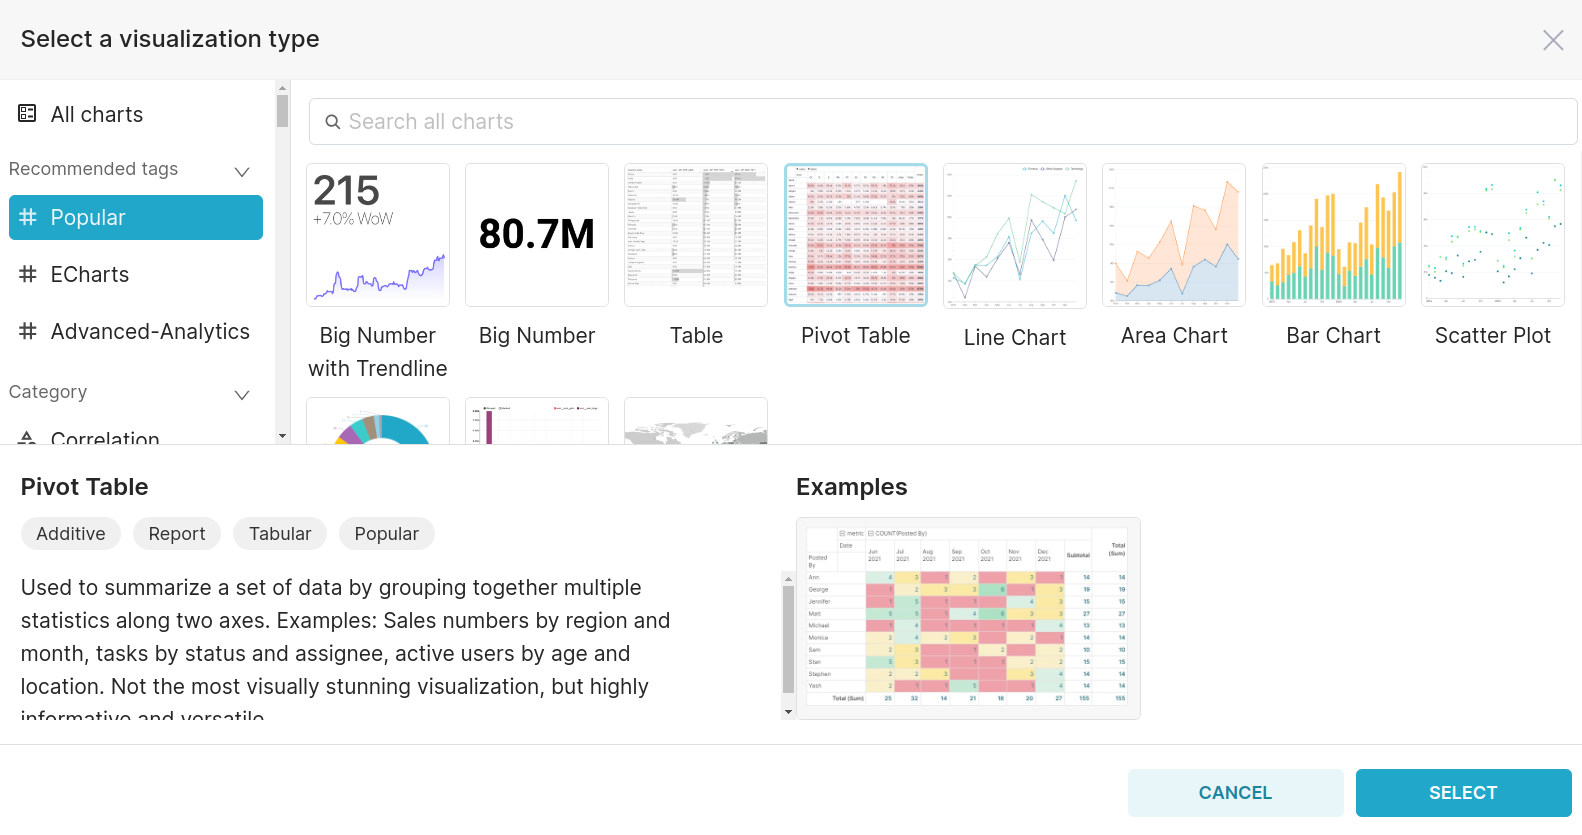
In Superset, a pivot table is a sophisticated data analysis tool that transforms raw data into a structured table, offering a dynamic way to organize and summarize information. This visualization allows users to flexibly arrange dimensions and metrics, apply aggregations, and dynamically pivot rows and columns. By providing a comprehensive view of multidimensional data, the pivot table empowers users to explore relationships, identify patterns, and make informed decisions based on a clear and organized presentation of their data. Let’s see its specific components one by one:

On selecting the Pivot Table chart, you can then proceed with its components.

Common components such as METRIC and FILTERS are already covered in the 'Common Charts Components' section for reference.
- COLUMNS:
- Represents individual fields or attributes to be displayed as columns in the pivot table.
- ROWS:
- Represents individual fields or attributes to be displayed as rows in the pivot table.
- TIME GRAIN:
- Defines the granularity or interval at which time-related data is displayed.
- APPLY METRICS ON:
- Allows choosing specific fields or dimensions on which metrics are applied such as columns and rows.
- SERIES LIMIT:
- Limits the number of series (rows or columns) displayed in the pivot table.
- CELL LIMIT:
- Sets the maximum number of cells to be displayed in the pivot table.
- SORT DESCENDING:
- Determines whether the pivot table values are sorted in decreasing order.
- AGGREGATION FUNCTION:
- Specifies the method used to aggregate values in the pivot table (e.g., sum, average).
- SHOW ROWS TOTAL:
- Option to display total values for rows in the pivot table.
- SHOW ROWS SUBTOTAL:
- Option to display subtotal values for rows in the pivot table.
- SHOW COLUMNS TOTAL:
- Option to display total values for columns in the pivot table.
- SHOW COLUMNS SUBTOTAL:
- Option to display subtotal values for columns in the pivot table.
- TRANSPOSE PIVOT:
- Swaps the rows and columns of the pivot table.
- COMBINE METRICS:
- Combines metrics into a single value, useful for simplifying complex tables.