Common Chart Components
In Superset, every chart has its special components, but there are also common components that show up in various charts. Let's take a closer look at these common components.
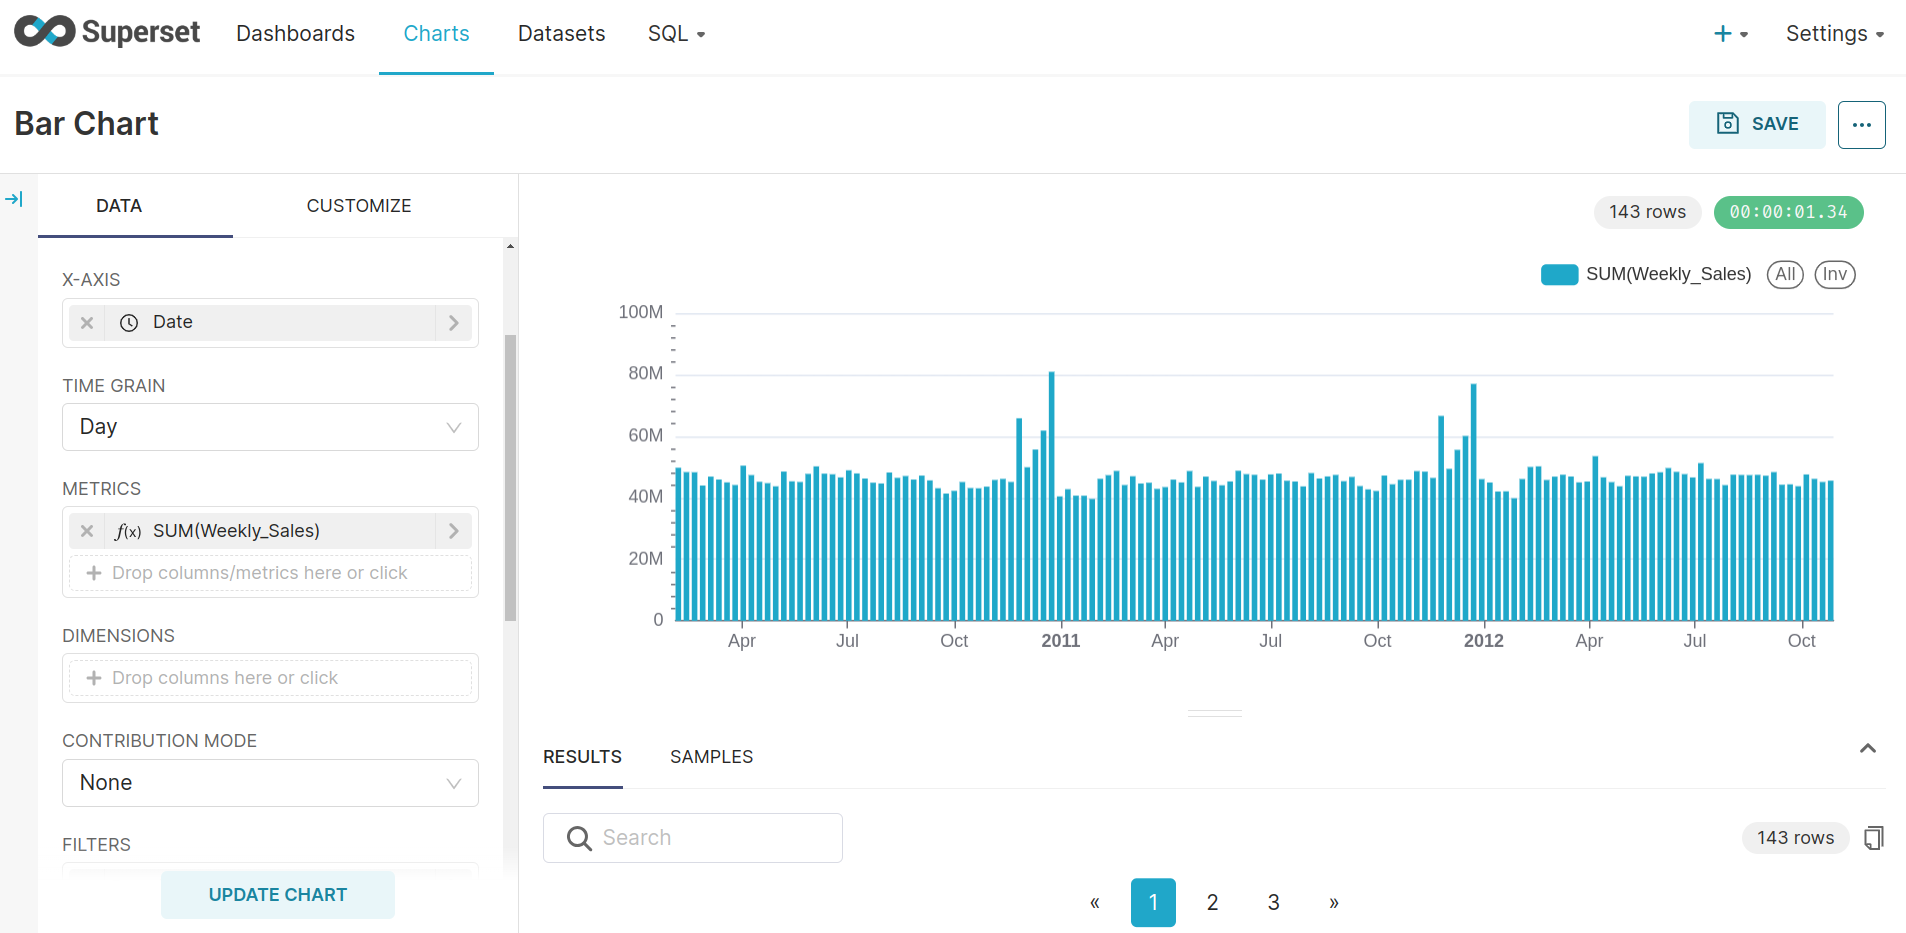
1. Metrics (Mandatory)
- Metrics represent the quantitative values or measurements to be visualized on the chart.
2. Dimension (Optional)
- Dimensions are categorical data points providing additional context or grouping for the metrics.
3. ROW LIMIT (Optional)
- Control the number of rows displayed on the chart to manage the data presentation.
4. SORT BY (Optional)
- Specify a column or metric to define the sorting order for the displayed data.
5. Group By (Optional)
- Group By allows you to categorize or group data based on a specific dimension or attribute.
6. Time (Mandatory)
- The Time component is crucial for time-based analyses, facilitating the visualization of data trends over different time intervals.
7. Filters (Optional)
- Filters narrow down displayed data based on specific conditions, refining the visualization.
8. Annotations (Optional)
- Annotations are additional labels or notes added to specific points on the chart.
9. Rolling Window (Optional)
A Rolling Window refers to a statistical analysis method applied to time-series data. It involves systematically analyzing data within a fixed-size window that moves across the dataset.
- Rolling Function (Optional) Defines the statistical operation applied within the rolling window (e.g., mean, sum).
- Periods (Optional): Specifies the size of the rolling window.
- Min Periods (Optional): Specifies the minimum number of periods required for calculation within the rolling window.
Enhance your understanding of chart components, tailored to specific characteristics of popular chart types: