Operator Journey
A DataOS Operator is typically responsible for the following activities to ensure smooth operations:
Access Management
Bifrost ensures flexible and secure access management tailored to diverse use cases. Operators can harness Bifrost's graphical interface to create and manage policies for fine-grained access control across applications, users, services, and stacks.
-
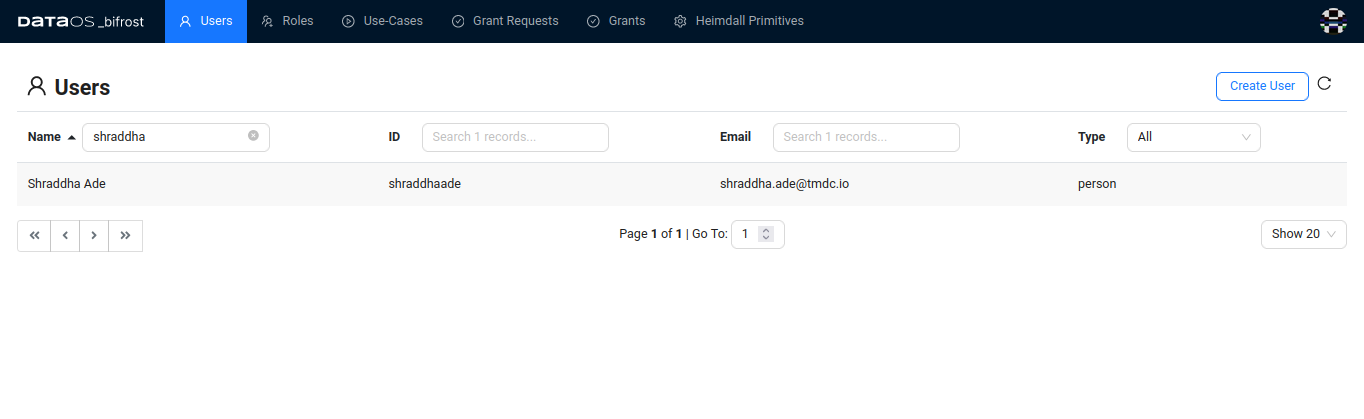
Login to DataOS and open the Bifrost app.
-
Recognize the different roles or job functions that need access to various resources. These roles include administrators, managers, analysts, or other custom roles based on the organization's needs.
-
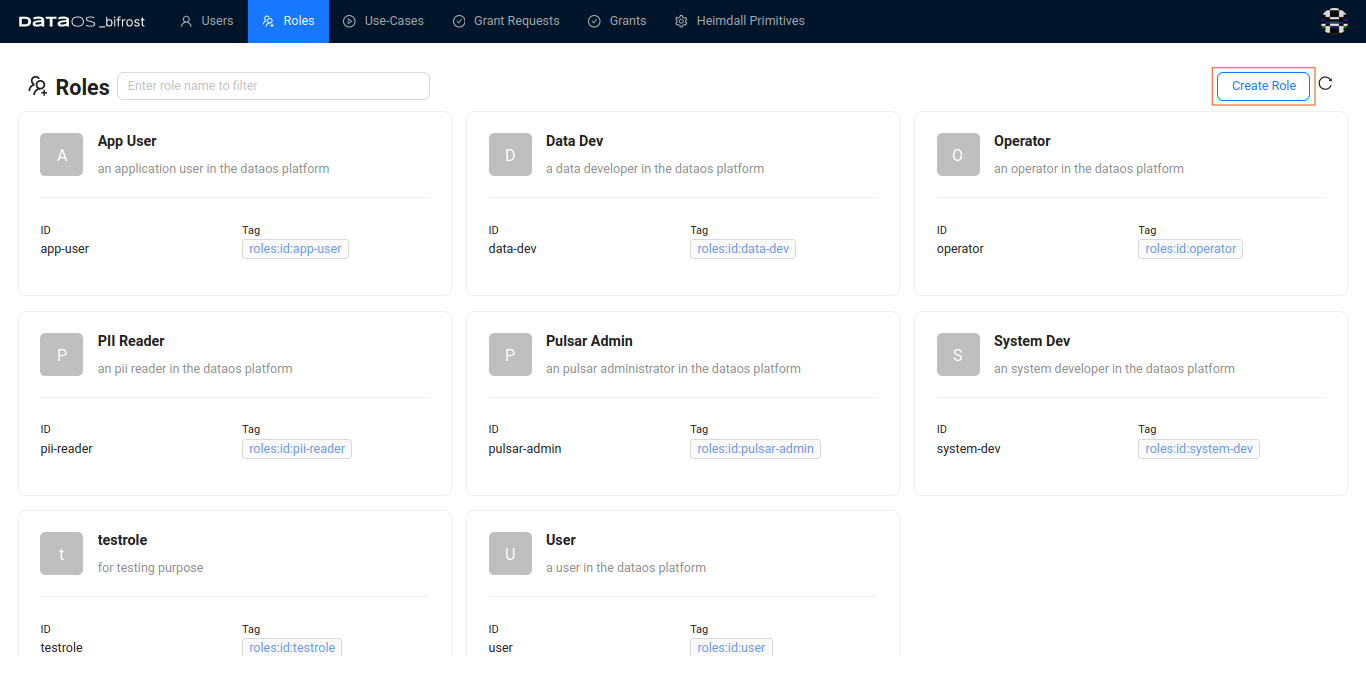
On Bifrost, navigate to the Roles. You can see some default/predefined roles. Click on the “Create Role” button in the top right corner.
-
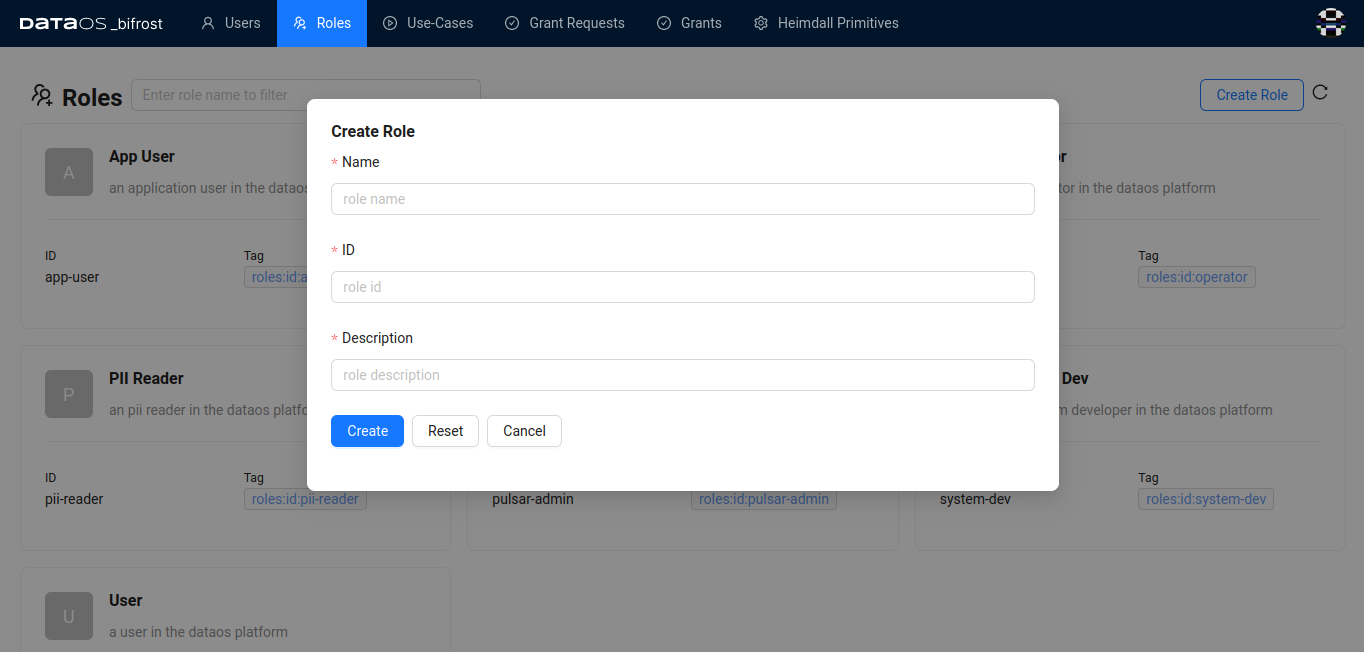
Provide a Name for the role, such as "test role" or “Test Role”s, and add a description if needed. Now, Click on the "Create" button to finalize the role creation.
-
The organization's users are now assigned the appropriate roles based on their job functions or responsibilities. Navigate to the users and select the desired user.
-
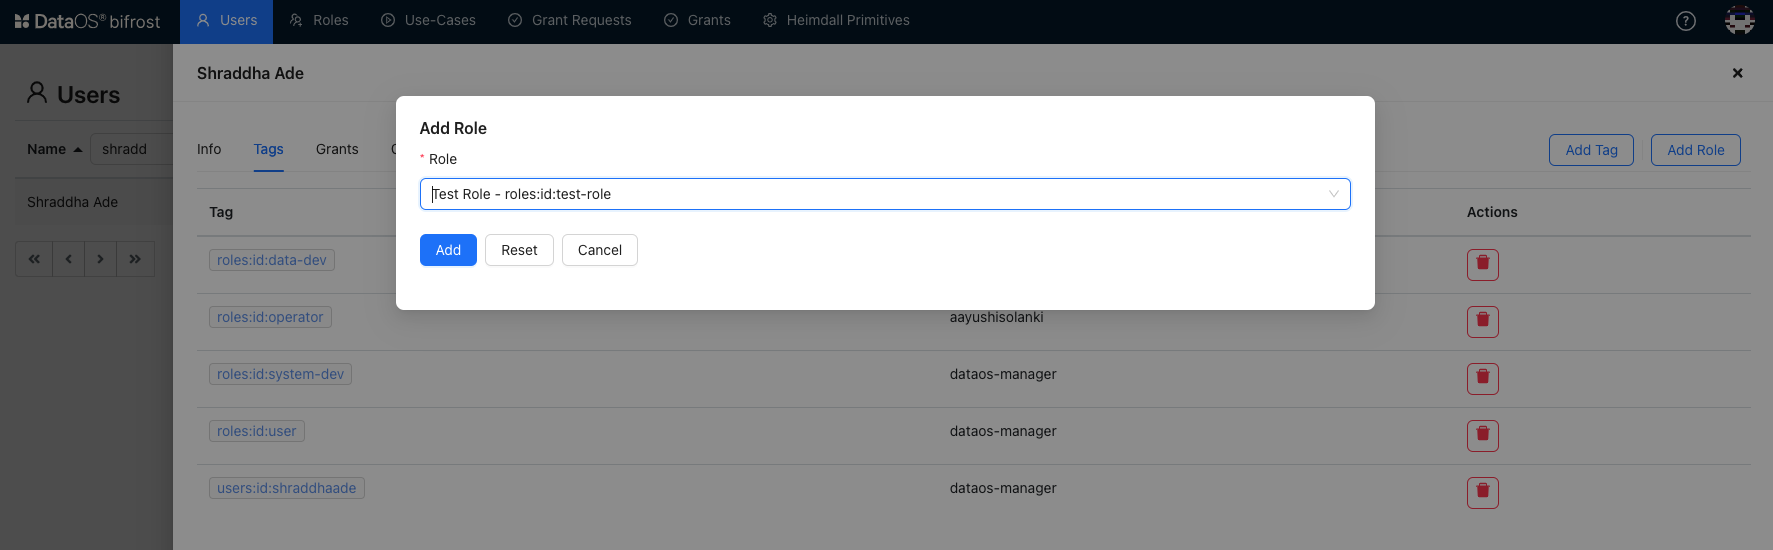
Click anywhere on the user's row to access their details. Now, proceed to the "tags" section and click the "Add Role" button.
-
Search for "Test Role" and select it from the options provided. Click on "Add" to assign the role.
-
Upon successful assignment, the
roles:id:test-rolerole will be added to the user's existing tags and roles list.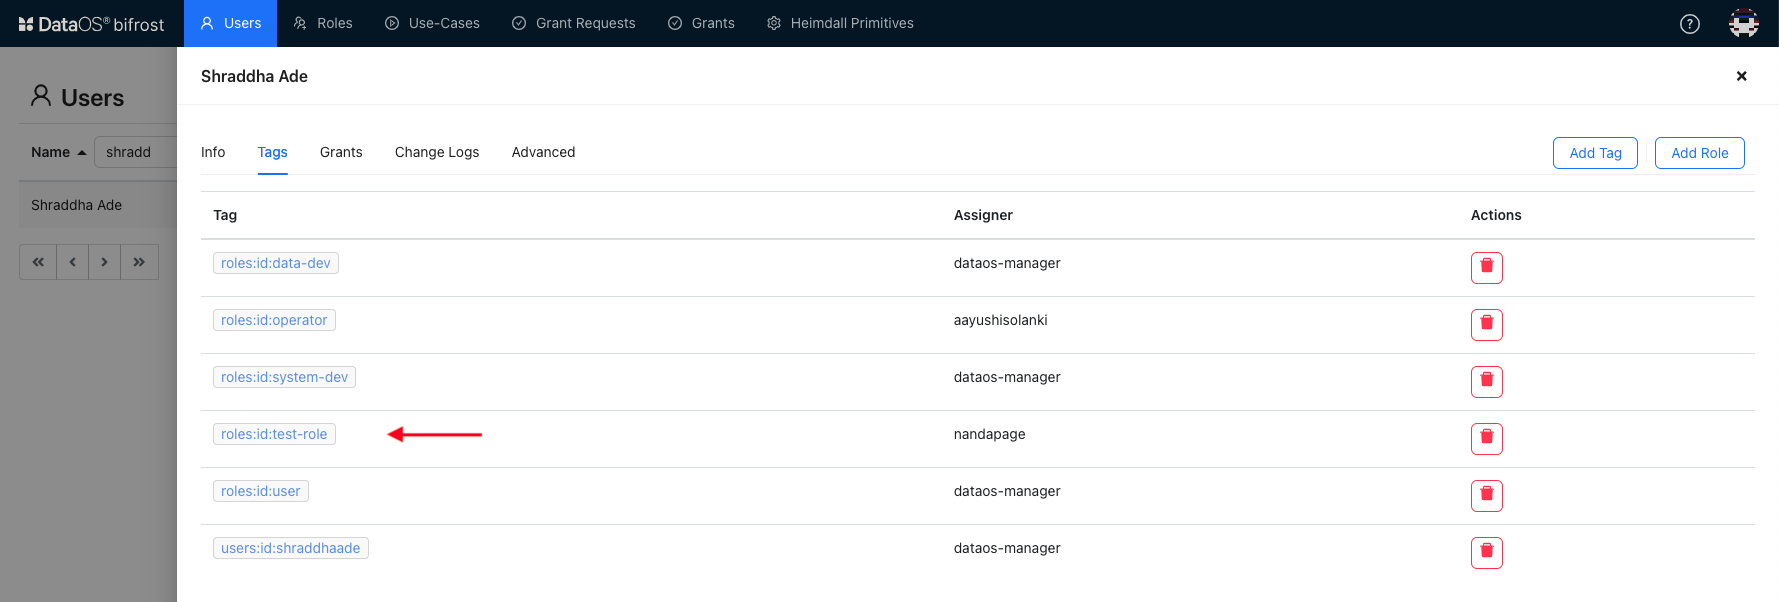
Secret Management
Operators can create an Instance Secret, a DataOS Resource for securely storing sensitive information. This secret can store credentials, keeping them out of codebases and configuration files. It can then be referenced by other DataOS Resources, such as Depots, for secure source system connections.
The following YAML shows the Instance Secret creation.
name: depotsecret-rw # Resource name (mandatory)
version: v1 # Manifest version (mandatory)
type: instance-secret # Resource-type (mandatory)
tags: # Tags (optional)
  - just for practice
description: instance secret configuration # Description of Resource (optional)
layer: user
instance-secret: # Instance Secret mapping (mandatory)
  type: key-value-properties # Type of Instance-secret (mandatory)
  acl: rw # Access control list (mandatory)
  data: # Data section mapping (mandatory)
    username: iamgroot
    password: yourpassword
Click here, to access the comprehensive Resource specific documentation on dataos.info.
Data Source Connectivity
Operators can create a Depot, a DataOS resource that connects various data sources to DataOS. Depot enables users to establish connections and retrieve data from multiple data sources, such as file systems, data lake systems, database systems, and event systems without moving the data.
name: depotsecret
version: v2alpha
type: depot
tags:
  - snowflake
  - depot
layer: user
depot:
  type: SNOWFLAKE
  description: testing instance secrets using snowflake depot
  spec:
    warehouse: mywarehouse
    url: avengers.central-india.azure.snowflakecomputing.com
    database: mydatabase
  external: true
  dataosSecrets:
    - name: depotsecret-rw
      keys:
        - depotsecret-rw
Click here, to access the comprehensive Resource specific documentation on dataos.info.
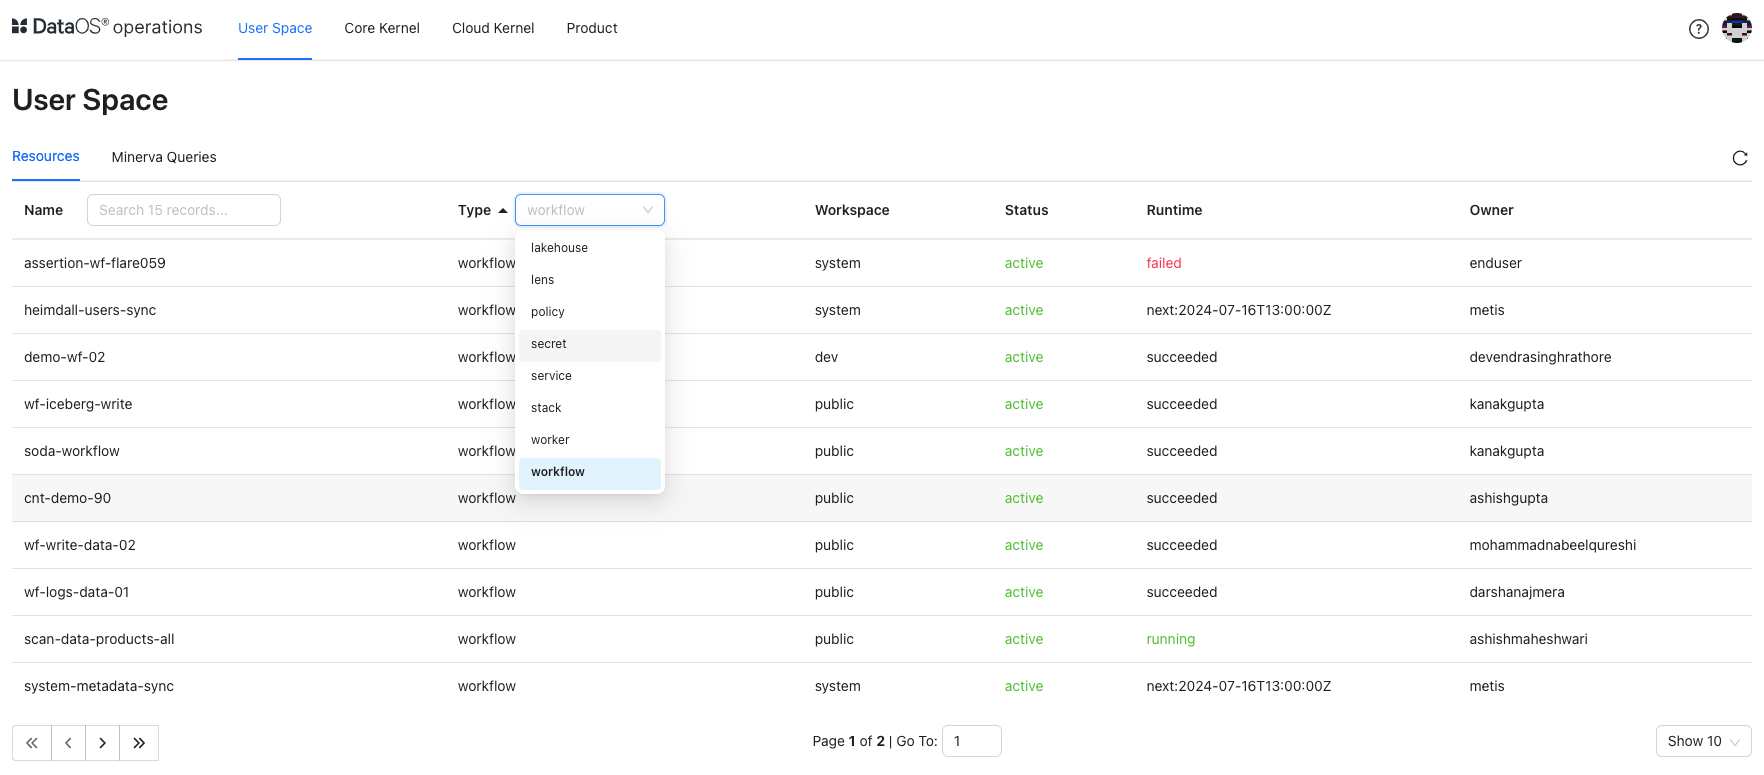
Monitoring DataOS Resources
Track user, core, and cloud kernel resources, monitoring their utilization and allocation levels directly from the Operations App's interface.
-
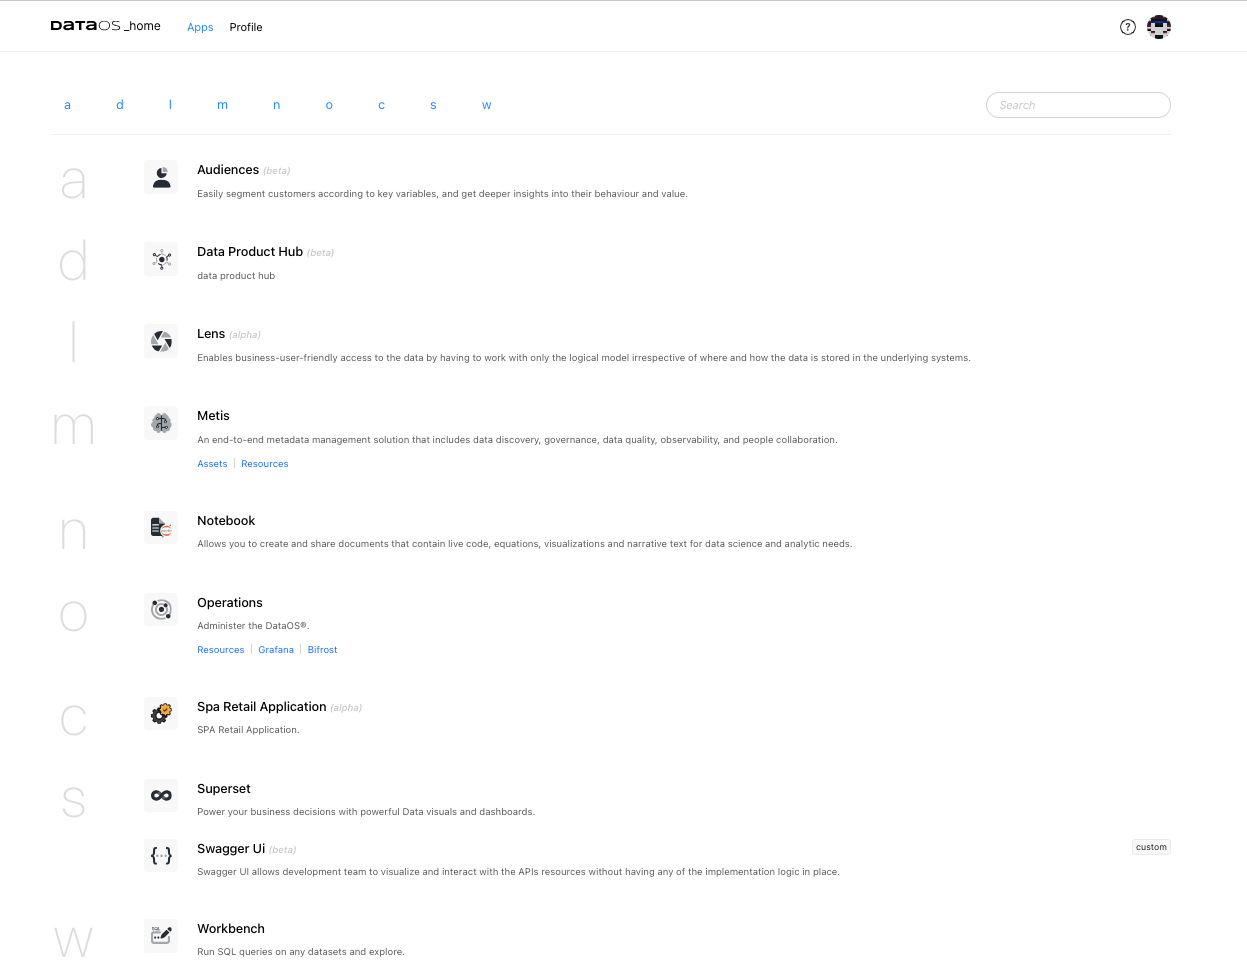
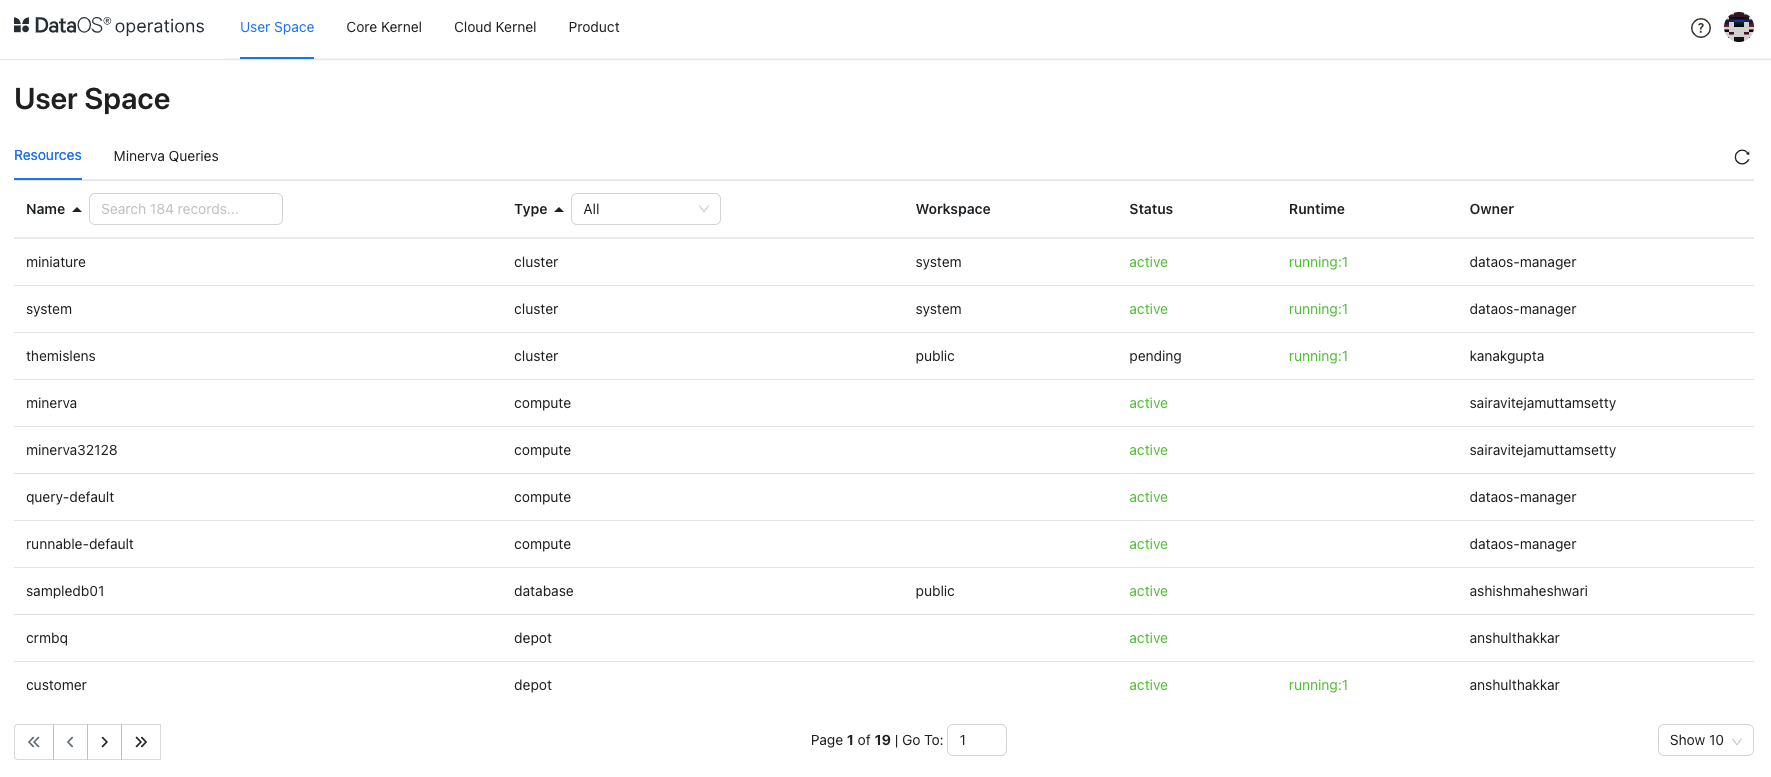
Login to DataOS and click on the Operations app.
-
You can monitor Core Kernel, and Cloud Kernel resources along with resources created by DataOS users,
-
The "Resources" tab shows the user-created DataOS Resources, such as workflows, services, secrets, depots, clusters, compute, etc. This information includes insights into the current running status of these resources, and the owner or creator of each resource.
-
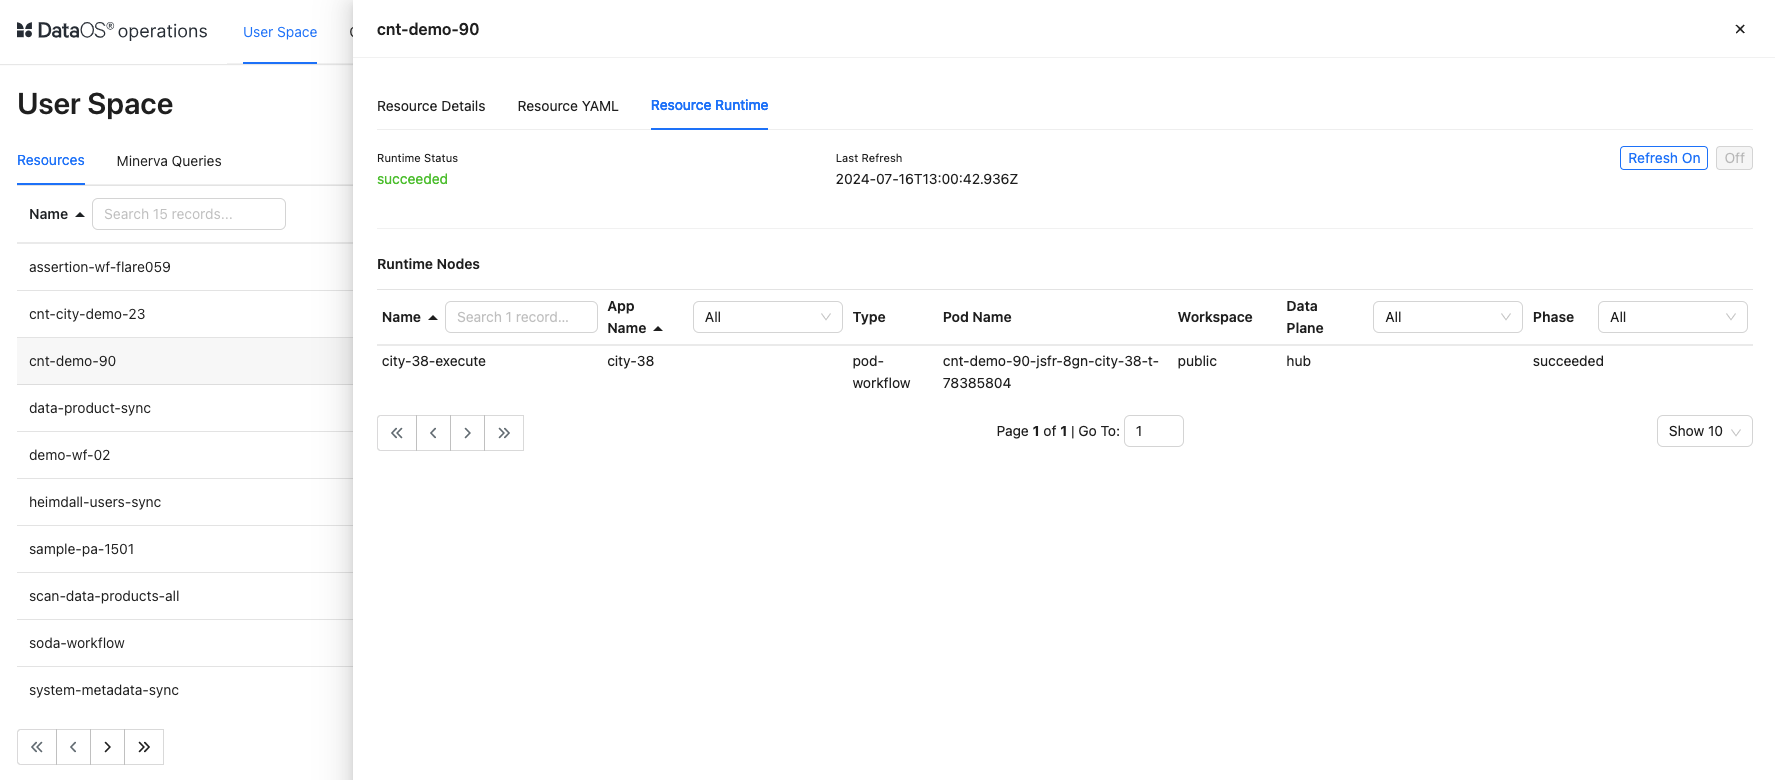
Click on the resource to get its details, YAML, and runtime information.
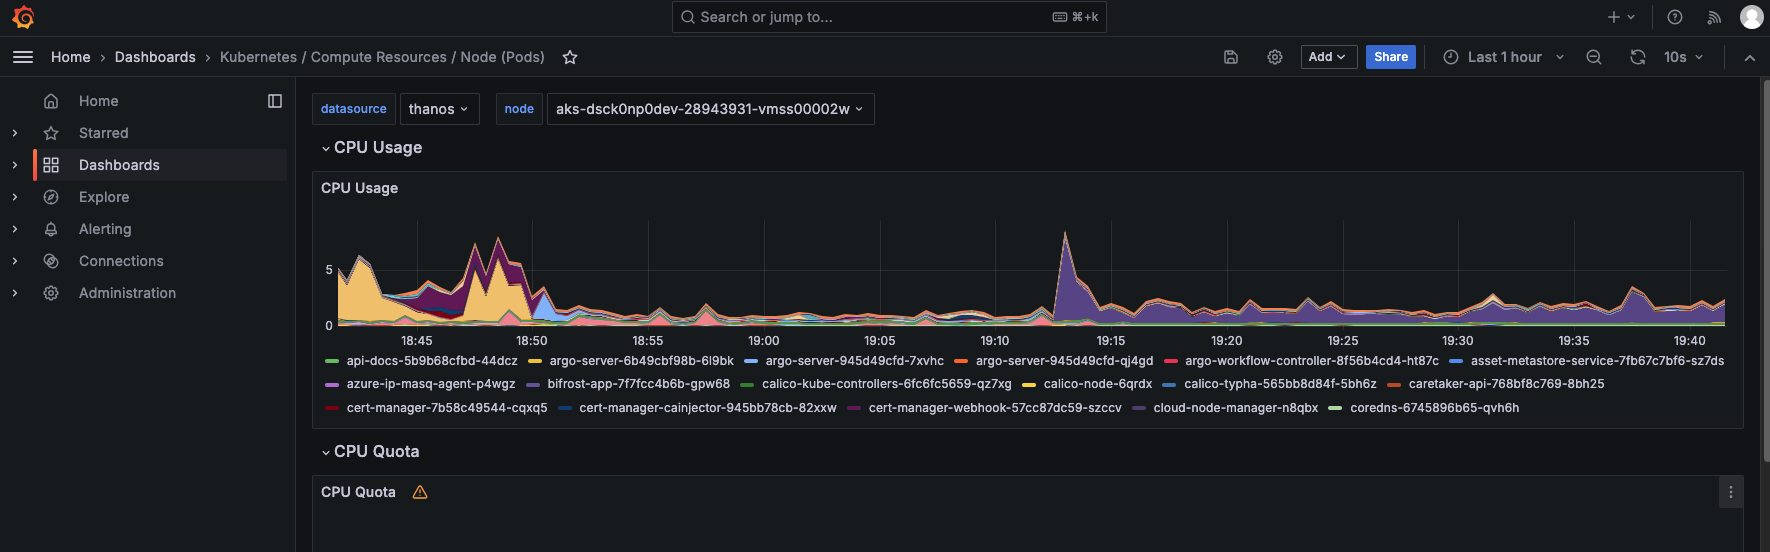
Monitoring DataOS Infrastructure
Grafana allows you to observe Kubernetes resource (compute & storage) utilization with built-in dashboards. You can leverage Grafana integration to visualize and explore metrics, logs, and traces within the DataOS environment.
-
Login to DataOS and click on the Operations app.
-
On Grafana, you can find a list of various dashboards designed to monitor resources.
-
Select the dashboard from the list.