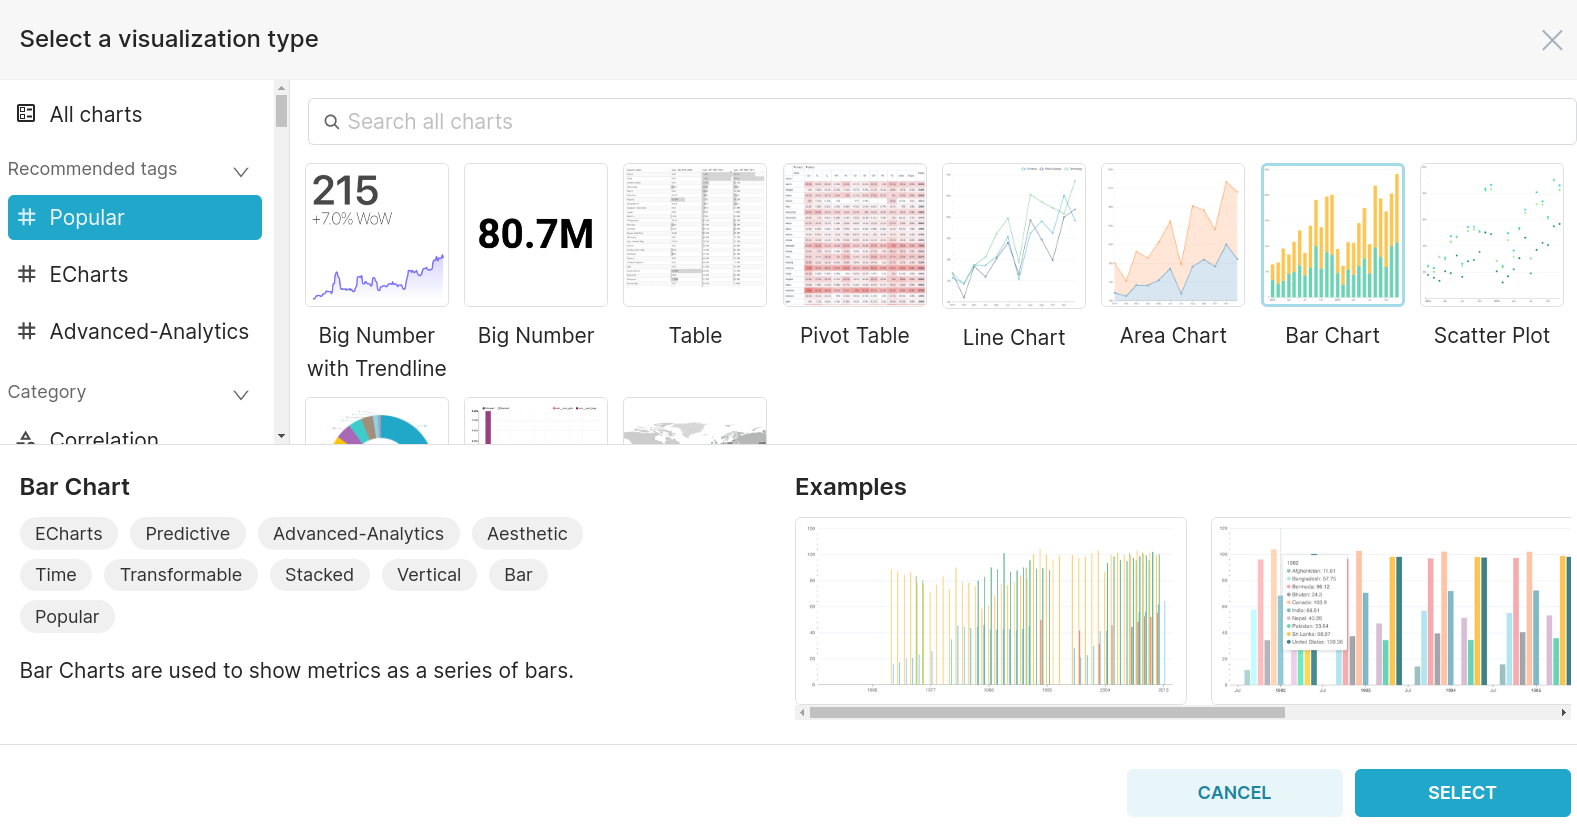
Bar Chart
The Bar Chart in Superset is a visualization that presents data using rectangular bars. Each bar's length corresponds to the value of a metric, and bars are typically grouped by categories (dimensions) on the horizontal axis. It's effective for comparing values across different categories or displaying trends over time.

On selecting the Bar chart, you can then proceed with its components. Common components such as METRIC, FILTERS, ROW LIMIT, SORT BY, ROLLING FUNCTION, PERIOD, and MIN PERIOD are already covered in the 'Common Charts Components' section for reference.

- X-Axis: (Mandatory)
- Represents the horizontal axis, typically displaying time or categorical data.
- Time Grain: (Mandatory)
- Set the granularity or interval for time-based data displayed on the X-axis (e.g., daily, weekly).
- Contribution Mode: (Optional)
- View the contribution of each metric to the total.
- Series Limit: (Optional)
- Restrict the number of series (areas) displayed on the chart.
- Truncate Metric: (Optional)
- Truncate long metric names for better visualization.
- Show Empty Columns: (Optional)
- Toggle to display or hide columns with no data.
- Time Comparison: (Optional)
- Enable time comparison to compare data over different periods.
- Time Shift: (Optional)
- Shift the time axis to compare data at different time points.
- Calculation Type: (Optional)
- Specify the calculation type for the area chart (e.g., resample).
- Rule: (Optional)
- Define the resampling rule or method.
- Fill Method: (Optional)
- Choose the method for filling in missing data points during resampling.
- Annotations and Layers: (Optional)
- Add annotation layers to highlight specific points on the area chart.
- Enable Forecast: (Optional)
- Forecast Periods: Specify the number of periods for the forecast.
- Confidence Interval: This shows the range where the actual values are likely to fall, indicating the level of uncertainty. A higher percentage means a wider range.
- Yearly, Weekly, and Daily Seasonality: Enable or disable seasonality patterns at different intervals.
These components offer a detailed breakdown of the various settings and options for configuring a bar chart in Superset.