Data Product discovery
Discovering data among thousands of datasets is difficult without rich metadata and faceted search. The Data Product Hub is used as a single Data Product catalog that aggregates metadata about all Data Products and presents the appropriate information to users based on their needs. The Data Product Hub is intended to help data consumers make timely decisions with the right data.
A user-friendly interface is provided for Data Product discovery. Data Products can be discovered through a variety of strategies, including keyword searches and filters.
.png)
How to discover the Data Products of interest ?
The Data Product discovery process is simplified with the following strategies.
Keyword search
Search is available in the top right menu bar across the Data Products page within the Data Product Hub home page.
A simple yet powerful way to find Data Products is provided by typing the name, description, or owner in the search interface. By default, matching Data Products are displayed, grouped by use cases. The Data Product’s name may be human-readable or a unique identifier.
The search functionality offers a seamless experience where results filter in real-time as you type. Selecting a suggestion populates the search bar with the product title, and the search input clears automatically after navigation to prevent accidental clicks.
%20(1).png)
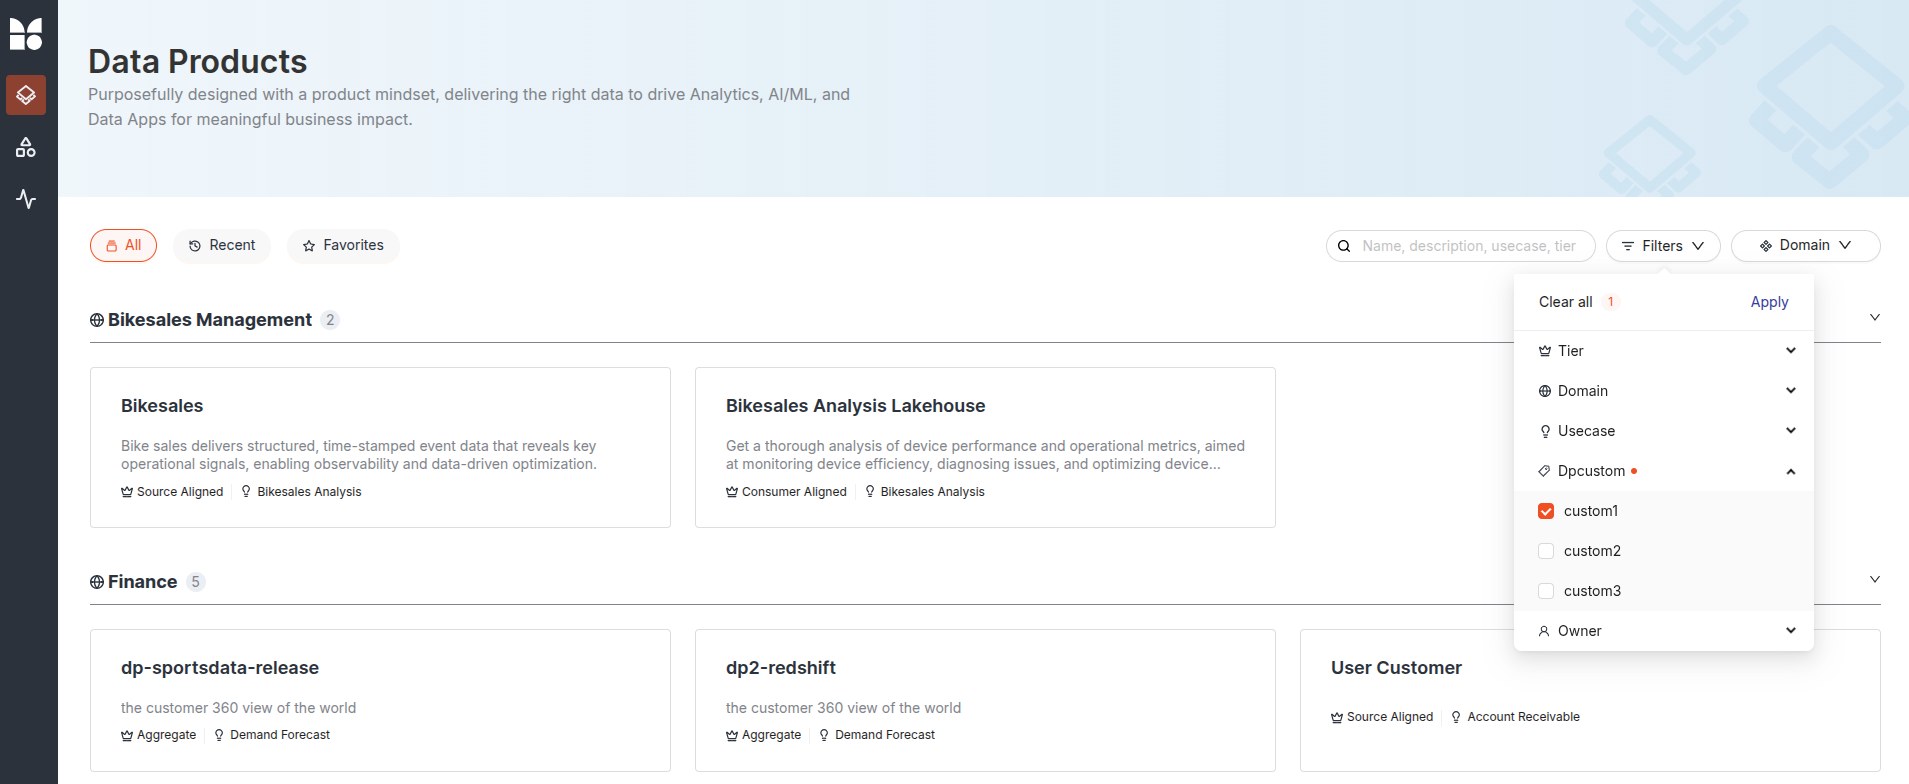
Filters
Multiple filter options further help narrow the search using parameters such as Tier, Domain, Owner, and Custom Tag Groups.
-
Tier: Describes how the Data Product is organized, whether it follows a medallion architecture, is source-aligned, or is structured around specific entities or consumer needs.
-
Domain: Specifies the business domain to which the Data Product belongs. Multiple domains can be selected at once to filter for the desired Data Product.
-
Owner: Filters can be applied by owner, allowing users to direct questions to the appropriate person or team. The owner's DataOS User ID is used to list the various owners in the Owner dropdown, and only a single owner can be selected at a time.
-
Custom Tag Groups: Configurable filters based on Metis tag groups allow organizations to tailor product discovery to their governance models. These filters appear alongside existing options, supporting multi-selection within a group (combined using logical AND). Selected tags are displayed as badges on Data Product cards and detail pages.
Filters
Categorize by domain
By default, the search results are categorized by use cases, and they can also be categorized by domains.
%20(1).png)
Recently searched Data Products
Recently searched Data Products can be found in the 'Recent' tab, as illustrated below. Note that clearing the cache will remove all recently searched Data Products from the 'Recent' tab.
%20(1).png)
Favorites
All starred Data Products can be found in the 'Favorites' tab.
%20(1).png)
Get a quick glance of the Data Products
For each Data Product displayed on the Data Products page, some basic information is shown on the Data Product card. The name of the Data Product, description, tier, and domain information can be viewed for each Data Product, while each one is categorized by use-case.
.png)
A preview of the Data Products is provided by the Data Product Hub on the right-side panel. Clicking on the space next to the relevant Data Products allows for a quick preview.
Detailed view of the Data Products
On clicking a Data Product, an interface is opened that provides an overview of the Data Product. In the following section, each part of the Data Product Hub interface is explained in detail.
Top panel
The top panel of the Data Product details page displays the domain, name of the Data Product, description, Git repository link, JIRA link, tier, use case, and owner.
Additionally, a button showcasing conformance with defined Accuracy, Completeness, Freshness, Schema, Uniqueness, and Validity quality checks is displayed.
%20(1).png)
Other details in the top panel
Details on the top right of the data product details page include:
- Add to Favorite: By clicking the star icon (⭐), the respective Data Product can be added to Favorites.
- BI Sync: Opens the BI sync functionality, enabling the Data Product to be synced to PowerBI, Tableau Cloud, Tableau Desktop, and Apache Superset.
- AI and ML: Allows the Data Product to be consumed in Jupyter Notebooks to power AI and ML use cases.
- App Development: Enables syncing of the data product using REST and GraphQL APIs to power data applications.
- Data API: Allows the creation of Data APIs on top of the Data Product.
-
Explore: Opens the Data Product for further exploration.
.png)
Other details in the top panel of Data Product details
Data Product tabs
There are separate tabs each for Overview, Inputs, Outputs, Model, Metrics, Data APIs, Quality, and Access Options based on the respective data asset selected. Let's take a look at each of the tabs.
| Tabs | Description |
|---|---|
| Overview | Displays a visual snapshot of the Data Product, from inputs to outputs, including the semantic model. |
| Inputs | Lists all tables and schemas feeding into the data product with metadata and search functionality. |
| Outputs | Shows the tables generated by the Data Product, with metadata and search options for further analysis. |
| Model | Displays the semantic model, transforming inputs into insights for easier analysis. |
| Metrics | Allows exploration of key business Metrics derived from the data product's Lens models. |
| Data APIs | Lists available API endpoints for building data applications, with detailed descriptions and access info. |
| Quality | Provides insights into data quality checks, including completeness, freshness, and accuracy trends. |
| Access Options | Offers connection options to BI, AI, ML, and app development tools like Power BI, Excel, and Jupyter Notebook. |
Overview tab
The Overview Tab will display the visual snapshot of your Data Product's work: from input to output, including the semantic model, Metrics , and access options.
%20(1).png)
The 'Inputs' section displays all the datasets that are fed into the Data Product, while the 'Output' section lists the materialized dataset that are generated from it. An output does not need to be present for a Data Product, as there can be Data Products that expose models. Only one model is presented by a Data Product at a time, along with its associated Metrics. Metrics are not available if the model is not built on top of the Data Product. The 'Access Options' lists all the available consumption options for sharing the Data Product.
Inputs tab
Within the Inputs Tab, all tables and their schemas that feed into the Data Product, including those sourced from other Data Products, are displayed. For each table, the name of the table, tier, domain, owner, access permission, Uniform Data Link (UDL) address, and the various Data Products the particular table is part of are shown.
Below that, a search bar is provided to enable searching for various columns within the table. Other details of a specific column, such as data type, description, tags, and glossary terms, can also be viewed.
Additionally, a specific table can be opened within Metis, the DataOS catalog, to get comprehensive metadata of that table, or in the Workbench App for exploratory analysis using SQL.
%20(1).png)
To learn more about access permissions, click 'Restricted Access', which will open a right panel as shown below.
.png)
Information about the filters and policies applied to the input dataset is provided in the restricted access panel, as shown in the above image. If data masking is applied, the panel will indicate which column is masked along with the masking policy type.
Outputs tab
The materialized tables generated by the Data Product are displayed in the Output Tab, ready for use on their own or for combining with others to create new insights and Data Products. For each table, the name of the table, Tier, Domain, Owner, Access Permission, Uniform Data Link (UDL) Address, and the various Data Products the particular table is part of are shown.
Below that, a search bar is provided to enable searching for various columns within the table. Other details of a specific column, such as Data Type, Description, Tags, and Glossary Terms, can also be viewed.
Additionally, a specific table can be opened within Metis, the DataOS Catalog, to get comprehensive metadata of that table, or in the Workbench App for exploratory analysis using SQL.
%20(2).png)
Model tab
A data model, representing the Lens model built on top of the Data Product, is displayed in the Model tab, shaping the data into meaningful insights for easier analysis and understanding.
%20(1).png)
Metrics tab
Key business Metrics derived from the data models(Lens model) can be explored in the Metrics tab to observe performance and make data-driven decisions with ease.
-
In the image below, a metric 'Cloud Service Cost' is shown along with its description and the number of measures, dimensions, and segments used to derive the Metric. By clicking on the quick insights or explore link, the Metrics can be further explored.
%20(1).png)
Quick Insights and Explore -
Below, the references section is shown, which displays the lineage, including the flow and the dataset from which the Metric is derived.
%20(1).png)
References -
The measures and dimensions sections provide details of each dimension and measure used to derive the Metric, including the name, data type, description, and alias.
%20(1).png)
Measures and Dimensions
Data APIs tab
API endpoints for developing data applications can be explored in the Data APIs tab.
-
On the Data APIs tab, all API endpoint collections are listed. By clicking on a particular endpoint, a short description of the API collection is displayed, as shown below.
%20(1).png)
API Endpoint Collections -
The OpenAPI specifications and Postman collection for each endpoint can be downloaded by clicking on Download OpenAPI Spec and Download Postman Collection, respectively.
%20(1).png)
Download OpenAPI spec and Postman collection -
After downloading the OpenAPI spec and Postman collection, open the Postman application to proceed further.
.png)
Postman Application -
Navigate to collections in Postman, click on import, and select the files option to choose the downloaded JSON file.
%20(1).png)
Import collection -
The View complete documentation link will open the OpenAPI documentation, as shown below.
%20(1).png)
View Complete Documentation -
To hit the API endpoint in Postman, click on the 'Open request' link, as shown in the above image, which will open the interface below.
.png)
Open Request -
Hover over the
{{baseUrl}}, and copy the base URL..png)
Copy the Base URL -
Paste the copied URL in place of {{baseUrl}}, provide the DataOS API key as a bearer token, and click on send to access the data, as shown below. This API endpoint, along with the bearer token, can be used to build your data application.
%20(1).png)
Paste the copied URL -
On the Data APIs tab, clicking on a particular API endpoint will display information about who has access to the endpoint, the endpoint's description, authorization details, response details, and response samples.
%20(1).png)
API Endpoint Access -
Authorizations - bearerToken indicates that the API requires an authorization token, specifically a Bearer Token for authentication. A Bearer Token is a type of token that must be included in the HTTP header when making requests to the API. The format of the token is JWT (JSON Web Token), which is a compact, URL-safe means of representing claims to be transferred between two parties.
.png)
Authorization -
In the Responses section, a 200 response indicates that the request was successful, and the API is returning data as expected. The response schema is in application/json format, meaning the data will be returned in JSON format. The response schema defines the structure of the data returned when the API responds with a 200 (OK) status.
.png)
Response section In this case, the API returns the following fields:
-
total_revenue (string): This field provides the total revenue generated by the brand. The value is expected to be a string, even though it represents financial information. The description indicates that this data provides insight into the financial performance of the brand.
-
brand (string): This field contains the name of the brand being analyzed. It represents the company related to the revenue data.
The 5XX status code refers to a server-side error. If the API is unable to process the request due to an internal issue or failure, it will return a 5XX response. This indicates a problem on the server, not with the client's request. Server-side errors generally imply that something unexpected happened on the server while trying to handle the request, and the client cannot resolve these issues without intervention from the server team.
-
-
The Response Samples section provides an example of what the successful 200 response would look like when calling this API. The sample JSON response shown in the image below contains two fields: total_revenue and brand. In this sample, both
total_revenueandbrandare represented as placeholder strings. In a real response,total_revenuewill be a string representing the revenue (e.g.,"10000 USD"), andbrandwill be the actual brand name (e.g.,"Nike")..png)
Response Samples GET /top_brand_list is the API endpoint that is called using the HTTP
GETmethod. It retrieves data related to a list of top brands. Typically,GETmethods are used to retrieve data from a server without modifying it.
Quality tab
The Quality tab provides insights into the health and quality of input and output data, allowing for monitoring and ensuring that the data meets expected standards across several quality checks. Within DataOS the quality checks are created using Soda Stack.
Quality is categorized into six types: Schema, Freshness, Validity, Completeness, Uniqueness, and Accuracy.
| Category | Description |
|---|---|
| Freshness | Reflects how up-to-date and timely the data is. |
| Schema | Keep an eye on your data structure, ensuring everything is aligned and consistent. |
| Validity | Check that your data follows the expected rules and formats, keeping things on track. |
| Completeness | Ensure you have all the data you need, without gaps or missing pieces. |
| Uniqueness | Verify that your data stays clean and non-duplicated, providing clear, trustworthy results. |
| Accuracy | Confirms that the data correctly represents the real-world values and facts it models. |
-
In the image below, aspects such as completeness, schema validation, uniqueness, and accuracy are tracked.
%20(1).png)
Quality Tab -
In the above image, the data shows 100% completeness, ensuring that essential fields do not contain missing or null values.
-
The trend chart displays completeness over time. The y-axis represents completeness as a percentage (0-100%), while the x-axis represents the timeline. In this case, the chart indicates consistent 100% completeness for the period shown (up to September 13th), meaning no data was missing.
.png)
Trend chart -
Below, you can see the applied checks and their status. In this case, for the
f_salesdataset, the completeness check focuses on ensuring that critical columns are fully populated. Thef_sales_invoice_no_completeness_of_the_invoice_number_columncheck ensures that theinvoice_numbercolumn in thef_salesdataset does not have missing or null values. A green checkmark (✔) indicates that the check has passed successfully. In this case, there are no missing invoice numbers, and the dataset is 100% complete in this aspect..png)
Applied Checks and their status
Access options tab
The Access options tab allows users to connect their Data Products to various BI (Business Intelligence), AI and ML, app development, and Data API tools such as Power BI, Excel, Tableau, Apache Superset, and Jupyter Notebook.
%20(1).png)
To know more about access options, please refer to this section.
Perspectives
In the Perspective tab, saved explorations of the Data Products can be accessed as Perspectives.
Perspectives provide flexible options for sharing and management:
- Public and Private: Perspectives can be public (shared commonly used views) or private (personal views).
- Management: Perspective owners can edit and delete their saved perspectives.
- Collaboration: Non-owners can modify public perspectives and save the changes as a new perspective, preserving the original.
- Visibility: Indicators and filters help users quickly identify perspectives they own versus those shared by others.

How to create a Perspective?
Follow the steps below to save your Data Product exploration as a Perspective, allowing you to access it later in the Perspective tab.
-
Choose the Data Product of choice and navigate to the Explore button.
%20(1).png)
Choose and Navigate -
Click the Explore tab to begin exploring the Data Product.
.png)
Navigate to Explore Tab -
After exploration, navigate to the Save Perspective button.
.png)
Save Perspective -
Clicking the Save Perspective button will open a dialog box prompting users for the name and description of your perspective.
.png)
Dialogue Box -
Provide a name and, optionally, a description for the exploration, then click on Save.
.png)
Save
How to access the Perspectives?
After saving the exploration as a perspective, follow the steps below to access it later in the Perspective tab.
-
Navigate to the Perspectives tab, where all perspectives are accessible by name, tags, data product, and owner.
.png)
Navigate to Perspectives Tab -
In the search bar, perspectives can be directly searched by name or keywords used in the name.
.png)
Search -
Perspectives can be filtered by owners. Navigate to the Filters dropdown, click on the Owner option, and select the owner of choice.
.png)
Filter -
Similarly, perspectives can be filtered by Data Products and Tags, just as with Owner.
%20(1).png)
Filter using 'Data Products' %20(1).png)
Filter using 'Tags' -
For example, selecting the corp-market-performance Data Product in the filters options will list all the Perspectives created for that Data Product, as shown below.
%20(1).png)
List Perspectives -
Clicking on any Perspective will redirect you to the explore page of the Data Product for which the particular Perspective is created, as shown below, allowing you to continue your exploration.
.png)
Explore
Metrics
In the Metrics tab, key insights of the Data Products can be accessed to gather information, assess operations, and make quick, informed business decisions. To explore the Metrics tab, navigate to it, and a short description will be displayed. By default, all Metrics are displayed grouped by use cases.
.png)
.png)
Search the Metrics by keyword
Metrics of interest can be directly searched in the search bar by entering the name or keyword used in the Metric name, as shown below.
.png)
Filter the Metrics
Metrics can be filtered by a particular owner by navigating to the Filter dropdown, clicking on Owners, and selecting the desired owner.
.png)
Metrics recommendations based on domains
By default, the Metrics tab recommends Metrics grouped by use cases. To get Metric recommendations based on the domain, navigate to the Use-case dropdown, select the Domain option, and the Metrics will be grouped by domains.
.png)