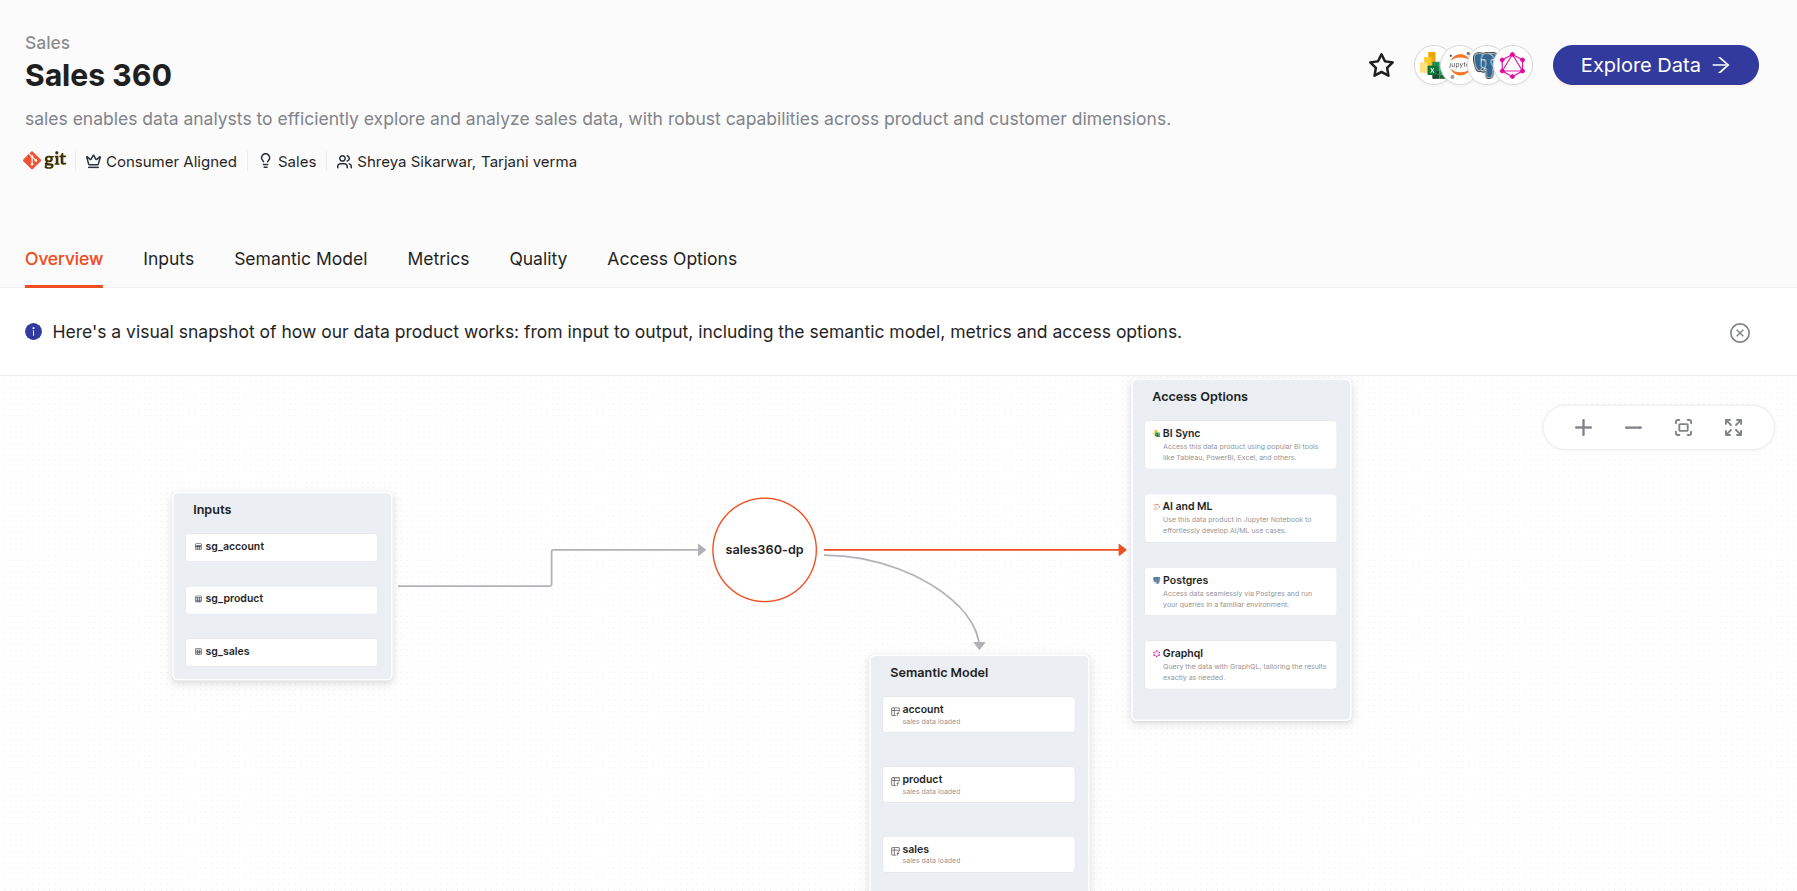
Observability for Data Product Metrics in DataOS
This section provides step-by-step instructions to observe the Sales 360 Data Product in DataOS, so users can continuously monitor core business KPIs (e.g., gross_profit_margin) to receive immediate alerts when those metrics degrade and route incidents to the Teams channel or email.
Define the use case: Gross profit margin drop
Business Need: If profitability slips below 25 %, downstream stakeholders (finance, sales ops) should be notified immediately to investigate pricing, cost, or discount policies.
Prerequisites
Ensure the following prerequisites are satisfied before configuring the Monitor and Pager Resources:
-
Access privileges must include permission to create Monitors and Pagers.
-
The target workspace must be set to public.
-
The Data Product must be sales_360, built on the Sales semantic model.
-
An incoming webhook endpoint must be available for alert delivery (e.g., Microsoft Teams).
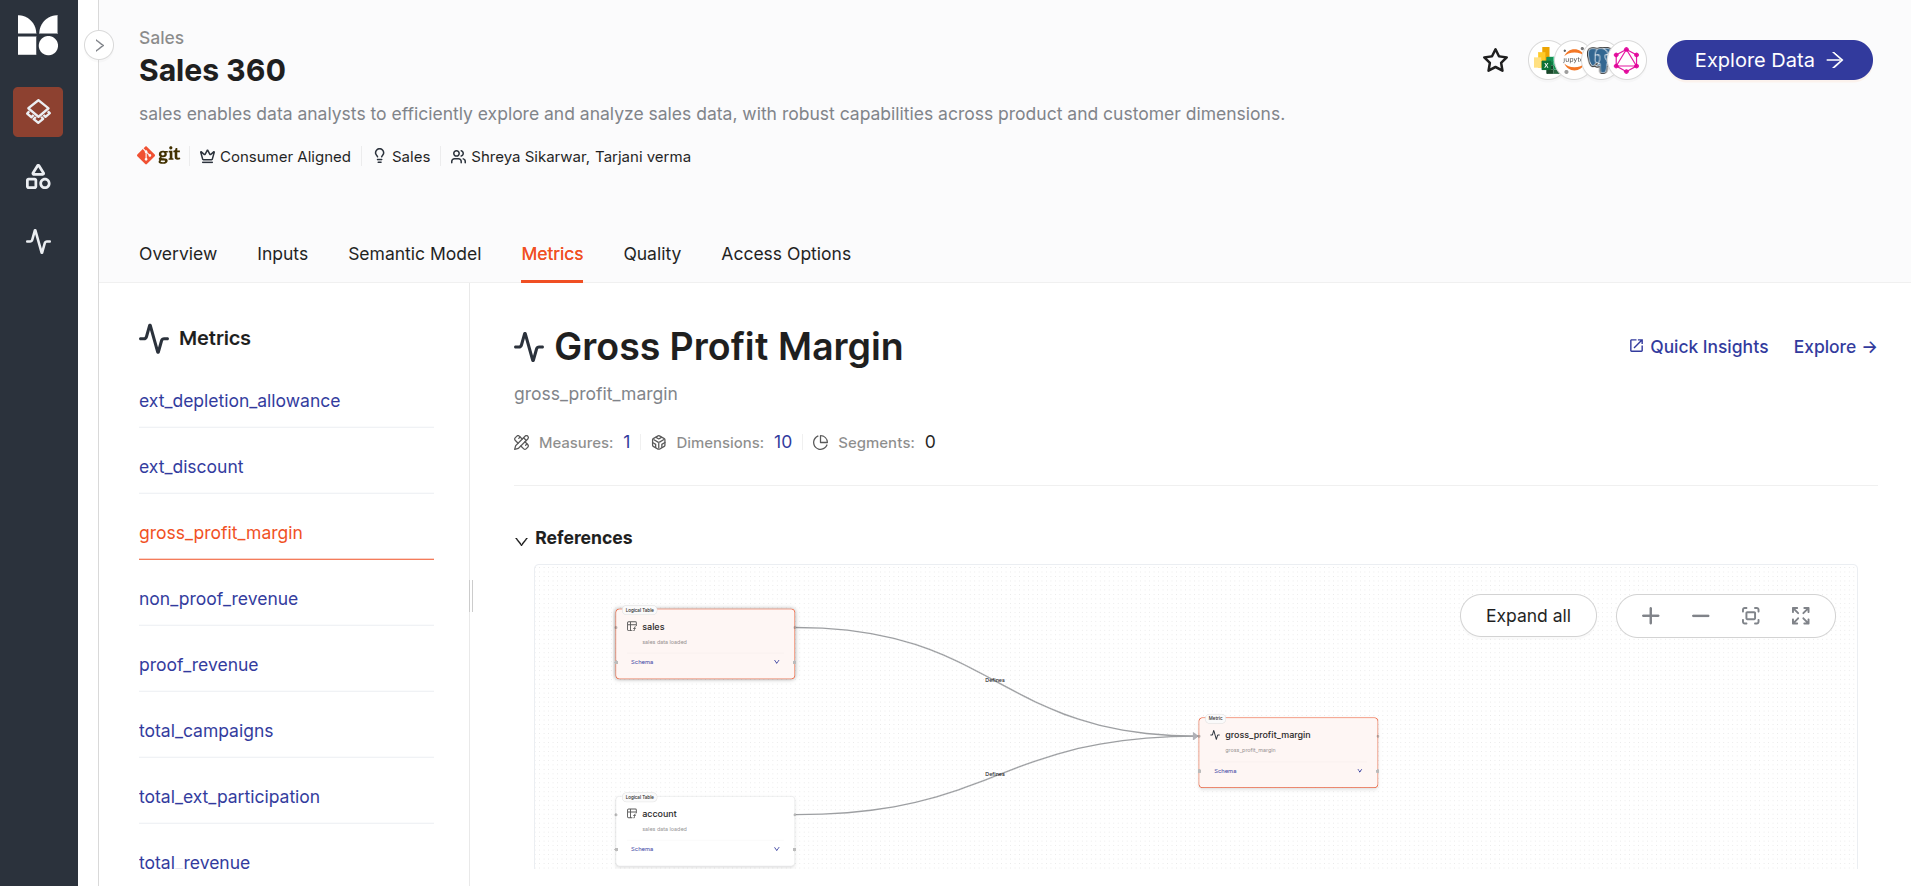
Sales 360: Key metrics
The following metrics are available in the Sales 360 Data Product:
| Metric Name | Description |
|---|---|
| gross_profit_margin | (Revenue – COGS) ÷ Revenue; indicates overall profitability |
| ext_discount | Total external discount amount applied within the period |
| ext_depletion_allowance | Allowance rebates granted to external partners |
| non_proof_revenue | Revenue not attributable to warranty/proof items |
| proof_revenue | Revenue attributable to warranty/proof items |
| total_campaigns | Count of marketing campaigns active in the period |
| total_ext_participation | Number of external partners participating in rebate/allowance programs |
| total_revenue | Gross revenue generated |
Equation Monitor configuration
Equation Monitors enable scheduled comparisons between two numeric expressions. An incident is generated when the defined condition is met. In the example below, an alert is triggered if the gross_profit_margin metric falls below 25%.
Follow the steps outlined below to configure the monitor.
-
Create a manifest file for Monitor Resource defining the conditions to match and configure alerts accordingly.
name: monitor-lens-metric-testing01 version: v1alpha type: monitor runAsUser: iamgroot monitor: # Run every 10 minutes schedule: '*/10 * * * *' type: equation_monitor equation: # Left: current gross profit margin leftExpression: queryCoefficient: 1 queryConstant: 0 query: type: lens lens: dataOsInstance: name: sales360 workspace: public sslmode: 'disable' ql: SELECT gross_profit_margin FROM sales # Right: static threshold of 0.25 (25%) rightExpression: queryCoefficient: 0 queryConstant: 0.25 query: lens: dataOsInstance: name: sales360 workspace: public sslmode: 'disable' ql: SELECT gross_profit_margin FROM sales # Trigger when margin < 25% operator: less_than incident: type: business-metric name: sales360-gross-profit-margin-drop category: equation severity: info -
Apply the Monitor Resource manifest file by executing the following command:
-
Validate the Monitor Resource by executing the following command:
INFO[0000] 🔍 monitor... INFO[0000] 🔍 monitor...complete NAME | VERSION | TYPE | WORKSPACE | OWNER --------------------------------|---------|---------|-----------|-------------- monitor-lens-metric-testing01 | v1alpha | monitor | public | iamgroot STATUS | RUNTIME ---------|--------------------------------- active | next:2025-05-23T15:02:00+05:30 STARTED | FINISHED | RUN STATUS | RESULT ----------------------------|---------------------------|------------|----------------------------------------------------------------------------------- 2025-05-23T15:01:00+05:30 | 2025-05-23T15:01:00+05:30 | completed | 🟧 monitor condition not met for monitor: 'monitor_lens_metric_testing01_public' ----------------------------|---------------------------|------------|-----------------------------------------------------------------------------------INFO[0000] 🔍 monitor... INFO[0000] 🔍 monitor...complete NAME | VERSION | TYPE | WORKSPACE | OWNER --------------------------------|---------|---------|-----------|-------------- monitor-lens-metric-testing01 | v1alpha | monitor | public | iamgroot NAME | VERSION | TYPE | WORKSPACE | OWNER --------------------------------|---------|---------|-----------|-------------- monitor-lens-metric-testing01 | v1alpha | monitor | public | iamgroot STATUS | RUNTIME ---------|--------------------------------- active | next:2025-05-23T15:00:00+05:30 STARTED | FINISHED | RUN STATUS | RESULT ----------------------------|---------------------------|------------|------------------------------------------------------------------------------------------------------------------- 2025-05-23T14:59:00+05:30 | 2025-05-23T14:59:13+05:30 | completed | 🟩 monitor condition met for monitor: 'monitor_lens_metric_testing01_public', created incident id 'emqnli8bv6yo' ----------------------------|---------------------------|------------|------------------------------------------------------------------------------------------------------------------- -
The incident stream will show the incident if the condition is met. To check the incident stream, execute the following command:
INFO[0000] 🔮 develop observability...
INFO[0000] 🔮 develop observability...monitor tcp-stream...starting
INFO[0001] 🔮 develop observability...monitor tcp-stream...running
INFO[0003] 🔮 develop observability...monitor tcp-stream...stopping
INFO[0003] 🔮 context cancelled, monitor tcp-stream is closing.
INFO[0004] 🔮 develop observability...complete


{
  "id": "emqnli8bv6yo",
  "createTime": "2025-05-23T09:29:13.413314627Z",
  "properties": {
    "category": "equation",
    "name": "sales360-gross-profit-margin-drop",
    "severity": "info",
    "type": "business-metric"
  },
  "equationContext": {
    "queryExpressions": [
      {
        "leftExpressionValue": "-277973.60",
        "rightExpressionValue": "-277973.60",
        "leftRow": {
          "comparisonColumn": {
            "name": "gross_profit_margin",
            "value": "-277973.60"
          }
        },
        "rightRow": {
          "comparisonColumn": {
            "name": "gross_profit_margin",
            "value": "-277973.60"
          }
        }
      }
    ]
  },
  "monitor": {
    "id": "monitor_lens_metric_testing01_public",
    "name": "monitor-lens-metric-testing01",
    "description": "",
    "schedule": "*/1 * * * *",
    "timezone": "UTC",
    "type": "equation_monitor",
    "equationMonitor": {
      "leftExpression": {
        "queryCoefficient": 1,
        "queryConstant": 0,
        "query": {
          "type": "lens",
          "lens": {
            "dataOsInstance": {
              "name": "sales360",
              "workspace": "public",
              "sslmode": "disable"
            }
          },
          "ql": "SELECT gross_profit_margin FROM sales"
        }
      },
      "rightExpression": {
        "queryCoefficient": 0,
        "queryConstant": 0.25,
        "query": {
          "type": "lens",
          "lens": {
            "dataOsInstance": {
              "name": "sales360",
              "workspace": "public",
              "sslmode": "disable"
            }
          },
          "ql": "SELECT gross_profit_margin FROM sales"
        }
      },
      "operator": "equals"
    }
  }
}
Alert delivery via Pager Resource
Follow the below steps to set up a Pager Resource to deliver alerts to the Teams channel. Once the Monitor condition met, a Pager routes the incident payload to Teams channel.
-
Create a manifest file for Pager Resource defining the conditions to match and configure alerts accordingly.
name: pager-lens-metric-testing01 version: v1alpha type: pager runAsUser: iamgroot pager: conditions: - valueJqFilter: .properties.name operator: equals value: sales360-gross-profit-margin-drop # incident name defined in the Monitor Resource output: email: emailTargets: - iamgroot@tmdc.io - thisisthor@tmdc.io msTeams: webHookUrl: https://rubikdatasolutions.webhook.office.com/webhookb2/09239cd8-92a8-4d59-9621-9217305bf6ed@2e22bdde-3ec2-43f5-bf92-78e9f35a44fb/IncomingWebhook/99584b92553846019896d887878bcd95/631bd149-c89d-4d3b-8979-8e364f62b419/V2RNSkbzx2nbp4w4m_K6GdVTKelMynHkRK1Sw -
Apply the Pager Resource manifest file by executing the following command:
-
Validate the Pager Resource by executing the following command:
You can also access the details of any created Monitor through the DataOS GUI in the Operations App.
-
Once the Pager Resource is configured, the incident payload will be delivered to the Teams channel when the Monitor condition is met. The alert will look like below:
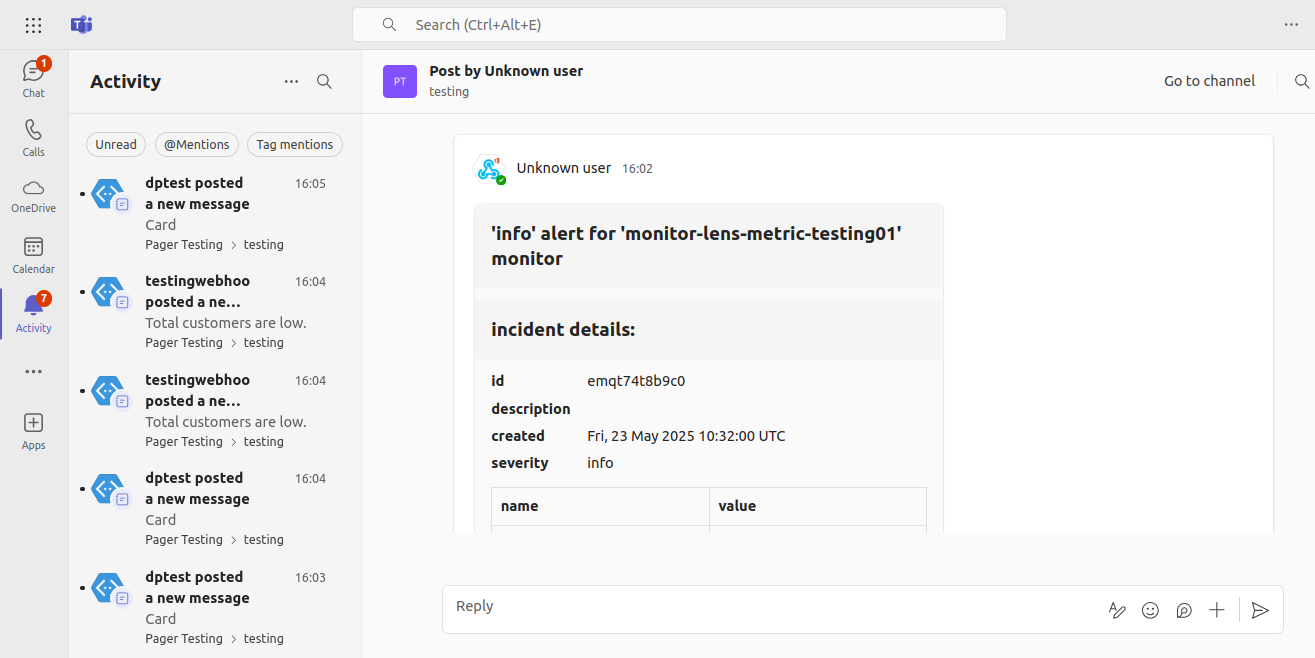
Teams Alerts
Next steps
This guide provided a reference use case for monitoring Data Product metrics in DataOS. You can extend this approach to monitor DataOS Resources runtime, status and much more that are used to develop the Data Product such as Lens Service, Flare Workflow, etc.
- Add context column to the Monitor. Learn How to add context column to the Monitors?
- Set up incidents on top of events using Report Monitor. See How to Create a Report Monitor?
- Set up incidents on top of Postgres source using Equation Monitor. See How to Create a Equation Monitor on top of Postgres source?
- Set up incidents for certificate expiration using Equation Monitor. See How to Generate incidents for certificate expiration?