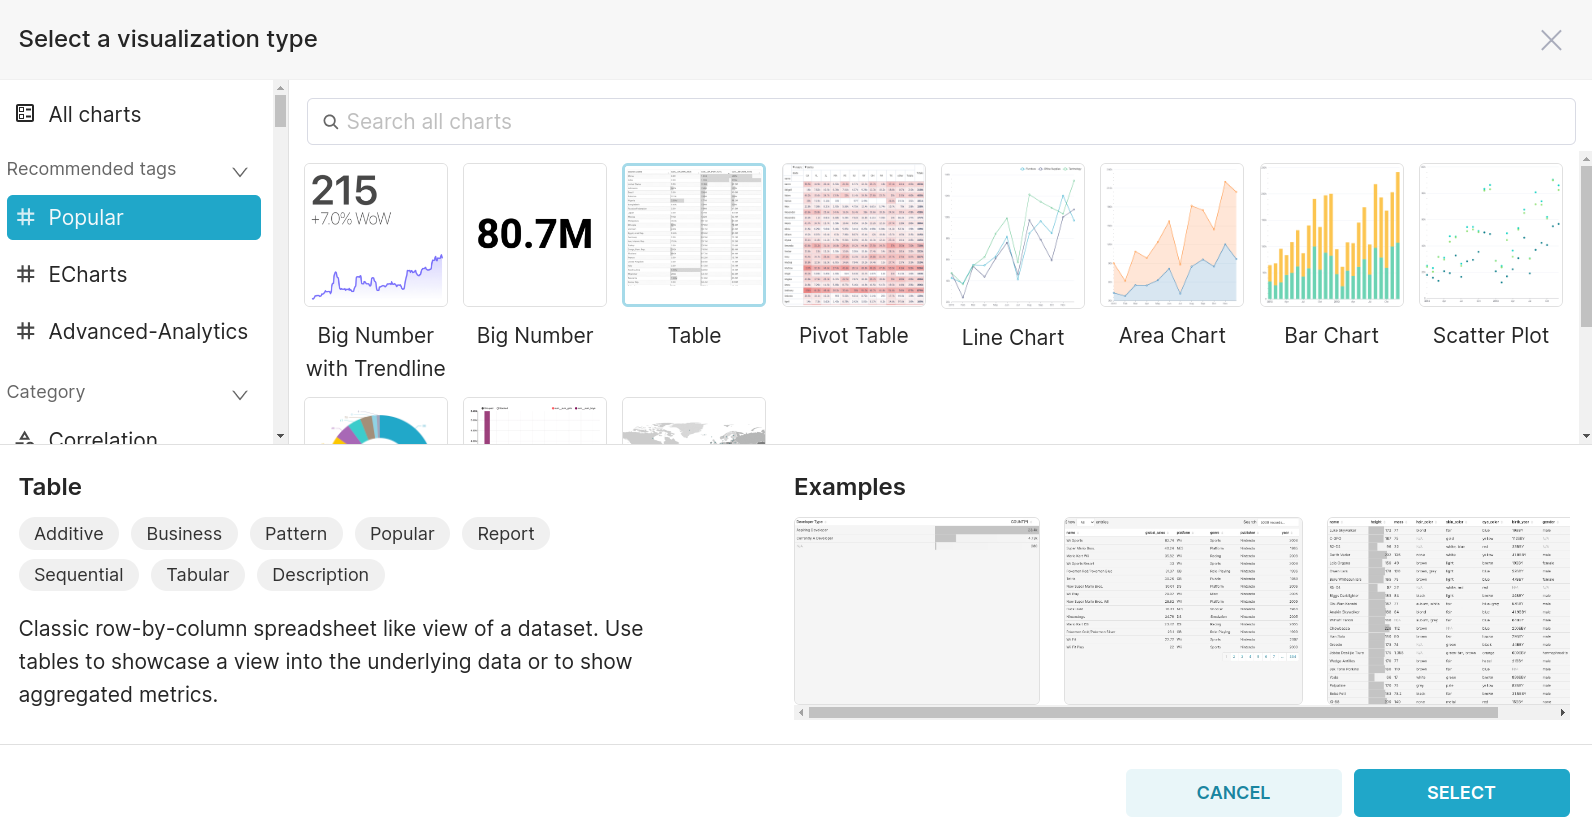
Table
In Superset, a table chart is a visual representation of tabular data, displaying information in rows and columns.

Common components such as METRIC, FILTERS, ROW LIMIT, ROLLING FUNCTION, PERIOD, and MIN PERIOD are already covered in the 'Common Charts Components' section for reference.

Let’s see its specific components one by one:
- QUERY MODE:
- The mode in which the query is executed provides options like 'Aggregate' for summarizing data and 'Raw Records’ for displaying detailed, unaggregated information.
- TIME GRAIN:
- The granularity or interval at which time-related data is displayed.
- COLUMNS:
- Represents individual fields or attributes in the raw data when the 'Raw Records' mode is selected.
- PERCENTAGE METRICS:
- Metrics are expressed as percentages, providing additional insights.
- SERVER PAGINATION:
- Enables server-side pagination for efficient handling of large datasets.
- SERVER PAGE LENGTH:
- Specifies the number of rows to be fetched from the server in each pagination request. When set to 0, it means no pagination.
- ORDERING:
- Specifies the ordering of the data, allowing users to sort the raw records based on a selected column.
- SORT DESCENDING:
- Sorts the table values in decreasing order.
- SHOW TOTALS:
- Option to display the total values for selected metrics.