Superset
Superset is a business intelligence solution seamlessly integrated into DataOS. It offers the ability to craft tailored reports and dashboards with ease. Complex data can be represented effectively by utilizing a diverse set of visualization options inherent to Superset, facilitating clear interpretation for informed decision-making processes.
-
Key Features of Superset
This section includes key features that defines Superset.
-
Filtering and Drilling
Apply filters and drill through the dashboards.
-
How to create a Dashboard?
Create the customizable dashboard using Superset.
-
Use Cases
Real life scenarios for creating the dashboard using Superset.
Features of Superset
- Users can leverage Superset's intuitive interface to create and customize dashboards efficiently, regardless of their technical expertise level.
- With Superset's SQL Lab, users can perform ad-hoc queries directly within the platform, facilitating real-time data exploration and analysis.
- Users can create interactive and dynamic dashboards with drill-down capabilities, allowing for detailed data exploration at different granularity levels.
- Extensive customization options empower users to tailor dashboards to their needs, creating a personalized and user-friendly analytical environment.
- Geospatial visualizations in Superset add a spatial dimension to data analysis, enabling users to glean insights and patterns based on location-related information.
Launching Superset
To initiate Superset within the DataOS environment, navigate to the "Apps" section and select the "Superset" option.
.png)
Upon selection, the interface of Superset will open, presenting a layout resembling the following:
.png)
We're ready to move forward now that we've covered what Superset is and its main features. We'll explore how to use Superset effectively.
The following are the two main purposes of the Superset:
- Consumption of the existing Dashboards and Charts.
- Creating and managing the Dashboards.
Let’s see one by one each.
Consume the Dashboards
Once Superset is launched, you'll be redirected to an interface where you can explore existing charts and dashboards without creating new ones. Let's see how you can effectively navigate the charts and dashboards, one step at a time.
Explore Existing Dashboards
On the landing page of the Superset, click on the Dashboards tab, here you can view any existing dashboard as per your level of permissions.
.png)
In the image above, you can observe the dashboard modified by, its publication status (published or drafted), the timestamp of the last modification, and the owner, and you can also access the dashboards by searching their name, owner, creator, status, favorite, or certificate in the search bar.
After clicking on a particular dashboard you can explore the dashboards further.
Example: From the above image as an example, on clicking the spirit_demo_dashboard you can explore the dashboard further.
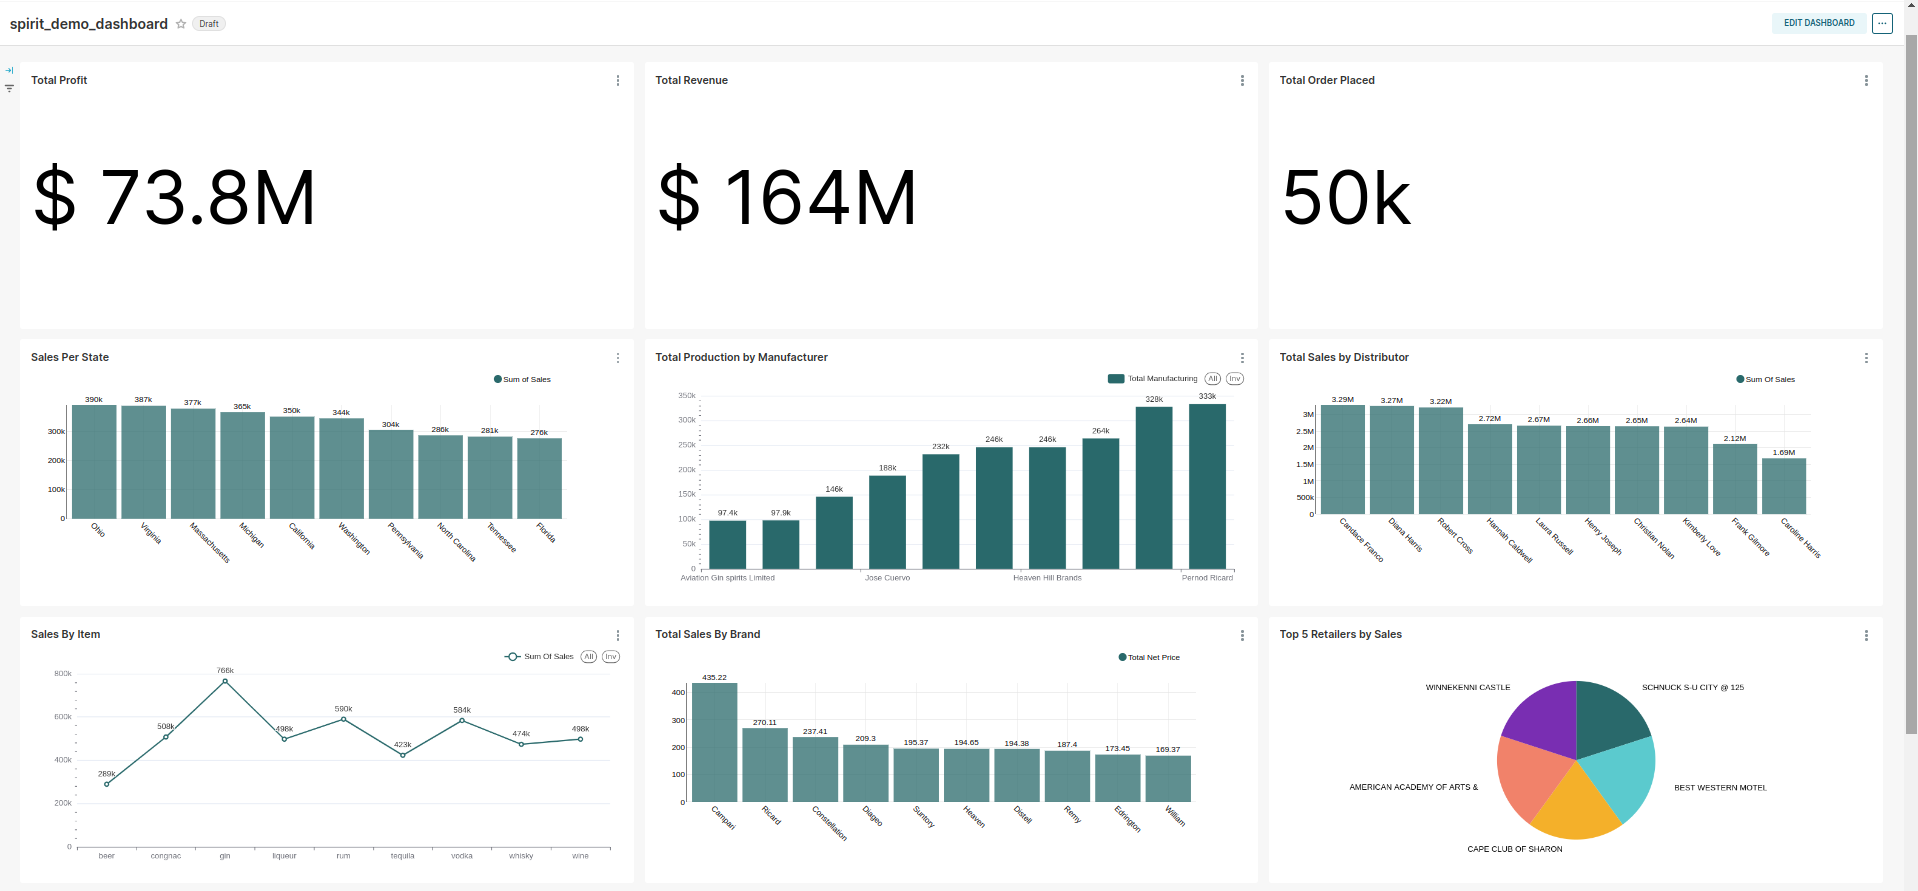
By clicking the kebab menu on the right corner of each chart, you can explore the individual chart’s options as per your level of permissions. Now you can explore the dashboard further through filtering and drilling options provided by the Superset.
Dashboard Filtering and Drilling
Superset's Dashboard Filters provide robust data filtering capabilities through an intuitive interface. Featuring Value, Numerical Range, and Time-Based filters, it enables flexible data exploration. Both basic and advanced configurations enrich filtration options and usability. Below is the comprehensive list of filters offered by Superset.
- Filter Types
- Parent-child Filter
- Pre-filter Data
- Sort Filter Values
- Single Value Range
- Filter Tooltip
- Managing Values
- Scoping a Filter
- Cross-filtering
- Managing Filters
- Drilling to Chart Details
Explore Existing Charts
Similar to exploring the dashboards, you can explore individual charts by clicking on the Charts tab on the launching page.
Steps to Create the Dashboard
Unlock the potential of your data with our step-by-step guide to building an impactful dashboard. Before we dive into the first step, envision the value your insights will bring—turning raw information into strategic clarity. Let’s embark on this journey of transforming data into informed decisions.
Adding the Database
You can add the database of your preference or utilize existing databases available for query execution to create charts and dashboards.
Let’s see how you can add a Database to Superset:-
- Go to Settings, in the top right corner.
- Click on Database Connections, an interface will open.
- Click on the +DATABASE icon.
- Now you can select the database you want to add, fill in the required credentials, and add the database.
.png)
Check out the list of Databases supported by Superset in DataOS, here.
Navigating to SQL Lab
When using the SQL Lab feature in Superset to create dashboards, it's best to start with exploring data, forming queries, and generating datasets. This systematic approach gives you a clear and structured foundation to build comprehensive dashboards.
Selecting the SQL tab at the navigation bar and choosing the SQL Lab in Superset will redirect you to the query interface. Here, you can write your queries and explore your data with efficiency. Moreover, delve into metadata by selecting the database, followed by the schema, and then the specific table on the left panel. This step allows for a comprehensive examination of the columns present in the table, along with their respective data types.
.png)
Writing a query
Now, on SQL Lab you can write a query to create charts by selecting the database, schema, and table on the left panel. For example:
SELECT `Store` AS `Store`,
       `Date` AS `Date`,
       `Weekly_Sales` AS `Weekly_Sales`,
       `Holiday_Flag` AS `Holiday_Flag`,
       `Temperature` AS `Temperature`,
       `Fuel_Price` AS `Fuel_Price`,
       `CPI` AS `CPI`,
       `Unemployment` AS `Unemployment`
FROM `bigquery`.`dbt_asolanki`.`new_table`
LIMIT 100
Saving query results as a dataset
Following successful query execution, you have the option to create a dataset by saving the query as a dataset under the "SAVE" option. This dataset can subsequently be utilized to generate visuals.
.png)
After saving the dataset you will be redirected to an interface where you can create charts. By default, it will automatically create the table chart but you can always change it to the chart of your choice.
Creating a dataset from the interface
As you have already seen how you can create the dataset from the query, you can also create the dataset without writing the query let’s see how.
In the Datasets tab, select "+ DATASET". Choose the database, schema, and table, then click "CREATE DATASET AND CREATE CHARTS". You'll be redirected to an interface where you can create charts by selecting the dataset and the chart type.
.png)
Creating charts
Upon creating the dataset through query or interface, you will be redirected to the interface where chart creation occurs. Additionally, another method to create charts is by navigating to the Charts tab, selecting "+ CHART", choosing the dataset and chart type, and finally clicking "CREATE CHART", you can always change the chart type later.
After creating the chart via query you will be redirected to the following interface:
.png)
Now, you can choose the desired chart type and efficiently drag and drop columns into the required fields. Subsequently, update the chart to reflect your desired configuration. Ensure to give your chart a meaningful name and save it.
To enhance your proficiency in creating impactful visualizations in Superset, we've curated resources on fundamental chart components and customization options. These guides aim to simplify the process of navigating through Superset's features:
Chart Components
Explore the basic elements that makeup Superset charts, helping you grasp the essentials for constructing meaningful visual representations:
Charts Customization
Delve into the process of chart customization to tailor visualizations according to your analytical goals. This resource provides insights into adjusting appearances and behaviors for a personalized touch.
Create the Dashboard
After creating your preferred number of charts, you can then assemble them into a dashboard.
Navigate to the dashboard tab and select "+ DASHBOARD". An interface for creating dashboards will open, allowing you to add charts to your dashboard. While you have the option to create charts within the dashboard interface, it is advisable to create your charts beforehand for best practice. Now you can drag and drop your charts into the dashboard with ease.R
Craft a dashboard that aligns perfectly with your needs using these customization resources:
Dashboard Customization
Discover ways to enhance the look and feel of your dashboard with built-in customization features.
Dashboard Customization with CSS
Explore advanced customization using CSS, providing you with finer control over the aesthetics of your dashboard.
Use cases
- Our Superstore Sales Dashboard, crafted with Superset, offers a streamlined view of sales data. Tailored for decision-makers, this interactive tool simplifies analysis across categories, cities, regions, and customer segments. Dive into insights effortlessly, empowering strategic decision-making. Explore the Superstore Sales Dashboard.