Bar chart legacy
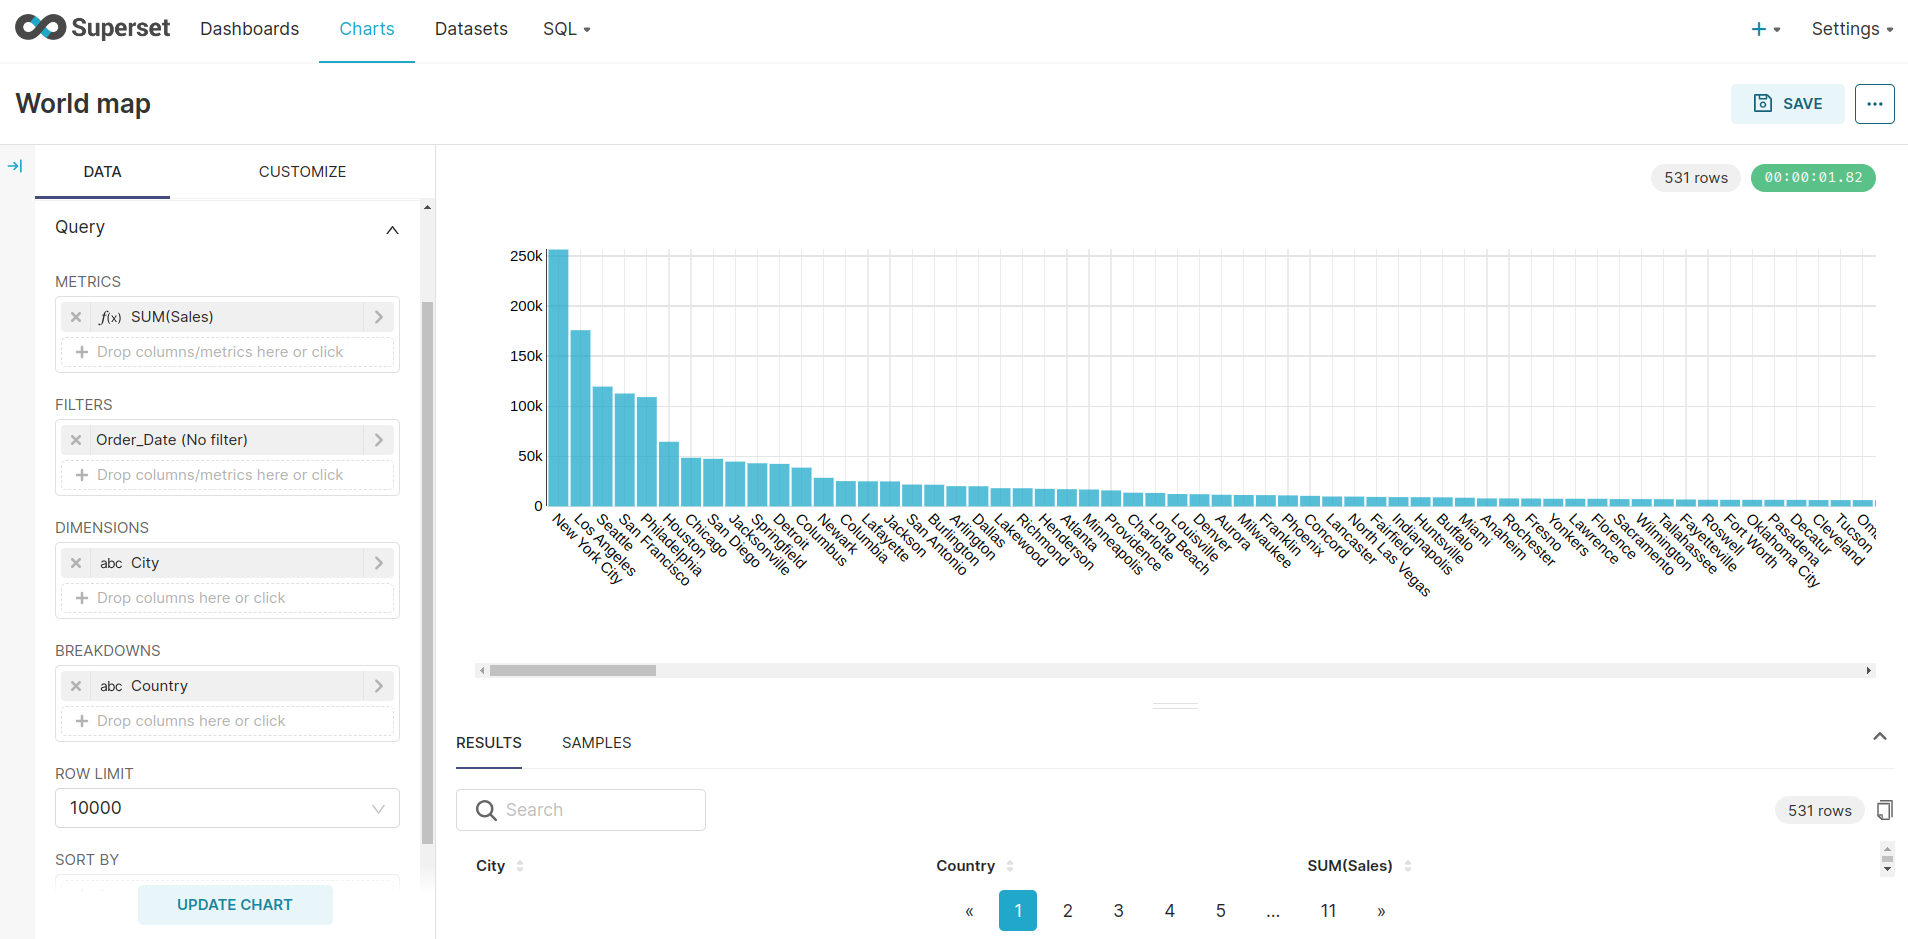
The Bar Chart in Superset is a visualization that presents data using rectangular bars. Each bar's length corresponds to the value of a metric, and bars are typically grouped by categories (dimensions) on the horizontal axis. It's effective for comparing values across different categories or displaying trends over time.

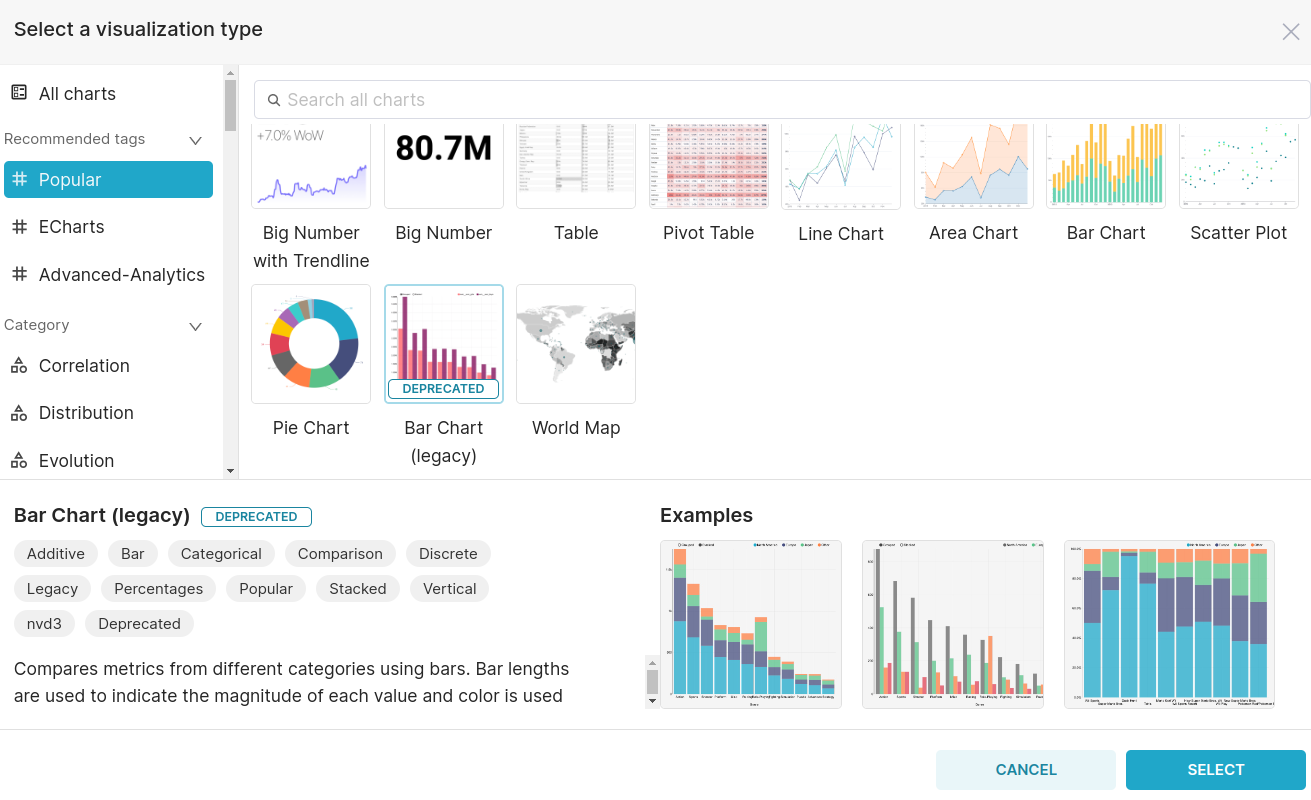
On selecting the Bar chart (legacy), you can then proceed with its components.

Common components such as METRIC, FILTERS, ROW LIMIT, SORT BY, and DIMENSIONS are already covered in the 'Common Charts Components' section for reference.
- BREAKDOWNS (Optional):
- Further break down the data by dropping columns here, offering a more detailed analysis.
- CONTRIBUTION (Optional):
- Determine the contribution mode to visualize the contribution of each metric to the total.
These components collectively contribute to configuring and customizing the appearance and behavior of the chart in Superset.