Types of Filters
To create and manage the filters, on the left corner of the dashboard click on the blue arrow →|, and you will be redirected to the Add and edit filters interface.
.png)
Filter Types
In the window labeled Add and edit filters below, you'll see two tabs: Settings and Scoping. Our immediate attention will be on the Settings tab, which is the default selection.
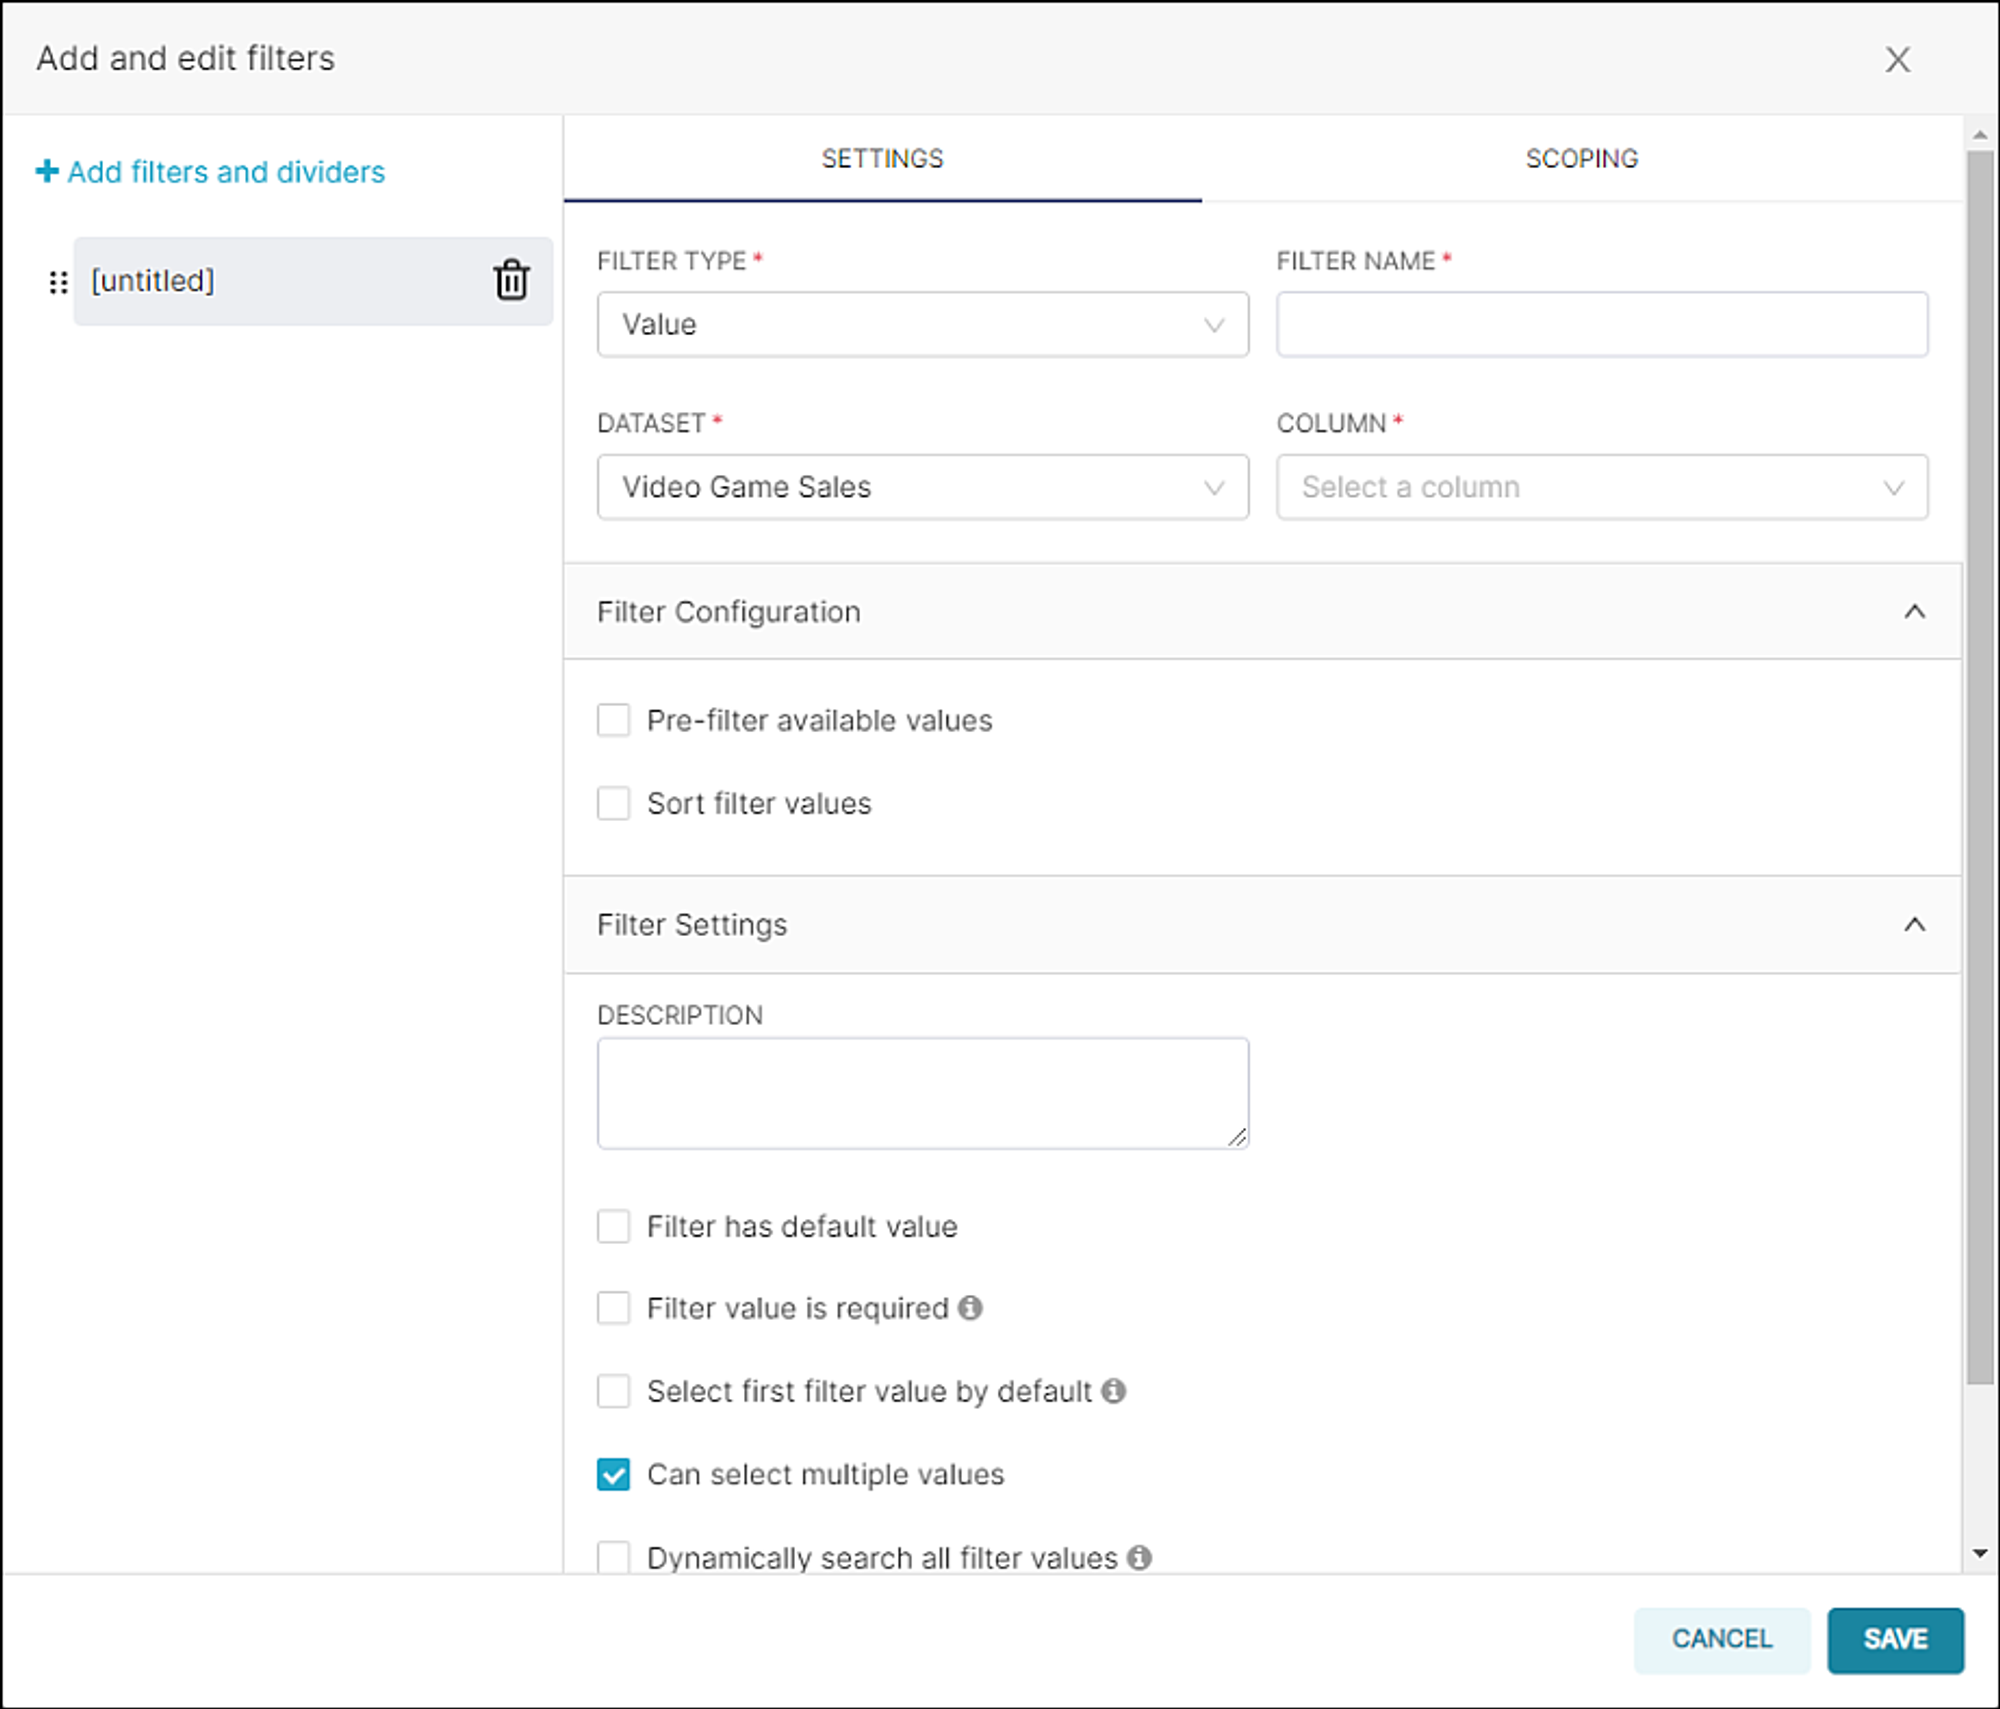
- Type of Filter: Choose from various filter types, such as Value, Numerical Range, Time Range, Time Column, and Time Grain (see individual descriptions below).
- Dataset: Select the dataset to be used for the dashboard's charts. By default, all datasets linked to the dashboard's charts will be accessible for selection. This option is visible when either the Value, Numerical Range, Time Column, or Time Grain filter types are chosen.
- Filter Name: Provide a brief descriptive title for the new filter. Usually, this corresponds to the selection in the subsequent Column field.
- Column: Pick a column to which the filter should be applied. This field is displayed when either the Value or Numerical Range filter types are chosen.
Value Filter Type
This filter type generates a dropdown menu filled with all the available values linked to the chosen column (Column field).
For instance: If you opt for a Value filter type and then, in the Column field, you select year, a dropdown filter menu emerges on the dashboard, allowing you to filter by year. Once applied, all charts within the dashboard will solely exhibit data from the selected "year" filter.
Here's what the configuration might look like:
.png)
and the drop-down filter, titled "Select the year" from the Filter Name field, looks as follows:
.png)
In the above example, we opted to filter by the year 2022.
To apply the filter, choose a value and then select Apply Filters. The charts within the dashboard will refresh and display the filtered data.
Numerical Range Filter Type
This filter type generates a range slider allowing you to define a starting and ending point based on numerical values extracted from the chosen column.
For instance: If you choose a Numerical Range filter type and then, in the Column field, you select order_quantity, a range slider filter emerges enabling you to designate a starting and ending range. Once applied, all charts within the dashboard will exclusively showcase data corresponding to the selected sales range filter.
Here's what the configuration might look like:
.png)
and the range slider filter, titled "Select a Range" from the Filter Name field, appears as follows:
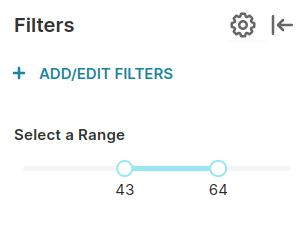
In the above example, we choose to specify a range from 43 to 64.
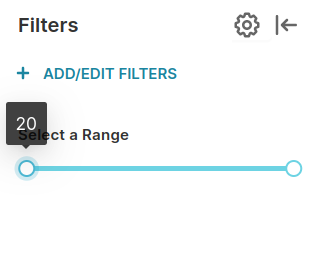
Note that you can inspect the minimum slider setting by hovering your cursor over the leftmost anchor point.
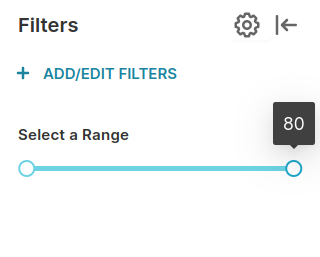
Note that you can inspect the maximum slider setting by hovering your cursor over the rightmost anchor point.
To implement the filter, specify a numerical range and then click on Apply Filters. Subsequently, the charts within the dashboard will refresh, exhibiting the filtered data.
Time Range Filter Type
This filter type implements a button filter that, when chosen, activates the Superset's Edit Time Range functionality. This corresponds to the Time Range field utilized during the creation of a new chart.
Here's what the configuration will look like:
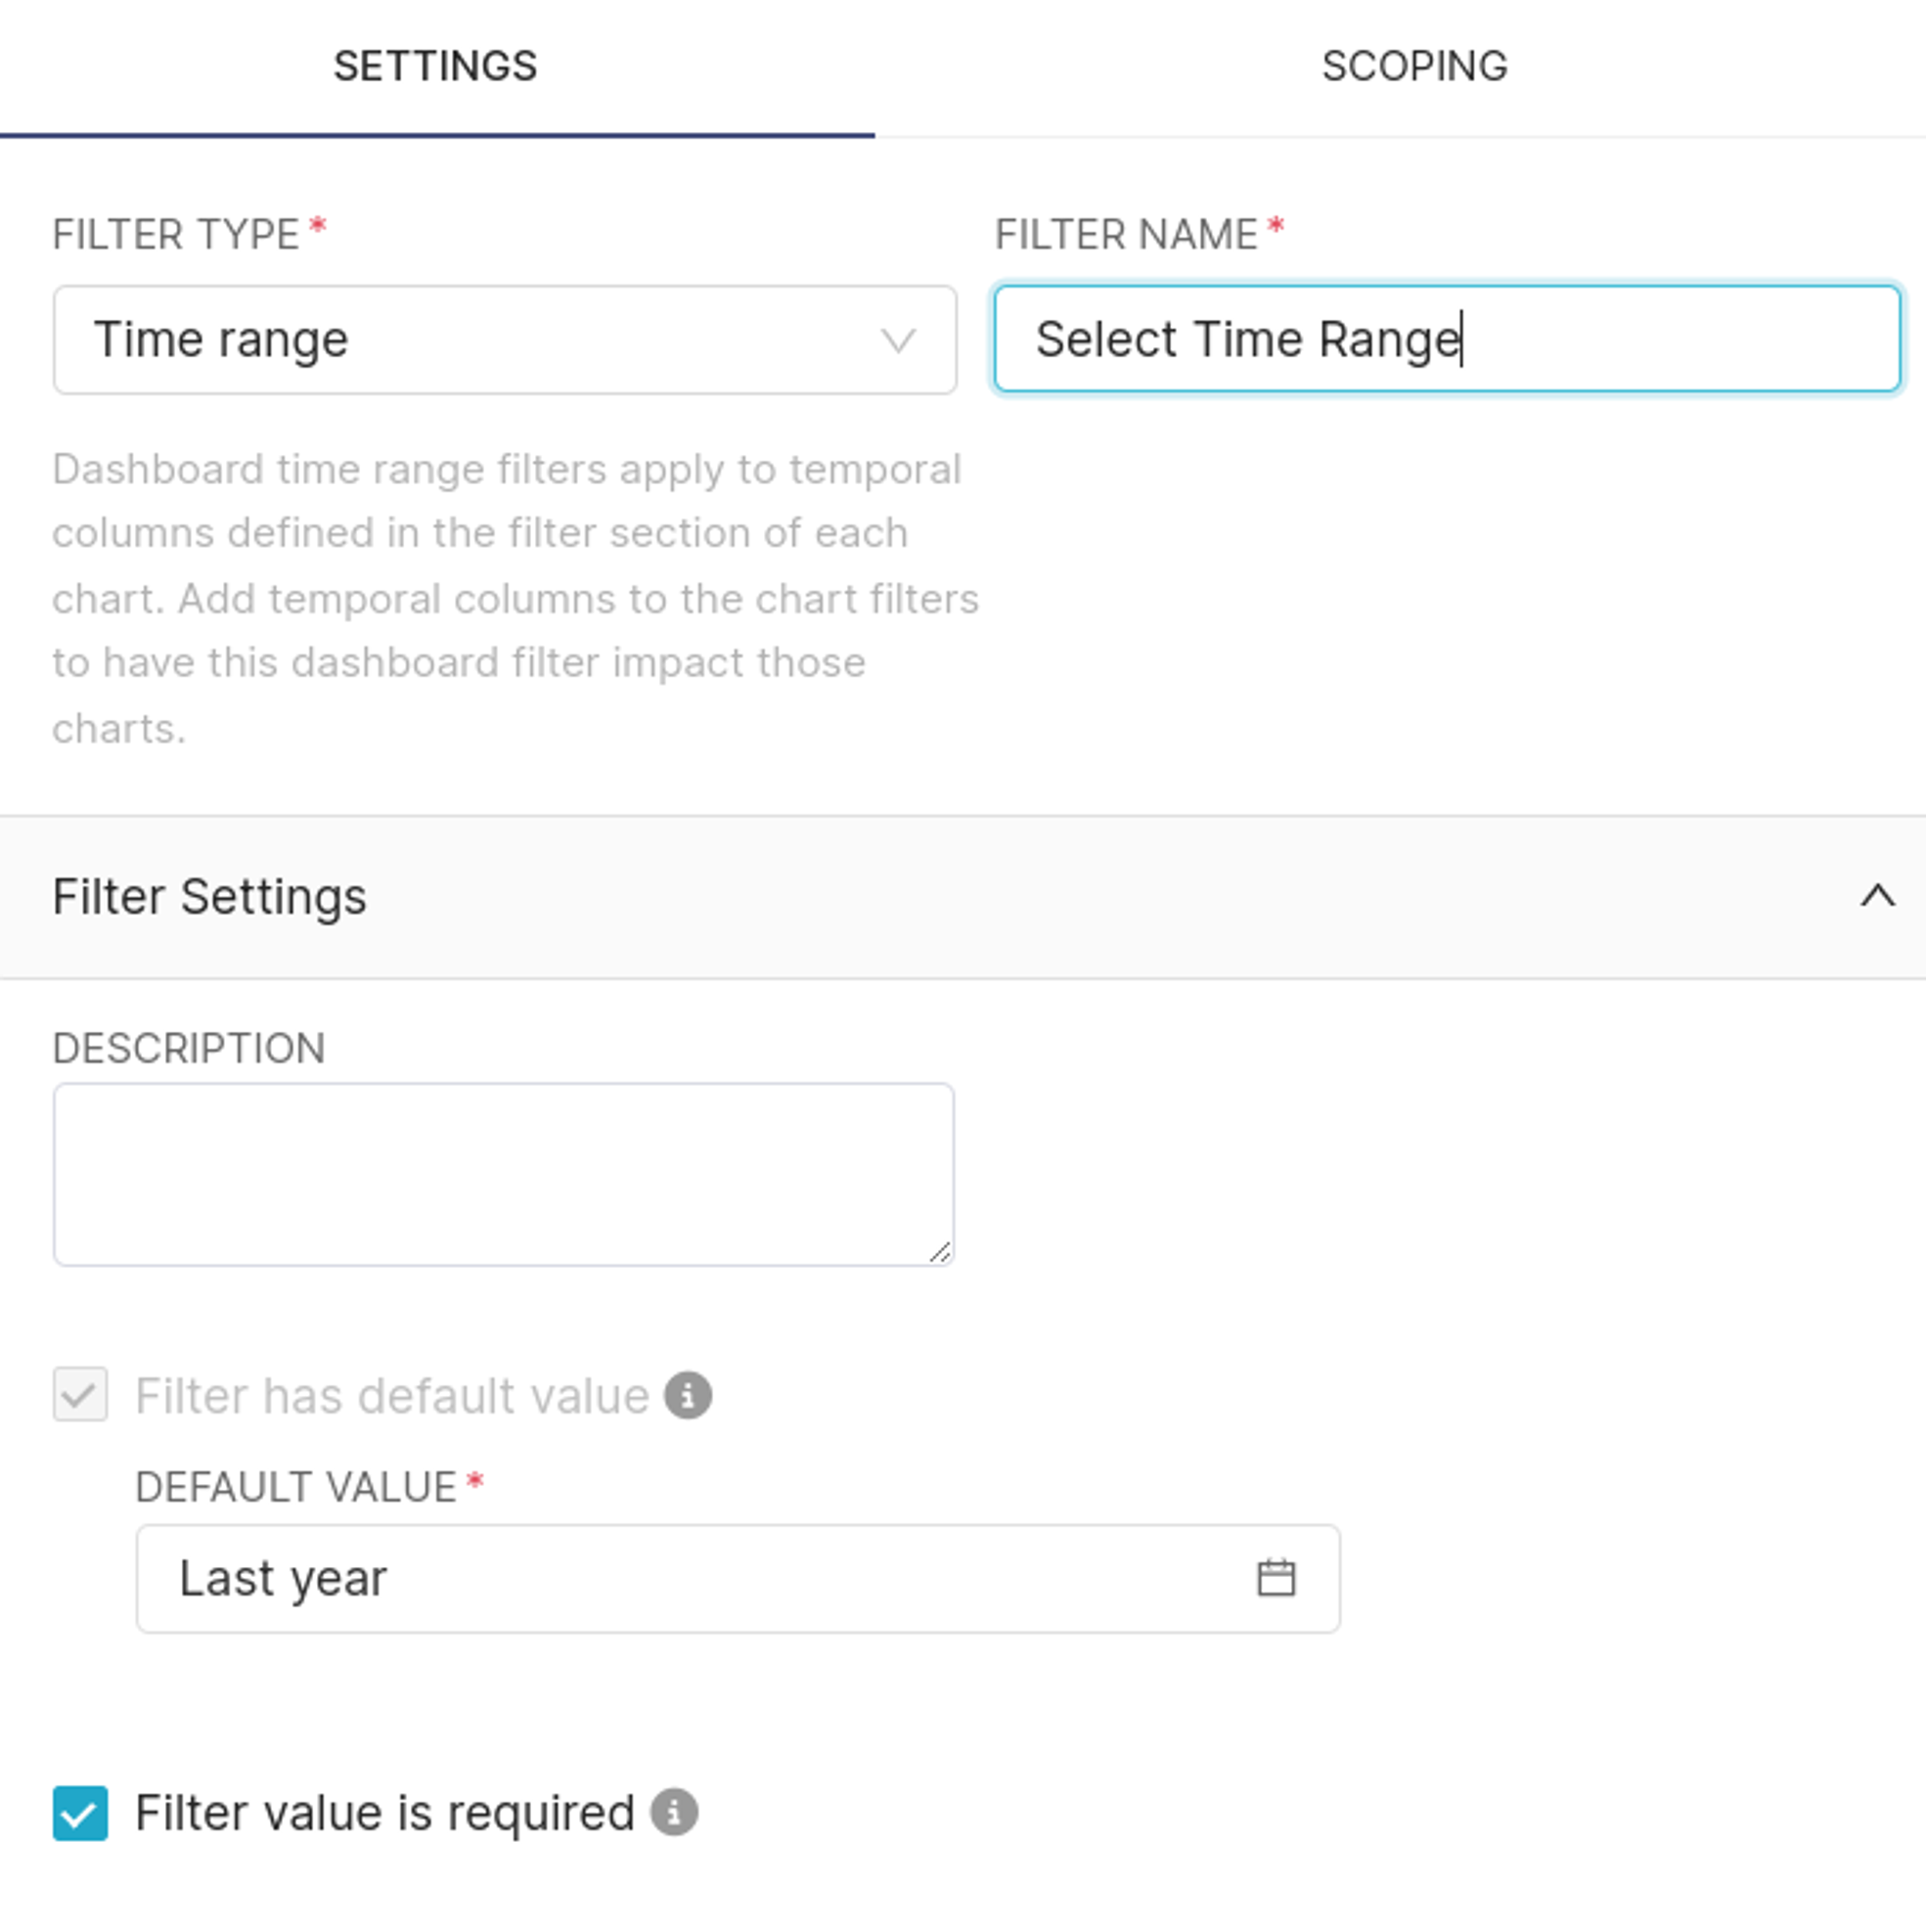
In this example, we specified a default value of "Last Year" and defined a filter name of "Select Time Range".
This configuration will look like:
.png)
To apply the filter, select and configure a time range, then select Apply Filters. The charts within the dashboard will refresh and display the filtered data.
Time Column Filter Type
This filter type generates a dropdown menu, allowing you to choose a new dashboard-level time column, which will supersede any existing time columns defined at the chart level.
When to utilize this filter type?
The Time Column filter type is most suitable when there are several time columns within the chosen dataset. In numerous instances, a dataset may contain only one time-column (selected by default), making this filter type unnecessary.
Here's what the configuration might look like:
.png)
and the drop-down filter, titled "Select Time Column" from the Filter Name field, appears as follows:
.png)
To apply the dashboard-level time column, select a time column option and then select Apply Filters. The charts within the dashboard will refresh and display the filtered data.
Time Grain Filter Type
This filter type generates a drop-down menu that allows you to select a time granularity. Upon application, all timestamps are categorized according to the chosen time grain.
Here's what the configuration might look like:
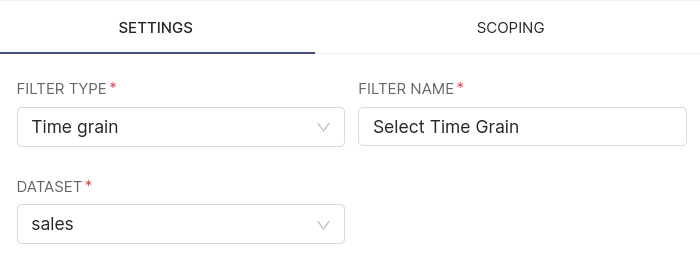
and the drop-down filter, titled "Select Time Grain" from the Filter Name field, appears as follows:
.png)
In the above example, we choose to specify a time grain of Minute.
To apply the dashboard-level time grain grouping, choose a time grain and then select Apply Filters. The charts within the dashboard will refresh and display the grouped data.