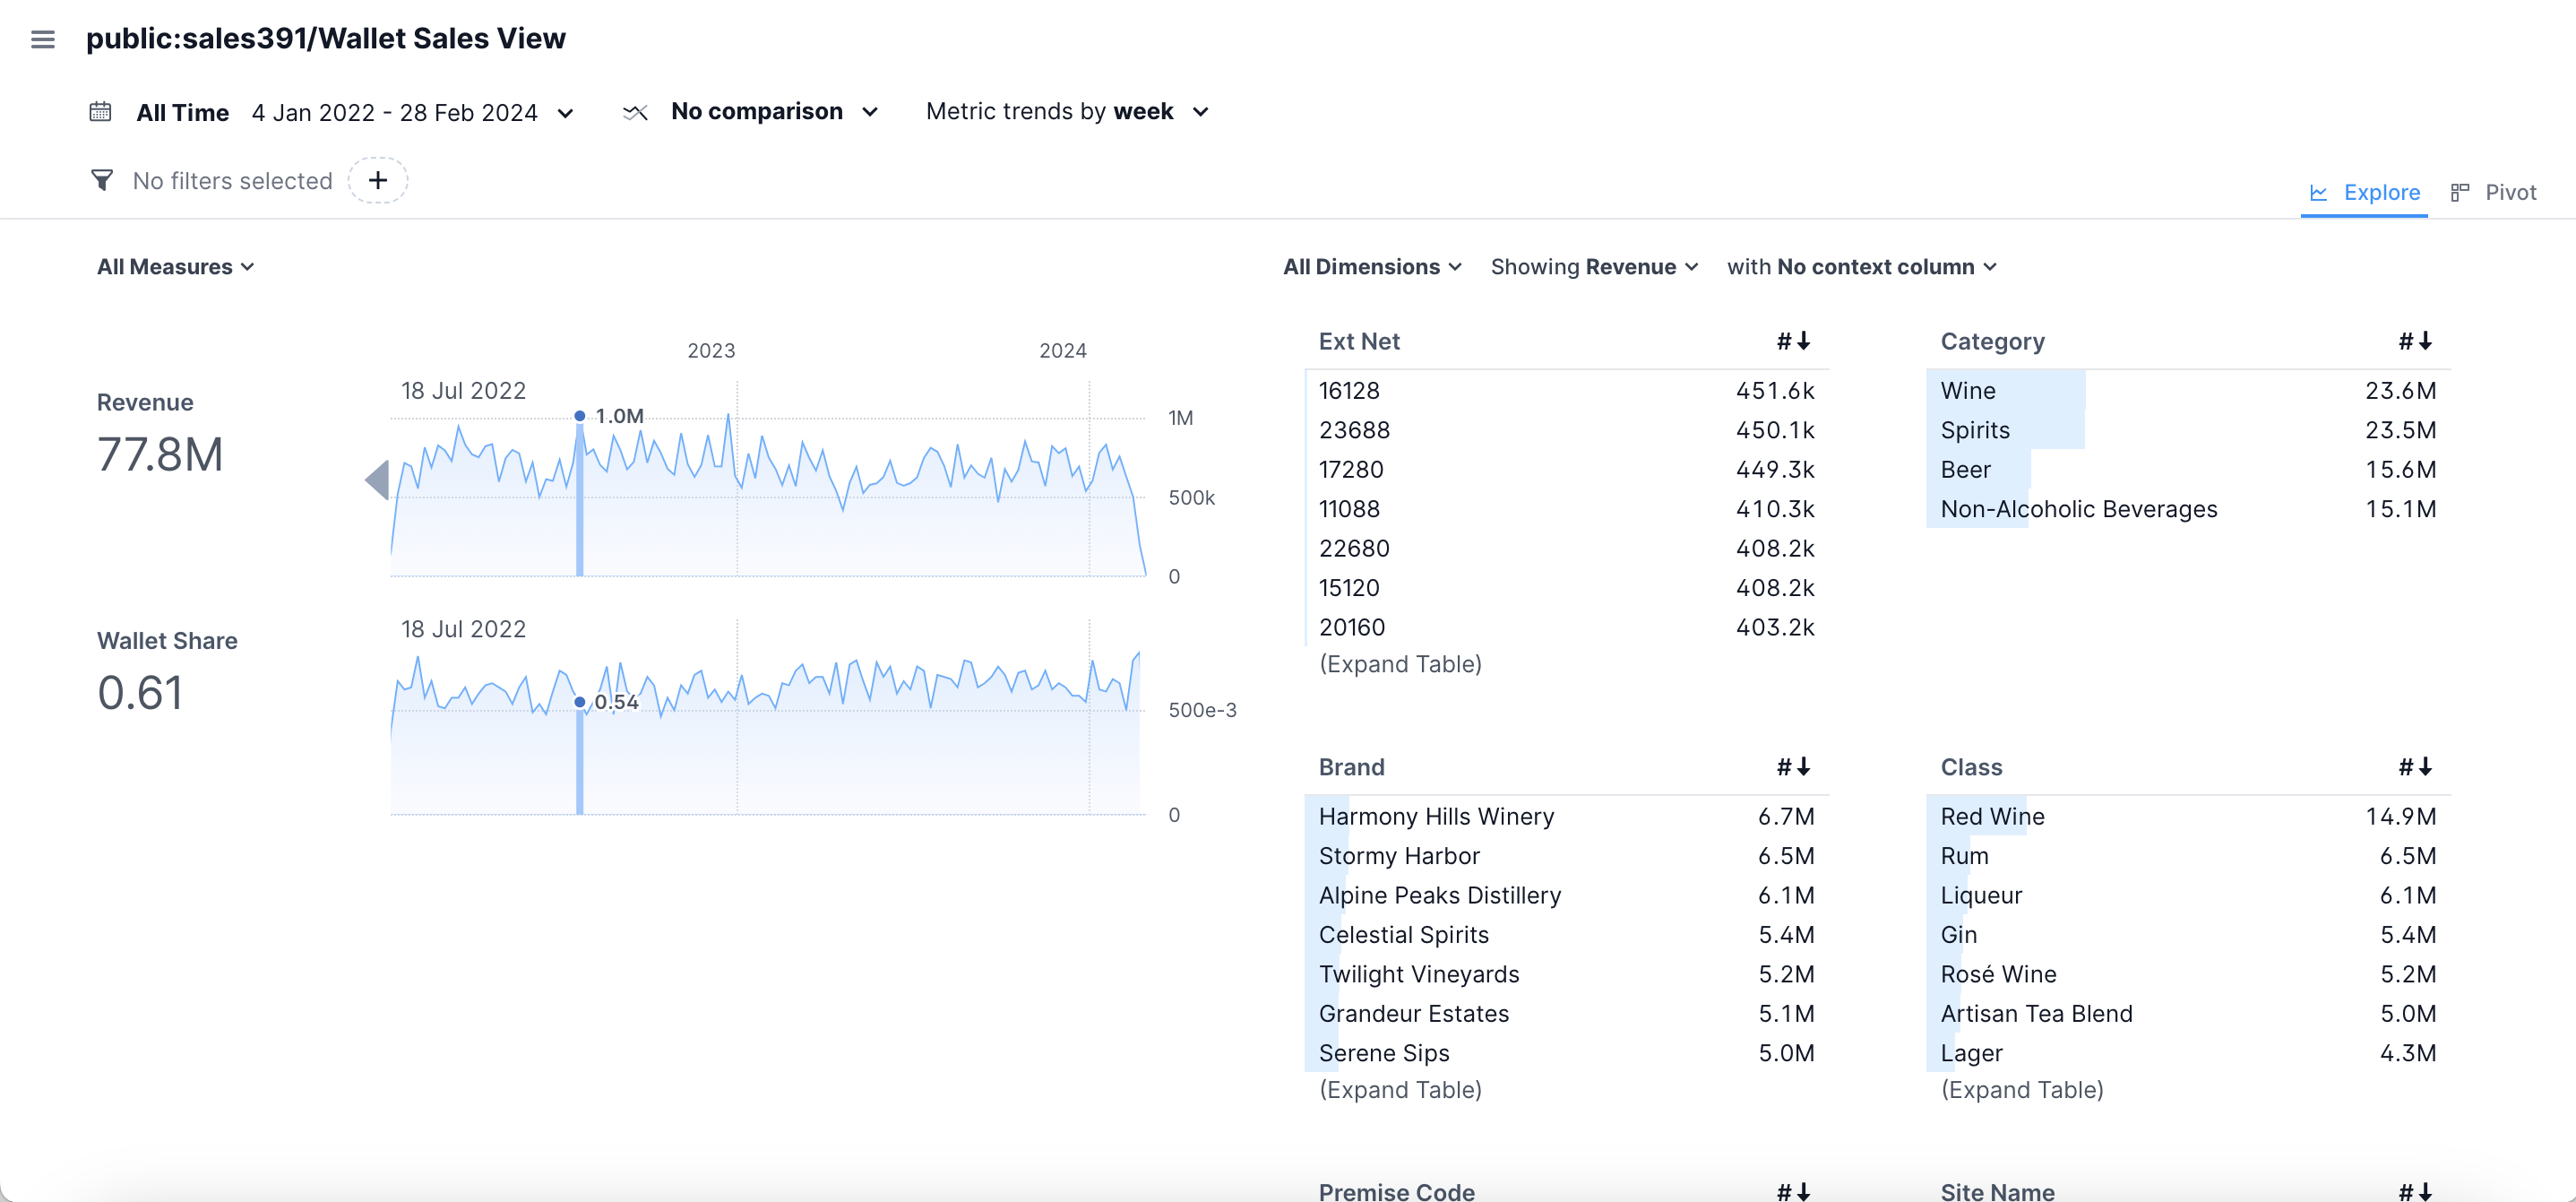
Exploration of Lens using Iris Board
Iris serves as an operational dashboard, providing a swift overview of your key performance metrics (measures) over time. It enables you to delve deeper into these metric (measures) across various dimensions, aiding in the understanding of anomalies or observed differences. You can expose your Lens View to Iris boards, allowing you to observe measures across various dimensions defined within it.
For instance, the following ‘wallet_sales_view’ Iris board shows weekly performance of revenue and wallet share

Working with Iris board?
You can create operational boards powered by Lens Views for streamlined operations.
Step 1: Add the following detail in View’s YAML within the meta section
views:
  - name: #name of the view
    description: #description of the view
    public: #ensure this property is set as 'true' so that it is accessible for the consumer
    #Here you can define whether you want this view to be exported to the Iris board
    meta:
      export_to_iris: true
      timezones: # come from lens meta
      iris:
        timeseries: [table_name].[timeseries_column_name]
Step 2: Deploy Lens
Learn more about deploying Lens here
Step 3: Access the Iris board for your Lens via Data Product Hub
- Navigate to the DataOS Home Page.
- Select Data Product Hub from the menu.
- In the Data Product Hub dialog box, choose the relevant Data Product associated with the semantic model to explore.
- Open the 'Metrics' tab.
- Locate the Quick Insights button in the top-right corner of the Metrics tab and click it to access the Iris Board.
Once accessed, the created metric-type Views can now be explored and analyzed within the Iris Board.