Steps to create a streaming Monitor
Follow the below steps to create a streaming Monitor:
Pre-requisites
Before creating a streaming Monitor, the following prerequisites must be met for creating a Monitor in DataOS.
Logged into DataOS CLI:
Ensure that the DataOS Command Line Interface is set up on the local system and that the user is logged in before proceeding. See Setting up CLI.
Permissions:
Verify that the appropriate permissions are available to create and manage a Monitor.
Once the prerequisites are satisfied, Monitor Resources in DataOS can be created.
Step 1: Create a manifest file of a Monitor
Copy and edit the manifest file below to create a streaming Monitor for Workflow runtime failure. Replace the provided Workflow name with the actual Workflow name. To observe the status instead of runtime, replace runtime with status in dataOsInatnace.path.
name: ${{monitor-name}}
version: v1beta
type: worker
tags:
  - pod
  - stream
  - monitor
description: ${{Add a short description}}
worker:
  stack: stream-monitor
  compute: ${{compute-name}}
  replicas: 1
  resources:
    requests:
      cpu: 100m
      memory: 100Mi
    limits:
      cpu: 200m
      memory: 200Mi
  stackSpec:
    type: stream_monitor
    incident:
      type: ${{incident-type}}
      name: ${{incident-name}}
      summary: ${{incident-summary}}
      category: stream
      severity: ${{severity, e.g., warning}}
    stream:
      source:
        fastbase:
          topic: ${{fastbase_topic, e.g., persistent://system/poros/pods}}
          maxWorkers: 100
          subscriptionName: ${{pods-stream-monitor-125-001}}
          subscriptionPosition: ${{latest}}
      conditions:
        - valueJqFilter: ${{condition-1-filter}}       # e.g., '.producer_name'
          operator: ${{condition-1-operator}}          # e.g., equals
          value: ${{condition-1-value}}                # e.g., 'poros-recorder-1-hub'
        - valueJqFilter: ${{condition-2-filter}}       # e.g., '.properties.dataplane'
          operator: ${{condition-2-operator}}          # e.g., equals
          value: ${{condition-2-value}}                # e.g., 'hub'
        - valueJqFilter: ${{condition-3-filter}}       # e.g., '.key'
          operator: ${{condition-3-operator}}          # e.g., contains
          value: ${{condition-3-value}}                # e.g., 'delete:pods:juicefs'
name: pods-stream-monitor
version: v1beta
type: worker
tags:
  - pod
  - stream
  - monitor
description: testing the pods stream monitors
worker:
  stack: stream-monitor
  compute: azure-s-runnable
  replicas: 1
  resources:
    requests:
      cpu: 100m
      memory: 100Mi
    limits:
      cpu: 200m
      memory: 200Mi
  stackSpec:
    type: stream_monitor
    incident:
      type: pulsar
      name: stream-monitor-incident
      summary: 'stream monitor incident, found a specific pod'
      category: stream
      severity: warning
    stream:
      source:
        fastbase:
          topic: persistent://system/poros/pods
          maxWorkers: 100
          subscriptionName: pods-stream-monitor-125-001
          subscriptionPosition: latest
      conditions:
        - valueJqFilter: '.producer_name'
          operator: equals
          value: 'poros-recorder-1-hub'
        - valueJqFilter: '.properties.dataplane'
          operator: equals
          value: 'hub'
        - valueJqFilter: '.key'
          operator: contains
          value: 'delete:pods:juicefs'
Possible values for runtime and status
| Attribute | Description | Common Values |
|---|---|---|
runtime |
Indicates the execution state or duration of a Resource. | running, succeeded, failed, (or a specific time duration, e.g., 5m, 1h) |
status |
Represents the operational status of a Resource. | active, error, deleted |
Attributes description:
| Attribute | Description |
|---|---|
| monitor.report.source.dataOsInstance.path | API path to the report data source to be monitored. |
| monitor.report.conditions | List of conditions to evaluate against the report data. |
| monitor.report.conditions[].valueComparison.observationType | The type of observation to check (e.g., runtime, status). |
| monitor.report.conditions[].valueComparison.valueJqFilter | JQ filter to extract the value from the report data (e.g., '.value'). |
| monitor.report.conditions[].valueComparison.operator | Operator used for comparison (e.g., equals, less_than, greater_than). |
| monitor.report.conditions[].valueComparison.value | The value to compare against (e.g., failed). |
To know more about each attributes, please refer to the configuration section.
Step 2: Apply the Monitor manifest through CLI
Once the Monitor manifest file is created, it must be applied within the DataOS environment to create the Monitor Resource. This can be accomplished using the Command Line Interface (CLI) with the following commands:
Alternatively, this task can also be accomplished using a simpler command. Both commands are equivalent, and either one can be used depending on preference:
Example:
Below is an example of how to apply a Monitor manifest file located at /home/monitor/incident-monitor.yml to the curriculum workspace:
Expected output:
After running the command, an output similar to the following should be displayed, indicating that the Monitor Resource instance has been applied.
# Expected Output
INFO[0000] 🔍 apply...
INFO[0001] 🔍 applying(curriculum) cpu-usage-spike:v1alpha:monitor...
INFO[0002] 🔍 applying(curriculum) cpu-usage-spike:v1alpha:monitor...created
INFO[0003] 🔍 apply...complete
Step 3: Verify Monitor status
The following command is used to check the current states of the Monitor Resource to verify that Monitor is configured properly.
dataos-ctl resource get -t Monitor -w curriculum -n runtime-monitor1 -r

# Expected output
INFO[0000] 🔍 get...
INFO[0001] 🔍 get...complete

        NAME       | VERSION |  TYPE   | WORKSPACE | STATUS |            RUNTIME             |    OWNER
-------------------|---------|---------|-----------|--------|--------------------------------|--------------
  runtime-monitor1 | v1alpha | Monitor | curriculum    | active | next:2025-07-28T13:40:00+05:30 | iamgroot
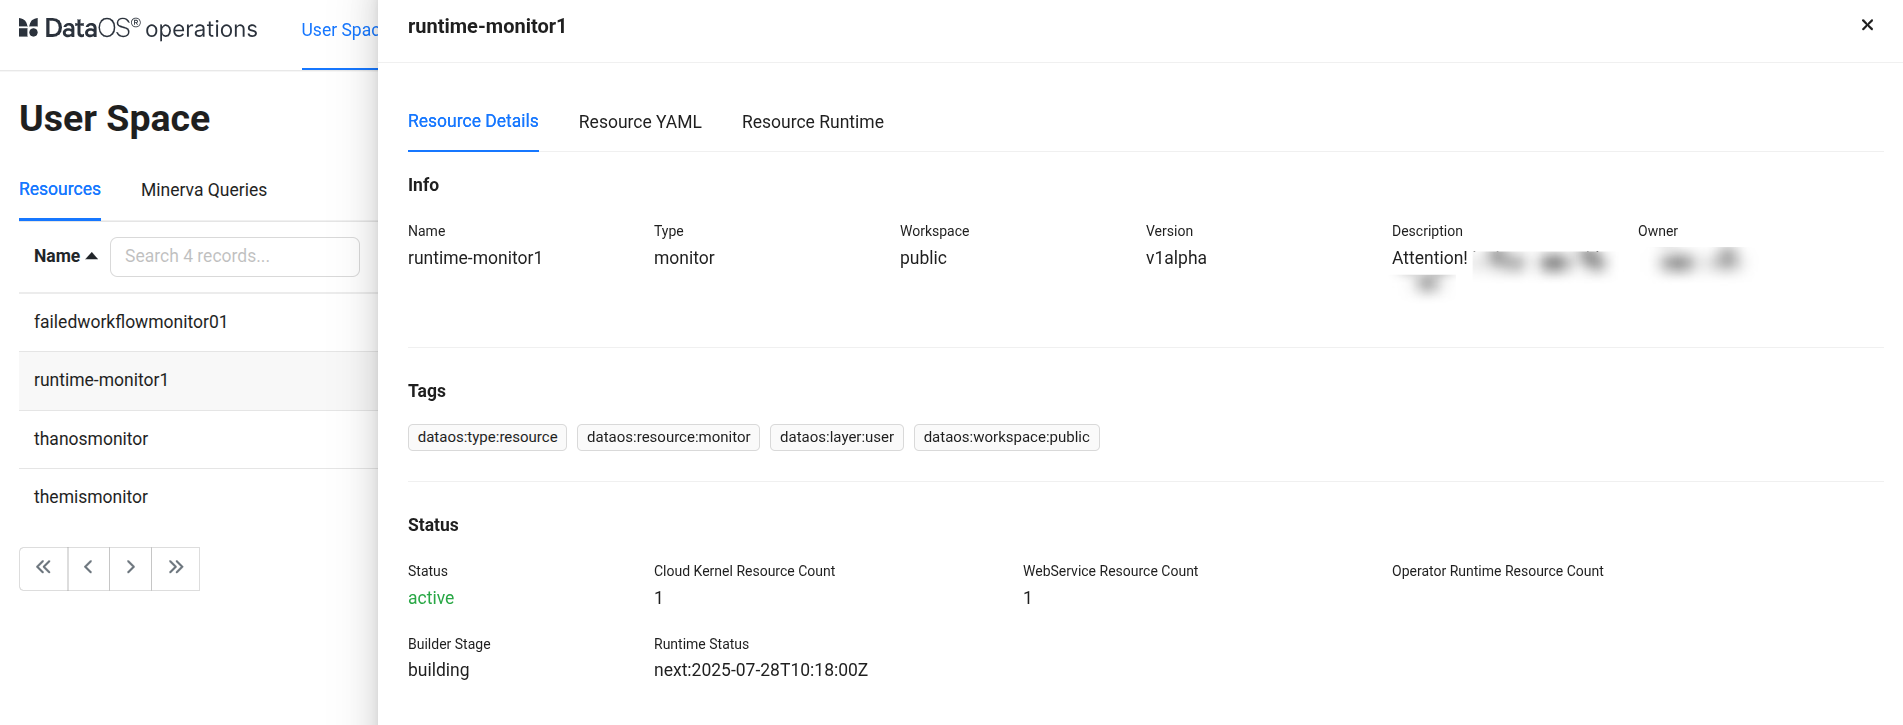
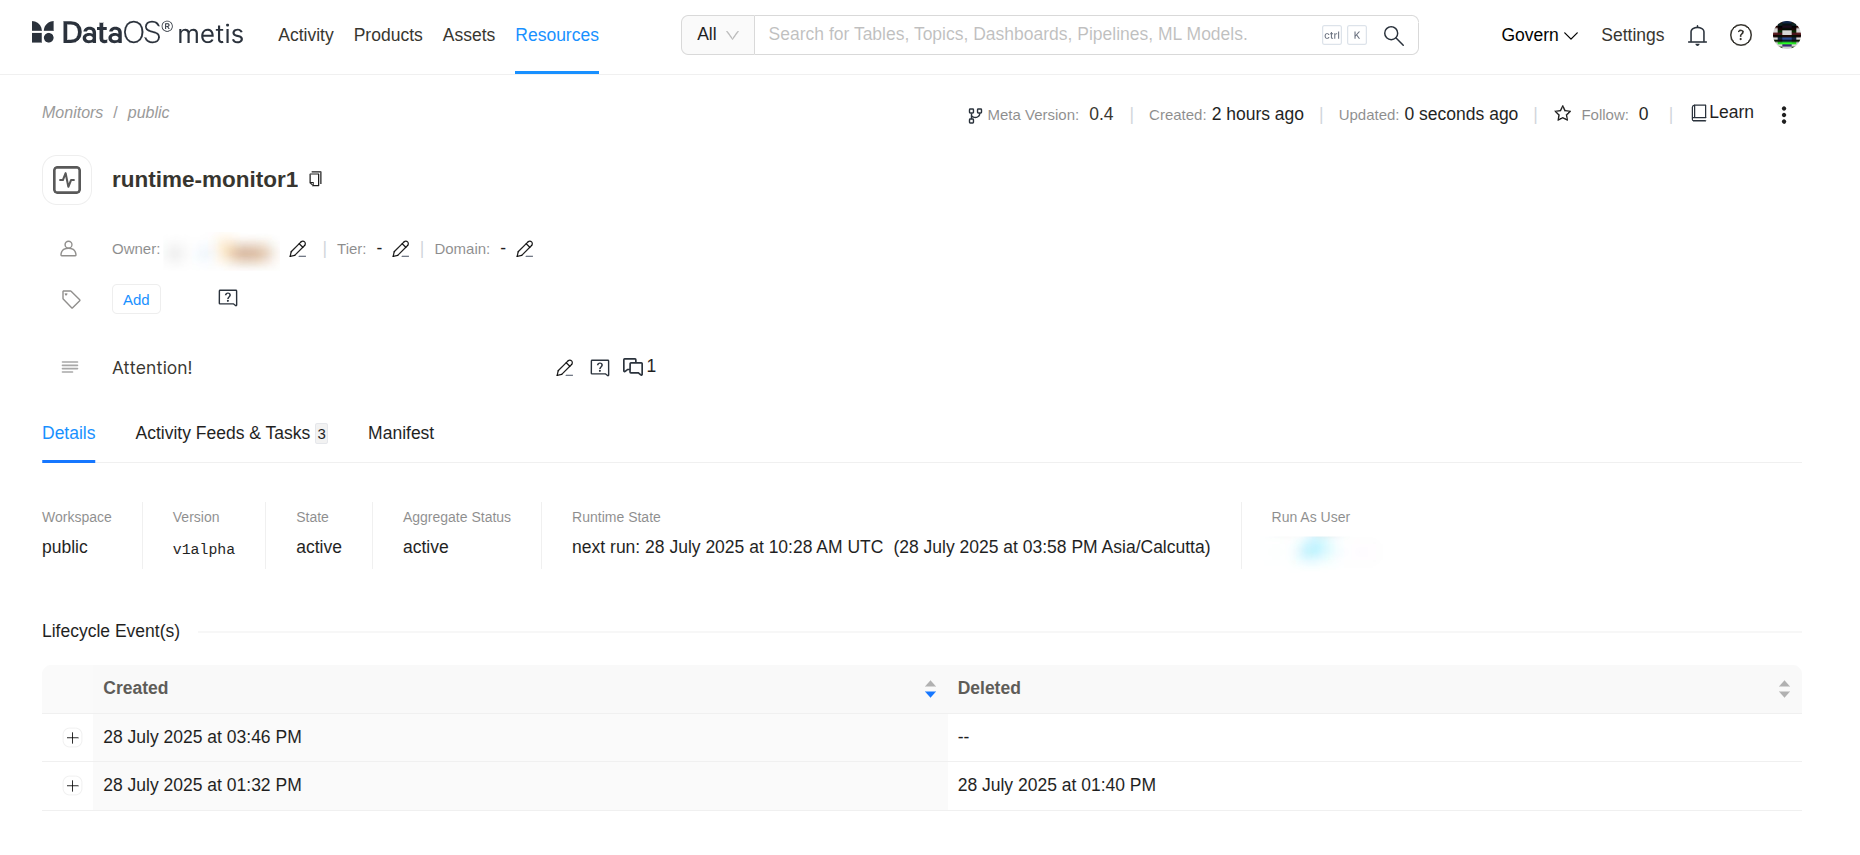
Details of any created Monitor can also be accessed through the DataOS GUI in the Metis catalog and Operations App.
Next steps
After successfully creating the Report Monitor for Workflow runtime failure, the next step is to configure a Pager Resource. The Pager Resource is responsible for sending alerts to configured Teams channels or email addresses whenever the incident condition is met.