Steps to create a Report Monitor
Follow the below steps to create a Report Monitor:
Pre-requisites
Before creating a Report Monitor, the following prerequisites must be met for creating a Monitor in DataOS.
Logged into DataOS CLI:
Ensure that the DataOS Command Line Interface is set up on the local system and that the user is logged in before proceeding. See Setting up CLI.
Permissions:
Verify that the appropriate permissions are available to create and manage a Monitor.
Once the prerequisites are satisfied, Monitor Resources in DataOS can be created.
Step 1: Create a manifest file of a Monitor
Copy and edit the manifest file below to create a Report Monitor for Workflow runtime failure. Replace the provided Workflow name with the actual Workflow name. To observe the status instead of runtime, replace runtime with status in dataOsInstance.path.
# Resource meta section
name: runtime-monitor
version: v1alpha
type: monitor
tags:
  - dataos:type:resource
  - dataos:layer:user
description: Attention! workflow run is failed.
layer: user
monitor:

# Monitor-specific section
  schedule: '*/3 * * * *'
  incident:
    name: workflowrunning
    severity: high
    incidentType: workflowruntime

  type: report_monitor
# Report Monitor specification
  report:
    source:
      dataOsInstance:
        path: /collated/api/v1/reports/resources/runtime?id=workflow:v1:${{workflow-name}}:public
    conditions:
      - valueComparison:
          observationType: runtime
          valueJqFilter: '.value'
          operator: equals
          value: failed
Possible values for runtime and status
| Attribute | Description | Common Values |
|---|---|---|
runtime |
Indicates the execution state or duration of a Resource. | running, succeeded, failed, (or a specific time duration, e.g., 5m, 1h) |
status |
Represents the operational status of a Resource. | active, error, deleted |
Attributes description:
| Attribute | Description |
|---|---|
| monitor.report.source.dataOsInstance.path | API path to the report data source to be monitored. |
| monitor.report.conditions | List of conditions to evaluate against the report data. |
| monitor.report.conditions[].valueComparison.observationType | The type of observation to check (e.g., runtime, status). |
| monitor.report.conditions[].valueComparison.valueJqFilter | JQ filter to extract the value from the report data (e.g., '.value'). |
| monitor.report.conditions[].valueComparison.operator | Operator used for comparison (e.g., equals, less_than, greater_than). |
| monitor.report.conditions[].valueComparison.value | The value to compare against (e.g., failed). |
To know more about each attributes, please refer to the configuration section.
Step 2: Validate the API endpoint
Before applying the Monitor manifest, validate that the API endpoint specified in source.dataOsInstance.path returns the expected data. You can use Postman or any other preferred API testing tool for this purpose.
Steps to validate API endpoint using Postman application:
-
Copy the below API path and replace the placeholders with actual values.
https://${{dataos-fqdn}}//collated/api/v1/reports/resources/${{metrics-to-monitor}}?id=${{resource-type}}:${{resource-version}}:${{resource-name}}:${{workspace-name}}Placeholder Description Possible Values dataos-fqdnFully Qualified Domain Name of your DataOS environment Any valid DataOS FQDN resource-typeType of Resource to monitor workflow,service,worker,depot,lens,cluster, etc.resource-versionVersion of the Resource v1,v2alpha,v1beta, etc.resource-nameName of the Resource instance Any valid resource name in your DataOS environment workspace-nameWorkspace where the Resource resides Any valid workspace name in your DataOS environment (Not required for instance-level Resources) -
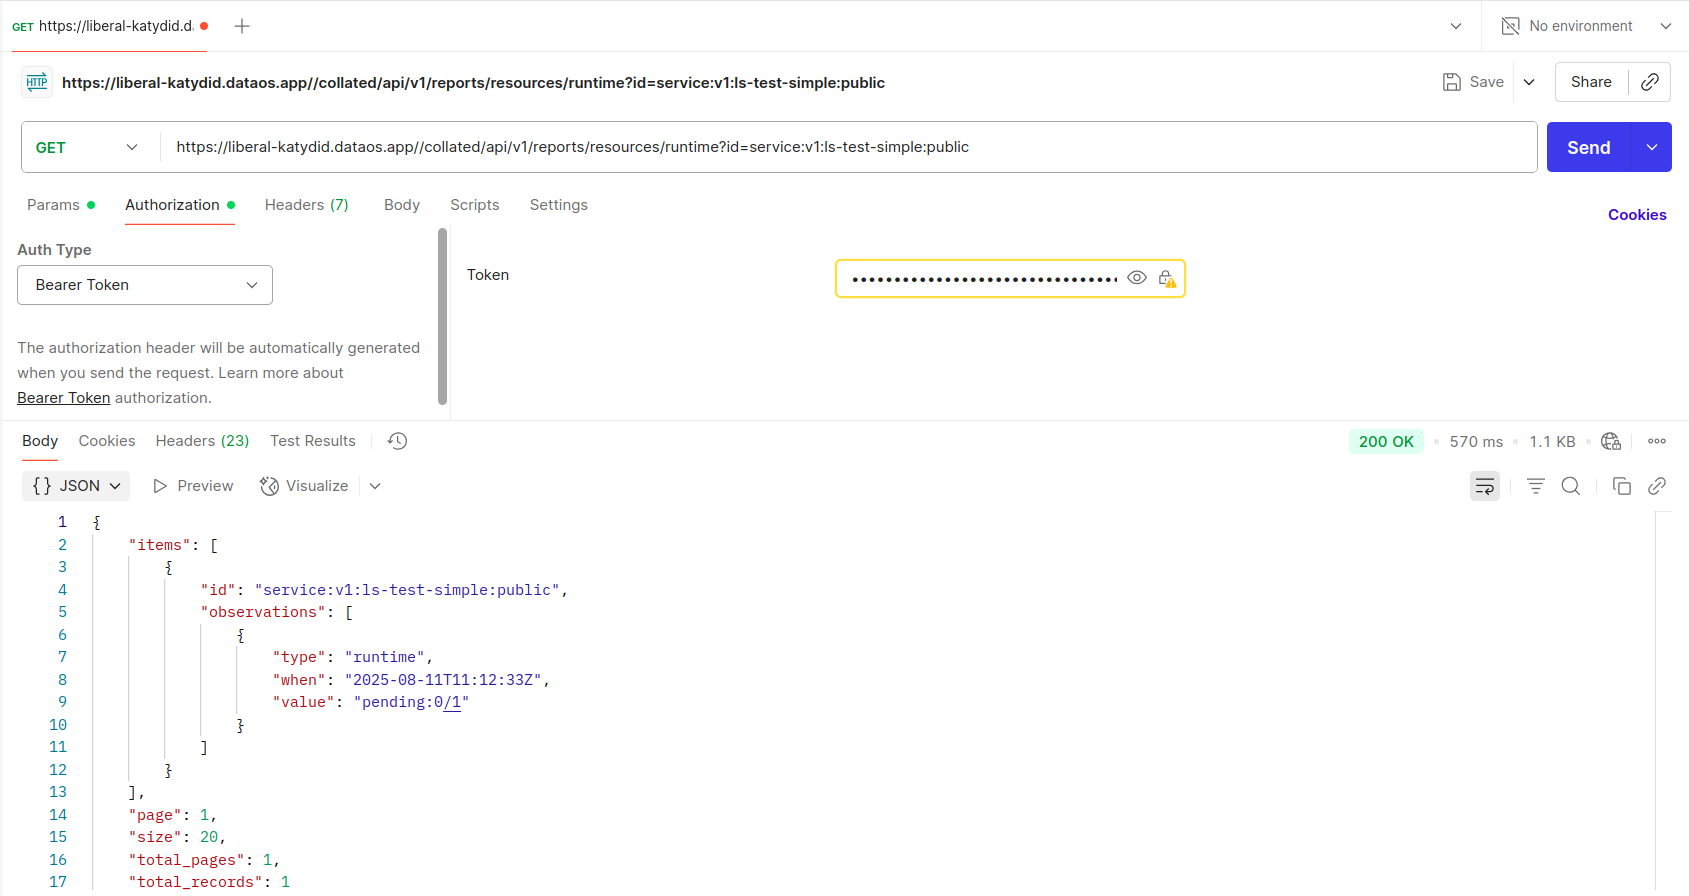
Make a GET request to the endpoint using Postman or a similar tool by providing your DataOS token as a bearer token for authentication from profile section of your DataOS instance.
-
Ensure the response contains the data and structure expected by your Monitor conditions (e.g., the
.valuefield) as shown below.
Postman
Validating the endpoint helps prevent misconfiguration and ensures the Monitor will function as intended.
Step 3: Apply the Monitor manifest through CLI
Once the Monitor manifest file is created, it must be applied within the DataOS environment to create the Monitor Resource. This can be accomplished using the Command Line Interface (CLI) with the following commands:
Alternatively, this task can also be accomplished using a simpler command. Both commands are equivalent, and either one can be used depending on preference:
Example:
Below is an example of how to apply a Monitor manifest file located at /home/monitor/incident-monitor.yml to the curriculum workspace:
Expected output:
After running the command, an output similar to the following should be displayed, indicating that the Monitor Resource instance has been applied.
# Expected Output
INFO[0000] 🔍 apply...
INFO[0001] 🔍 applying(curriculum) cpu-usage-spike:v1alpha:monitor...
INFO[0002] 🔍 applying(curriculum) cpu-usage-spike:v1alpha:monitor...created
INFO[0003] 🔍 apply...complete
Step 4: Verify Monitor status
The following command is used to check the current states of the Monitor Resource to verify that Monitor is configured properly.
dataos-ctl resource get -t Monitor -w curriculum -n runtime-monitor1 -r

# Expected output
INFO[0000] 🔍 get...
INFO[0001] 🔍 get...complete

        NAME       | VERSION |  TYPE   | WORKSPACE | STATUS |            RUNTIME             |    OWNER
-------------------|---------|---------|-----------|--------|--------------------------------|--------------
  runtime-monitor1 | v1alpha | Monitor | curriculum    | active | next:2025-07-28T13:40:00+05:30 | iamgroot
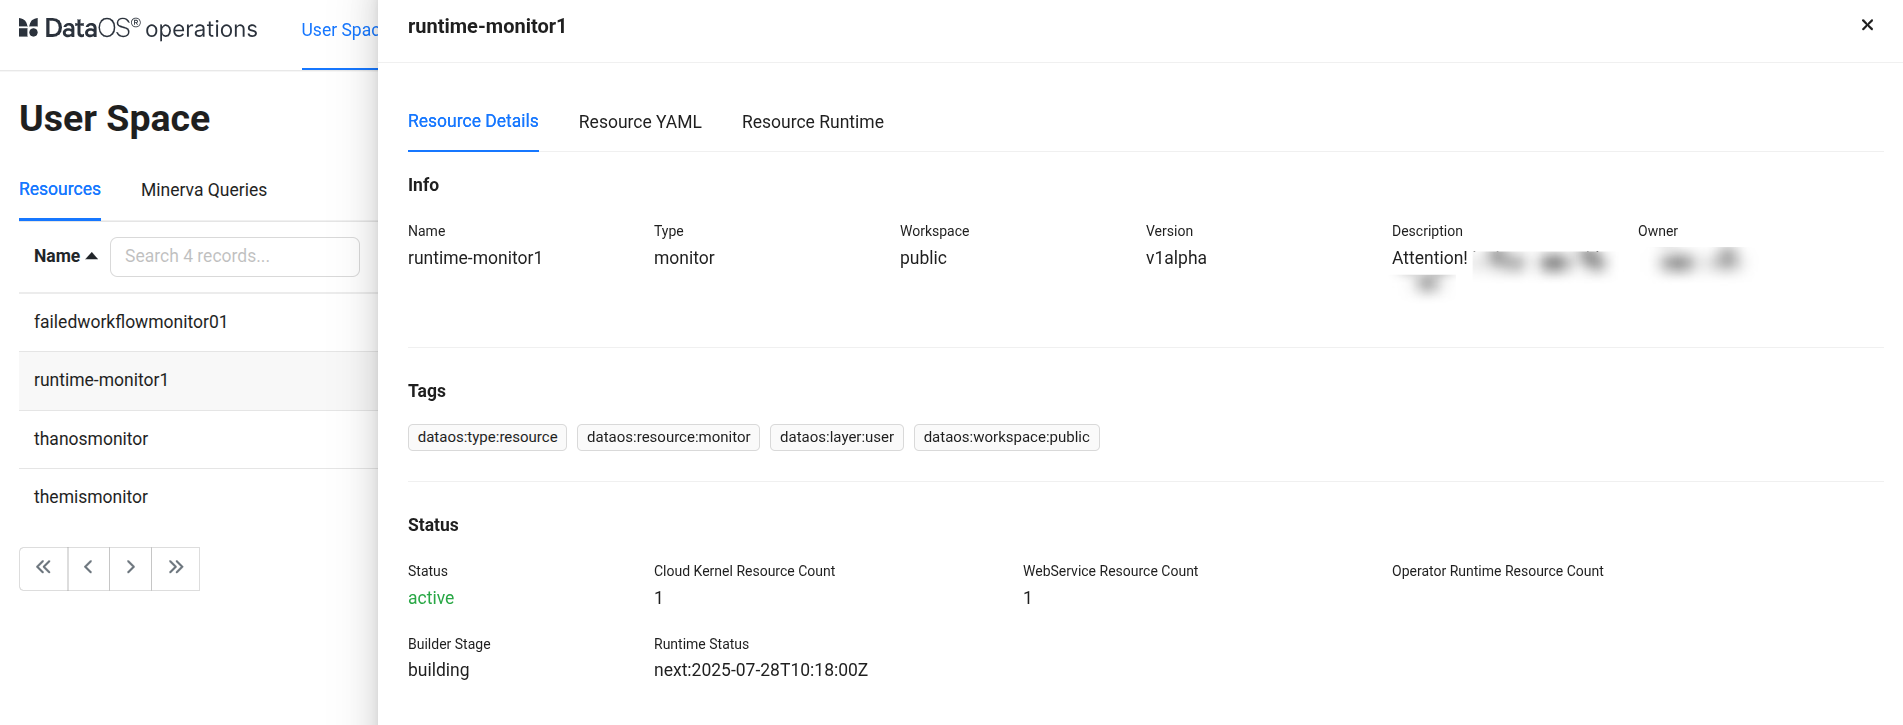
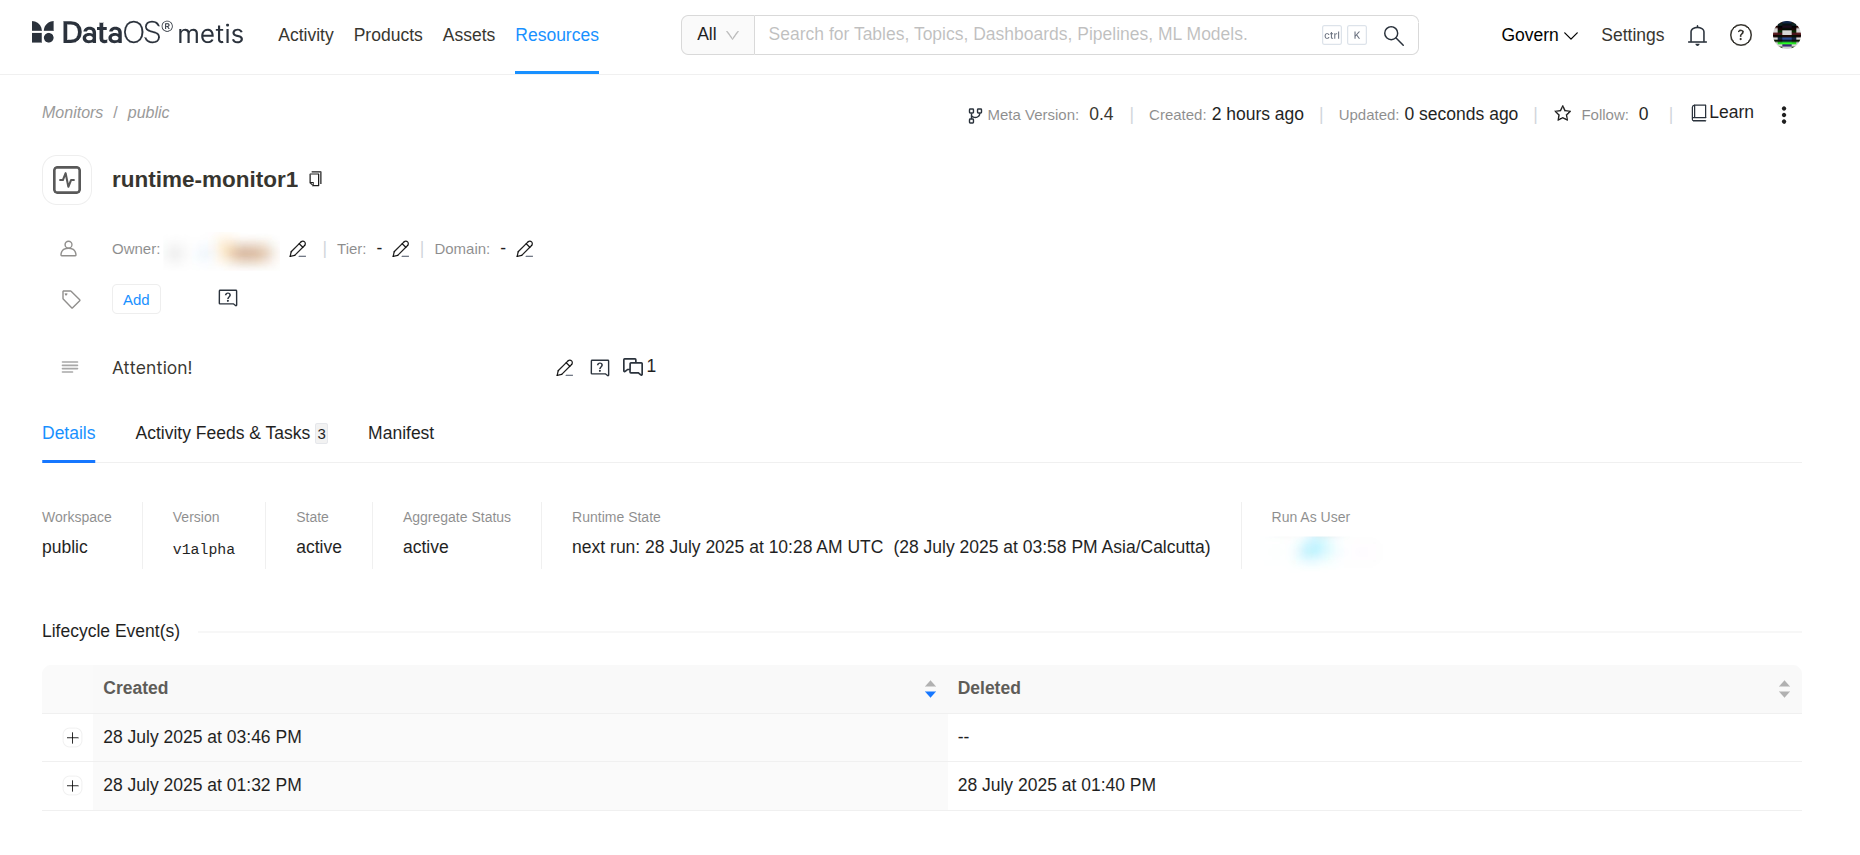
Details of any created Monitor can also be accessed through the DataOS GUI in the Metis catalog and Operations App.
Next steps
After successfully creating the Report Monitor for Workflow runtime failure, the next step is to configure a Pager Resource. The Pager Resource is responsible for sending alerts to configured Teams channels or email addresses whenever the incident condition is met.