Steps to create a Equation Monitor
Follow the below steps to create a Equation Monitor:
Pre-requisites
Before creating a Equation Monitor, the following prerequisites must be met for creating a Monitor in DataOS.
Logged into DataOS CLI:
Ensure that the DataOS Command Line Interface is set up on the local system and that the user is logged in before proceeding. See Setting up CLI.
Permissions:
Verify that the appropriate permissions are available to create and manage a Monitor.
Once the prerequisites are satisfied, Monitor Resources in DataOS can be created.
Step 1: Create a manifest file of a Monitor
Copy and edit the manifest file below to create a Equation Monitor. Replace the provided query type and ql with your specific queries based on the use case.
name: cpu-monitor01
description: Monitor for the CPU usage of a Service
version: v1alpha
type: monitor
monitor:
  schedule: '*/2 * * * *'
  type: equation_monitor
  equation:
    leftExpression:
      queryCoefficient: 1
      queryConstant: 0
      query:
        type: prom
        ql: '100 * (sum by(pod) (container_memory_working_set_bytes{pod="colaexp-ss-0", container!=""})) / (sum by(pod) (kube_pod_container_resource_limits{pod="colaexp-ss-0", resource="memory"}))'
        # The above query measures the current memory usage of the pod colaexp-ss-0 belongs to colaexp Service as a percentage of the pod's total configured memory limit.
    rightExpression:
      queryCoefficient: 0
      queryConstant: 80
    operator: greater_than
  incident:
    type: prom
    name: cpualerts
    category: equation
    severity: info
In above manifest file the left expression executes a Prometheus query that calculates the current memory usage percentage of containers in a specific pod (colaexp-ss-0) by dividing the working set memory by the pod's memory limit and multiplying by 100. The right expression is simply a constant value of 80. The monitor runs every 2 minutes (via the cron schedule /2 * * * ) and triggers an incident when the left expression result is greater than the right expression (i.e., when memory usage exceeds 80%).
Attributes description:
| Attribute | Description | Possible Values |
|---|---|---|
| monitor.schedule | Cron expression defining when the monitor should run. | e.g., '/2 * * * ' |
| monitor.type | Type of monitor. | equation, report, stream |
| monitor.equation.leftExpression.queryCoefficient | Coefficient to multiply with the query result. | Integer or float (e.g., 1) |
| monitor.equation.leftExpression.queryConstant | Constant value to add to the query result. | Integer or float (e.g., 0) |
| monitor.equation.leftExpression.query.type | Type of query | prom, lens, postgres |
| monitor.equation.leftExpression.query.ql | The actual query string to execute. | query string |
| monitor.equation.rightExpression.queryCoefficient | Coefficient for the right side of the equation. | Integer or float (e.g., 0) |
| monitor.equation.rightExpression.queryConstant | Constant value for the right side of the equation. | Integer or float (e.g., 80) |
| monitor.equation.operator | Comparison operator. | greater_than, less_than, equals |
| monitor.incident.type | Type of incident. | Any string |
| monitor.incident.name | Name of the incident. | Any string (e.g., cpualerts) |
| monitor.incident.category | Category of the incident. | Any string |
| monitor.incident.severity | Severity level of the incident. | info, warning, critical |
To know more about each attributes, please refer to the configuration section.
Step 2: Validate the incident condition
Before applying the Equation Monitor manifest file, it should be verified that the configured condition works as expected by running the following command:
dataos-ctl develop observability monitor equation -f /home/office/monitor/equation_monitor.yaml
INFO[0000] 🔮 develop observability...
INFO[0000] 🔮 develop observability...monitor tcp-stream...starting
INFO[0002] 🔮 develop observability...monitor tcp-stream...running
INFO[0002] 🔮 develop observability...monitor tcp-stream...stopping
INFO[0002] 🔮 context cancelled, monitor tcp-stream is closing.
INFO[0003] 🔮 develop observability...complete

RESULT (maxRows: 10, totalRows:1): 🟩 monitor condition met

  EXP VAL (LEFT) |      OP      | EXP VAL (RIGHT) |      {POD="COLAEXP-SS-0"}      | CONSTANT (RIGHT-COMP)
                |              |                 |          (LEFT-COMP)           |
-----------------|--------------|-----------------|--------------------------------|------------------------
  95.48          | greater_than | 80.00           | 95.48                          | 1.00
This allows you to verify that the Monitor's logic and thresholds are set up correctly, ensuring that the monitor will behave as expected when actually applied in the DataOS environment.
Step 3: Apply the Monitor manifest through CLI
Once the Monitor manifest file is created, it must be applied within the DataOS environment to create the Monitor Resource. This can be accomplished using the Command Line Interface (CLI) with the following commands:
Alternatively, this task can also be accomplished using a simpler command. Both commands are equivalent, and either one can be used depending on preference:
Example:
Below is an example of how to apply a Monitor manifest file located at /home/monitor/equation-monitor.yml to the curriculum workspace:
Expected output:
After running the command, an output similar to the following should be displayed, indicating that the Monitor Resource instance has been applied.
# Expected Output
INFO[0000] 🔍 apply...
INFO[0001] 🔍 applying(curriculum) cpu-monitor01:v1alpha:monitor...
INFO[0002] 🔍 applying(curriculum) cpu-monitor01:v1alpha:monitor...created
INFO[0003] 🔍 apply...complete
Step 3: Verify Monitor status
The following command is used to check the current states of the Monitor Resource to verify that Monitor is configured properly.
dataos-ctl resource get -t Monitor -w curriculum -n cpu-monitor01 -r

# Expected output
dataos-ctl get runtime-t monitor -w public -n cpu-monitor01 -r
INFO[0000] 🔍 get...
INFO[0000] 🔍 get...complete

      NAME      | VERSION |  TYPE   | WORKSPACE | STATUS |            RUNTIME             |    OWNER
----------------|---------|---------|-----------|--------|--------------------------------|--------------
  cpu-monitor01 | v1alpha | monitor | curriculum    | active | next:2025-07-30T14:14:00+05:30 | iamgroot
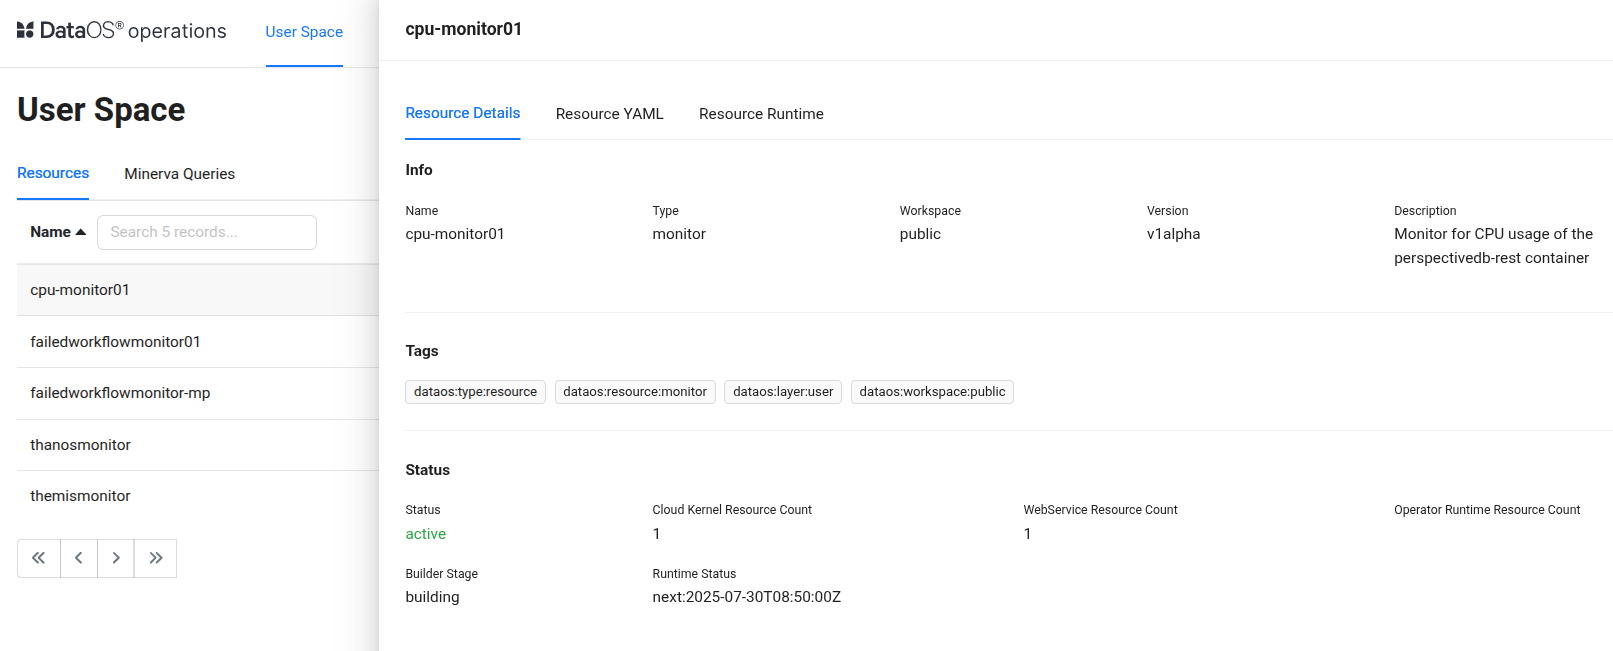
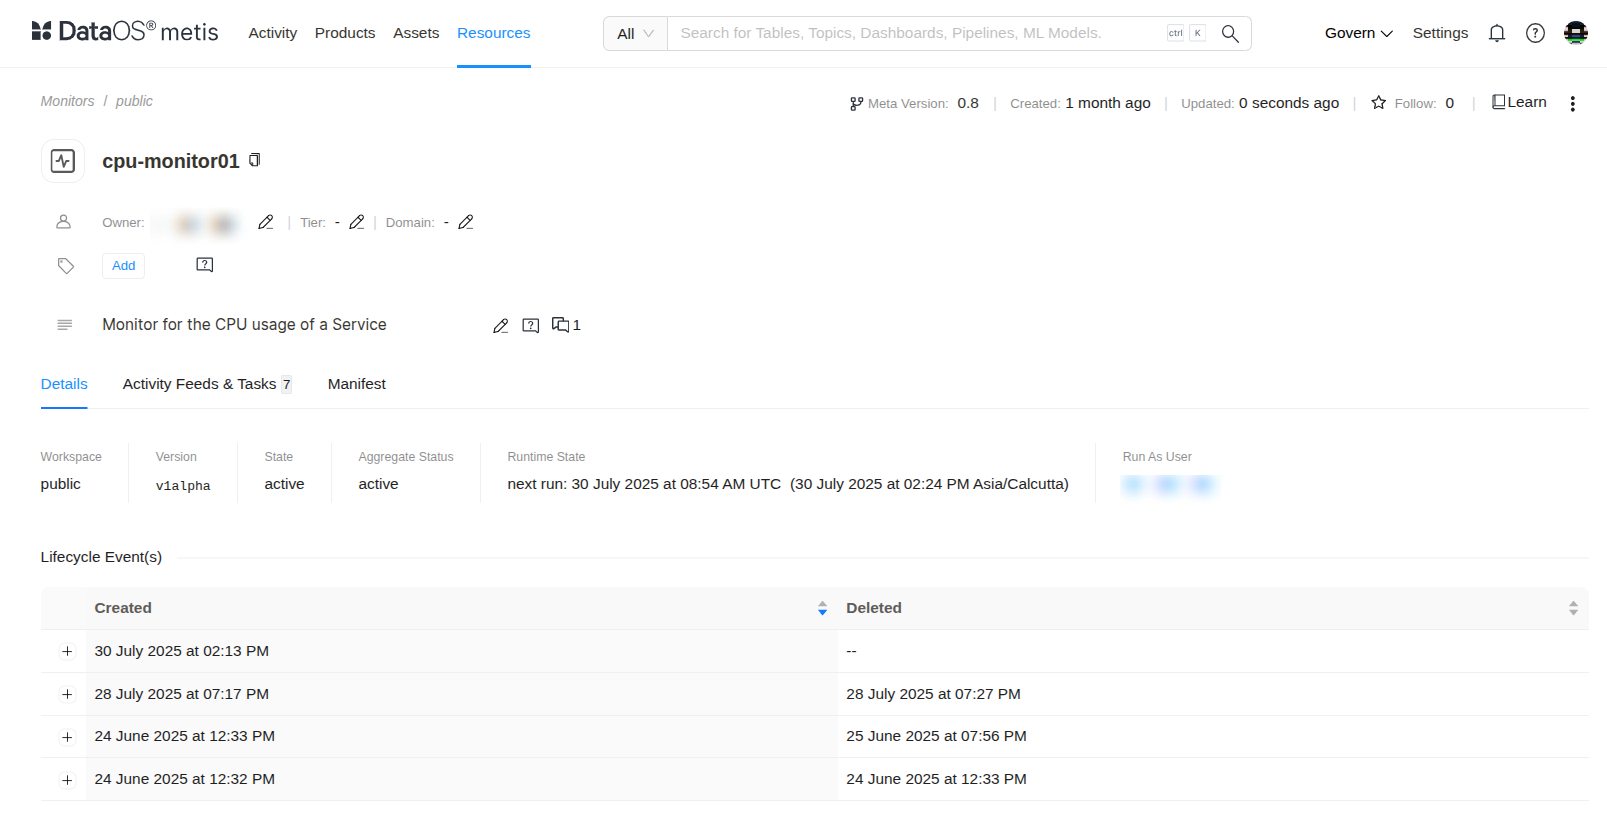
Details of any created Monitor can also be accessed through the DataOS GUI in the Metis catalog and Operations App.
Next steps
After successfully creating the Equation Monitor, the next step is to configure a Pager Resource. The Pager Resource is responsible for sending alerts to pre-configured Teams channels or email addresses whenever the incident condition is met.