Working with Views
Views in Lens
- Views serve as a layer atop the data graph of tables, presenting an abstraction of the entire data model with which consumers can interact.
- They serve as a layer for defining metrics, providing a simplified interface for end-users to interact objectively with key metrics instead of the entire data model.
- View reference dimensions, measures, and segments from multiple logical tables. It doesn’t have any measure, dimension, or segment of its own.
When to define Views?
- Defining Metrics: Views allow you to define metrics by including measures and dimensions from different tables. This enables you to create denormalized tables that comprehensively address a specific use case. For instance, you can have a view that gives you all the dimensions and measures to understand ‘Weekly Spirits Sales in Florida’.
- Providing a simplified interface: By exposing only the relevant measures and dimensions, views make it easier for users to understand and query the data, reducing the complexity of the underlying data model.
Types of Views
-
Entity-first: An Entity-first view is structured around an entity or object of interest, such as a customer, product, or transaction. In this type of view, the focus is on describing the attributes and relationships of a single entity. The goal is to allow users to explore and analyze the characteristics and behaviors of these entities without necessarily being focused on metrics or aggregated measures. For example, an Entity-first view could include detailed customer profiles, product details, or individual transaction records.
-
Metric-first: A Metric is a type of logical view that, by default, provides a logical view of a logical table, containing only one measure and a time dimension. This means that a Metric represents a specific data point or calculation over time, focusing on one key measure, such as average spent per category, retention rate, or churn rate, and linking it to a time period for analysis.
How to define Views?
When designing how your semantic layer will be exposed and consumed by end users, you can follow either an entity-first approach or a metrics-first approach. In both cases, views will be used to build the semantic layer interface.
Entity-first approach
In an entity-first approach, views are built around entities in your data model. Views are built as denormalized tables, bringing measures and dimensions from different tables needed to describe the entity fully.
In the example below, we create the customer_churn_prediction to describe the customer, entity. It has multiple measures and dimensions from multiple logical tables such as marketing_campaign, purchase_data.
views:
   - name: customer_churn_prediction
     description: It is containing the customer churn information.
     public: true
     meta:
       export_to_iris: true
     tables:
       - join_path: marketing_campaign
         prefix: true
         includes:
           - engagement_with_campaign1
           - acceptedcmp1
           - customer_id
           - engagement_score

       - join_path: customer
         prefix: true
         includes:
           - country
           - customer_segments

       - join_path: purchase_data
         prefix: true
         includes:
           - purchase_date
           - recency
           - frequency
           - churn_probability_score
           - churn_rate
           - purchases
Metrics-first approach
The metrics-first approach builds views around key performance metrics in a data model. Each view focuses on a specific measure and includes all relevant dimensions for grouping, filtering, and tracking time. This approach helps business teams make informed, data-driven decisions by providing clear, consistent, actionable metrics.
Key benefits of the Metrics-first approach
- Operational evaluation: Empowers users to understand key business performance metrics, enabling them to answer critical questions such as:
- What happened?
- Why did it happen?
- What will happen next?
- What should we do in response?
- Simplified analysis: By focusing on a single measure, each view allows for efficient and straightforward analysis, ensuring clarity in data interpretation.
- Consistency: Each metric is centrally defined, ensuring consistency across various tools and reports, thus eliminating discrepancies in business performance analysis.
A metric in the metrics-first approach typically includes:
- Metric name: A clear, descriptive name that reflects the purpose of the metric.
- Measure: The key performance indicator or value being tracked (e.g., customer churn rate).
- Time dimension: The period over which the metric is measured (e.g., daily, weekly). To access the time granularity feature, you must mention the timestamp data type instead of the time and date data type.
- Related dimensions: Additional attributes or dimensions (such as customer demographics, region, or product type) that allow for further breakdown and analysis.
Views are named after the specific metric they represent, making them easy to identify and work within various systems.
views:
  - name: {metric_name}
    description: {Description_of_the metric}
    public: {true}
    meta:
      title: {title_name_of_the_metric}
      tags:
        - DPDomain.{Domain_name}
        - DPUsecase.{Use_case}
        - DPTier.{Tier}
      metric:
        expression: {"*/45  * * * *"}
        timezone: {"UTC"}
        window: {"day"}
        excludes:
        - {purchases}
    tables:
      - join_path: {Tablename}
        prefix: {true}
        includes:
          - {metric}
          - {dimension that is used to calculate measure}
          - {time dimension}  #timestamp datatype
          - {another dimension to drill down}
#example 1 (single metric)
views:
  - name: cloud_service_cost
    description: This metric tracks the total costs associated with cloud services, providing insights into resource usage, billing trends, and cost optimization opportunities. It helps organizations manage cloud expenditures and improve financial efficiency.
    public: true
    meta:
      metric:
        expression: "*/5  * * * *"
        timezone: "UTC"
        window: "week" #day, month, quarter, year
    tables:
      - join_path: billing
        prefix: true
        includes:
          - cost_by_cloud_service
          - billing_date
If needed, you can create multiple views for different use cases from a single entity. This approach prevents users from being overwhelmed with too much data by presenting focused data slices in separate views, each highlighting only relevant measures and dimensions.
Multiple metrics in the single view
#example 2 (multiple metrics in the same views YAML)
views:
  - name: conversion_rate
    description: This metric tracks the percentage of leads or prospects who successfully converted into paying customers over a month time period. It provides insights into the effectiveness of marketing efforts and sales processes.
    public: true
    meta:
      tags:
        - DPDomain.Sales OPS
        - DPUsecase.Purchasing Behaviour Analysis
        - DPTier.Consumer Aligned
      metric:
        expression: "*/5  * * * *"
        timezone: "UTC"
        window: "month"
    tables:
      - join_path: sales
        prefix: true
        includes:
          - frequency
          - customer_no
          - invoice_date

  - name: qtd_revenue
    description: This metric tracks the total revenue generated in the current quarter to date (QTD). It provides insights into financial performance over the quarter, helping to evaluate growth trends and revenue targets.
    public: true
    meta:
      tags:
        - DPDomain.Sales
        - DPUsecase.Purchasing Behaviour Analysis
        - DPTier.Consumer Aligned
      metric:
        expression: "*/5  * * * *"
        timezone: "UTC"
        window: "month"

    tables:
      - join_path: sales
        prefix: true
        includes:
          - total_revenue
          - invoice_date
          - source

      - join_path: product
        prefix: true
        includes:
          - category
          - brand
          - class

      - join_path: account
        prefix: true
        includes:
          - site_name
          - state
          - license_type
          - customer_name
Exploration and activation
- Exploration: Views can be explored using tools such as Iris Board, which provides automated, dynamic dashboards for visualizing and analyzing performance metrics. These tools help detect anomalies and reveal trends over time. You can also query the view in Lens Studio directly.
- Activation: Metrics can be embedded into operational workflows, triggering alerts, populating Excel models for cross-tab analysis, or integrated into email automation tools for marketing or retention strategies.
- You can explore the view via
- Lens Studio
- Iris Board
- Data Product Hub
Lens Studio
To explore the views via Lens Studio, follow the below steps:
Step 1: Access Lens Studio Navigate to the DataOS Home Page and click on Lens2.
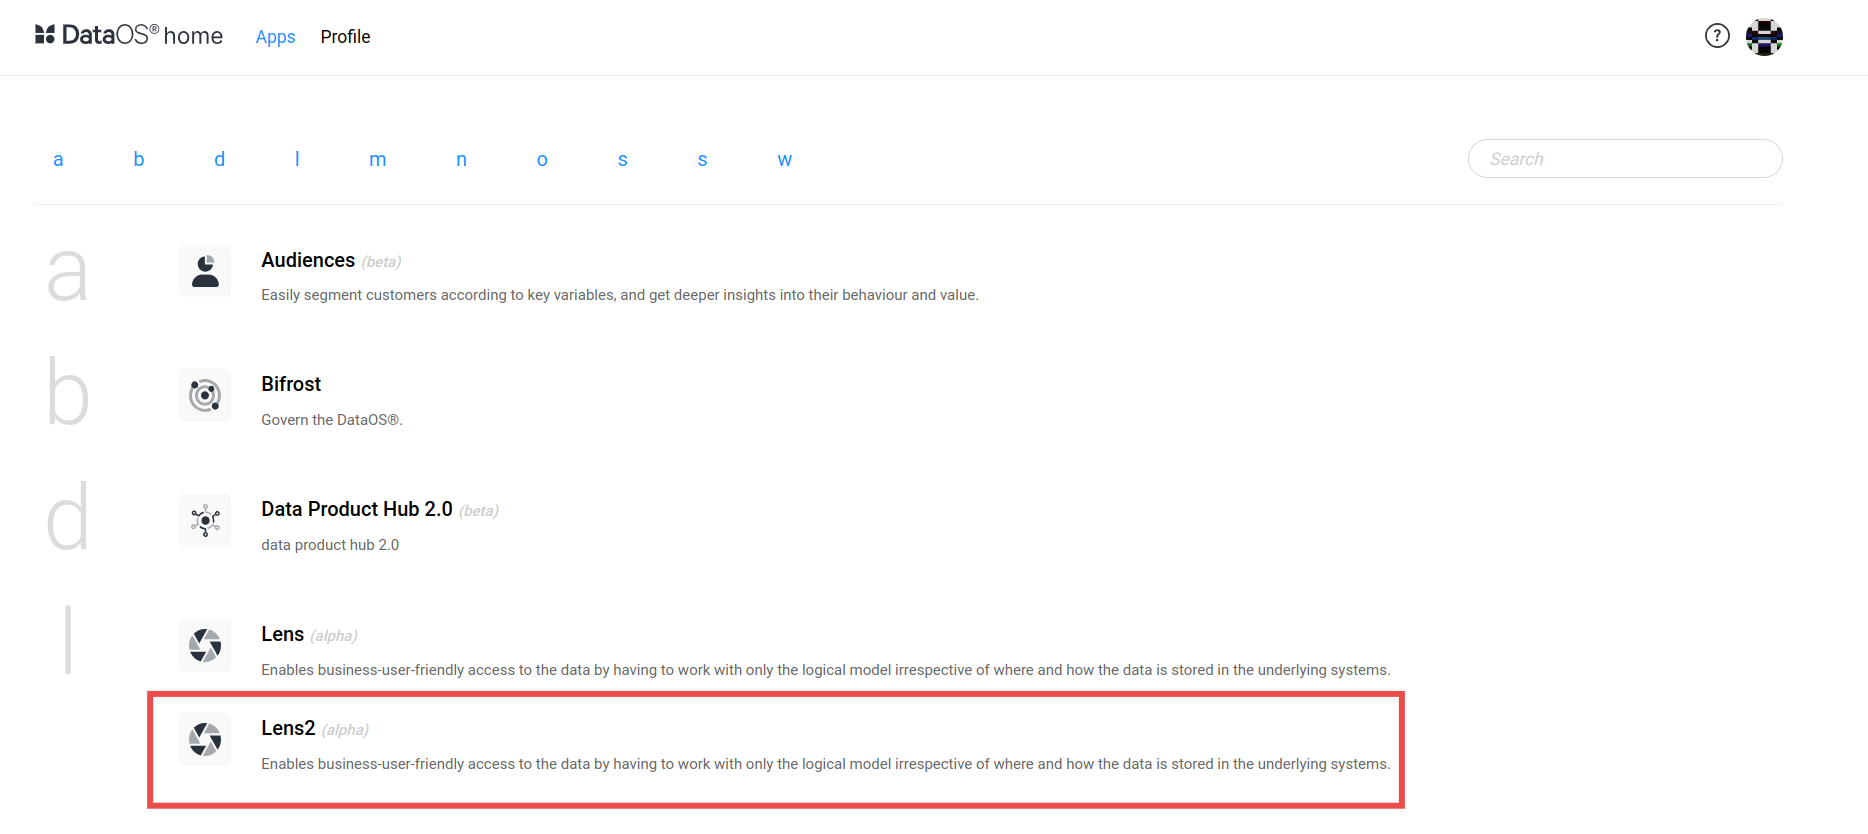
- This action will open a Lens Studio page, as shown below. Here, you will be greeted with a welcome message that includes a link redirecting you to Metis, where you can discover the list of lens resource.

Step 2: View the list of Lenses
-
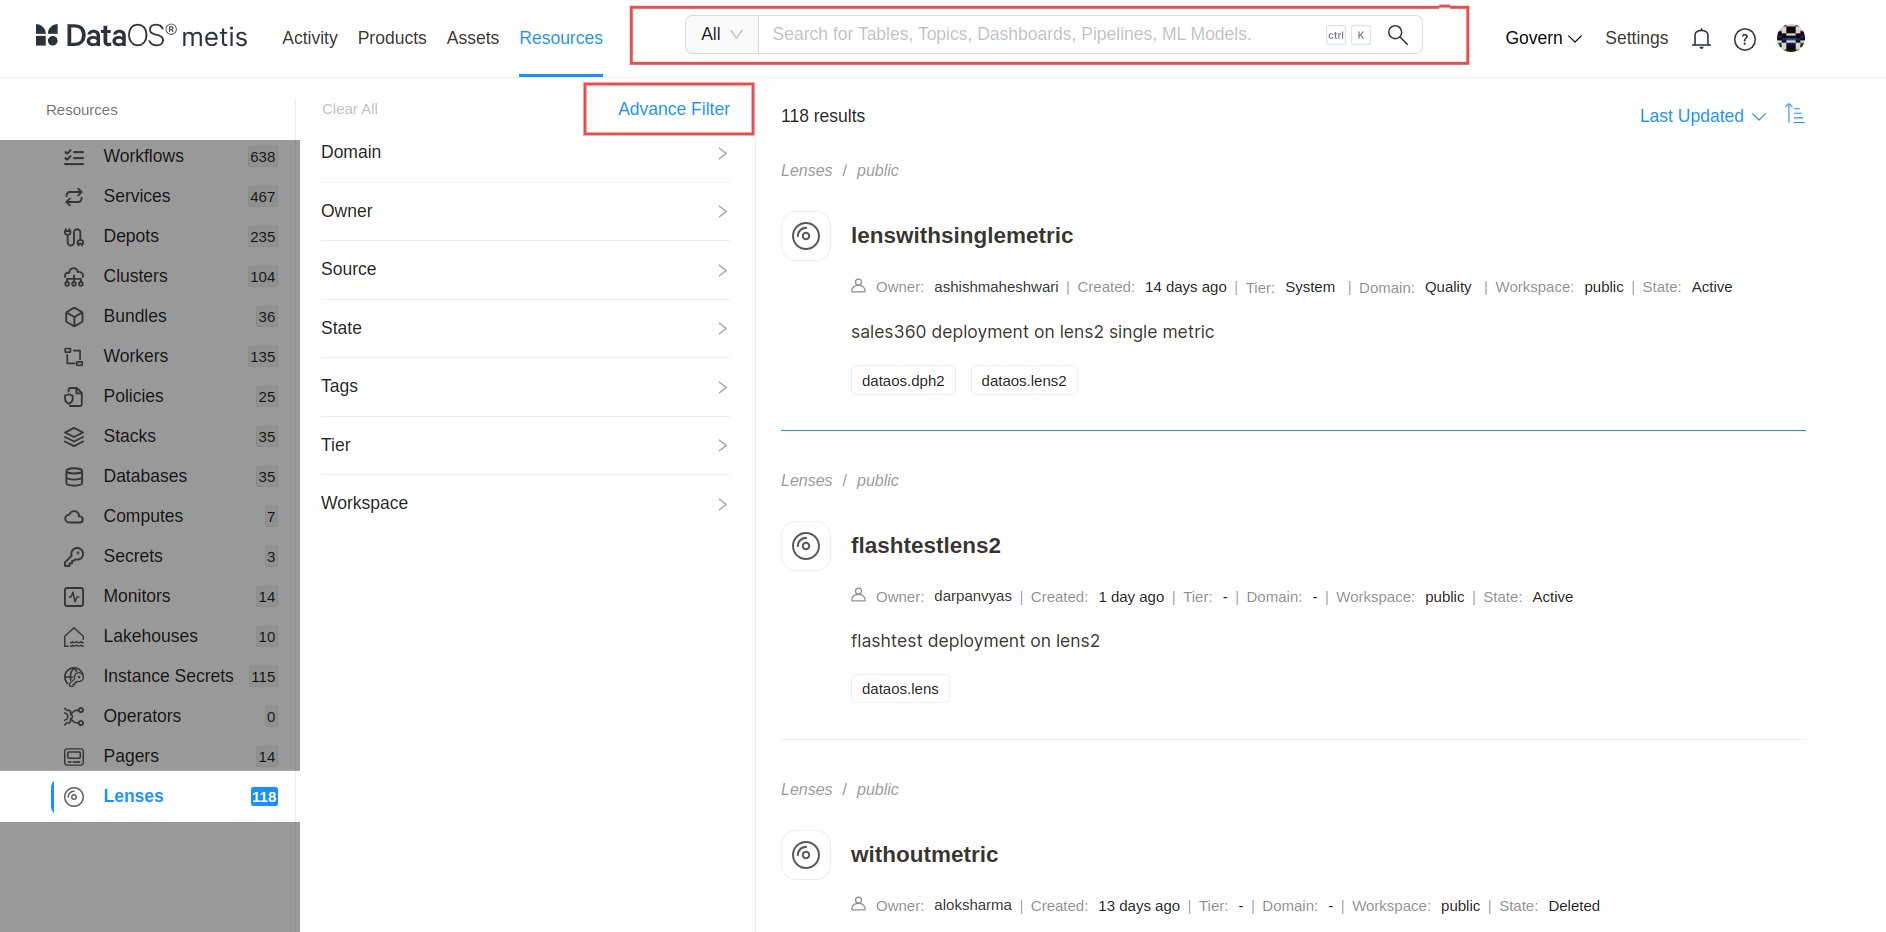
From the given list of Lens, users can select the desired lens to explore.
-
Users can search for a specific Lens in the Resource section using the search bar.
-
Additionally, advanced filter options are available to narrow down the list of Lens. Filters allow users to sort all Lenses by parameters such as domain, owner, source, state, tags, tier, and workspace.
Step 3: Selecting a Lens
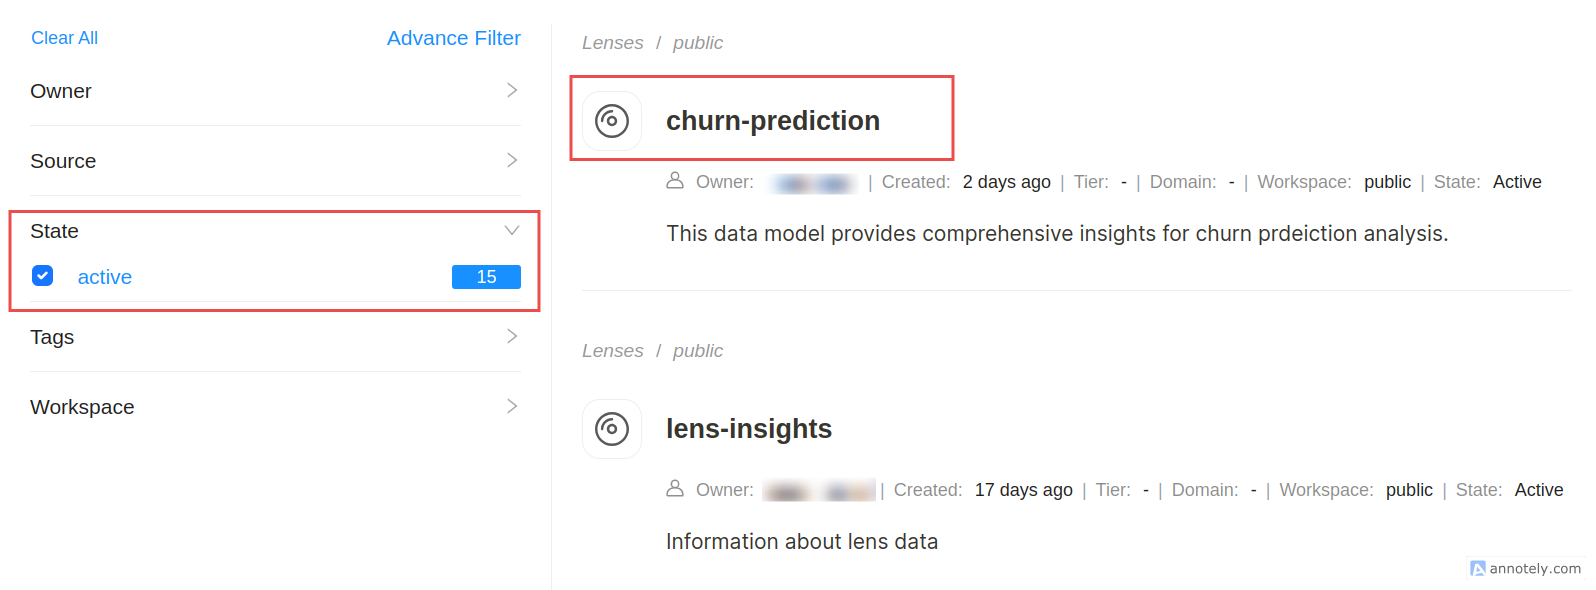
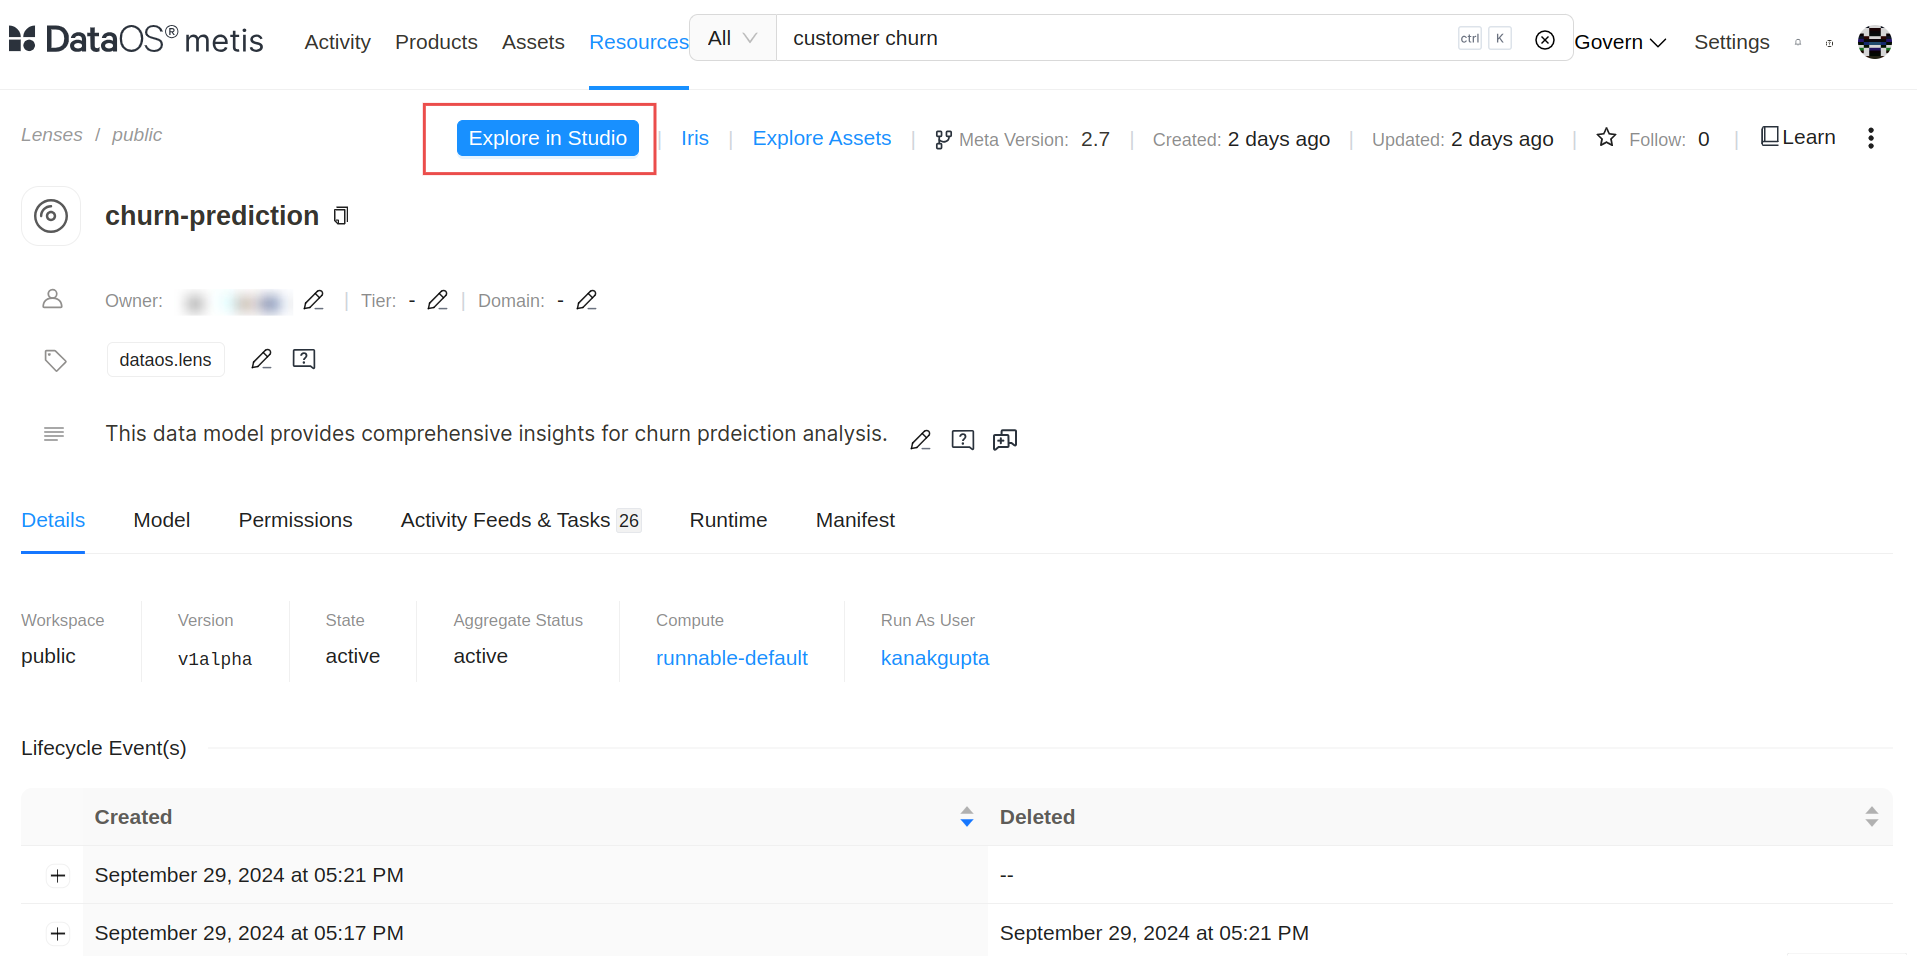
- Select a desired Lens from the list to explore. For example, apply the advanced filter state: active to filter only the active Lens. From the filtered list, select the Lens Churn Prediction to view detailed information, including metadata, usage history, and related resources.
-
Upon selection, the corresponding interface for the selected lens will open.\
-
Click on the Explore in Studio button.
Step 4: Exploring a View
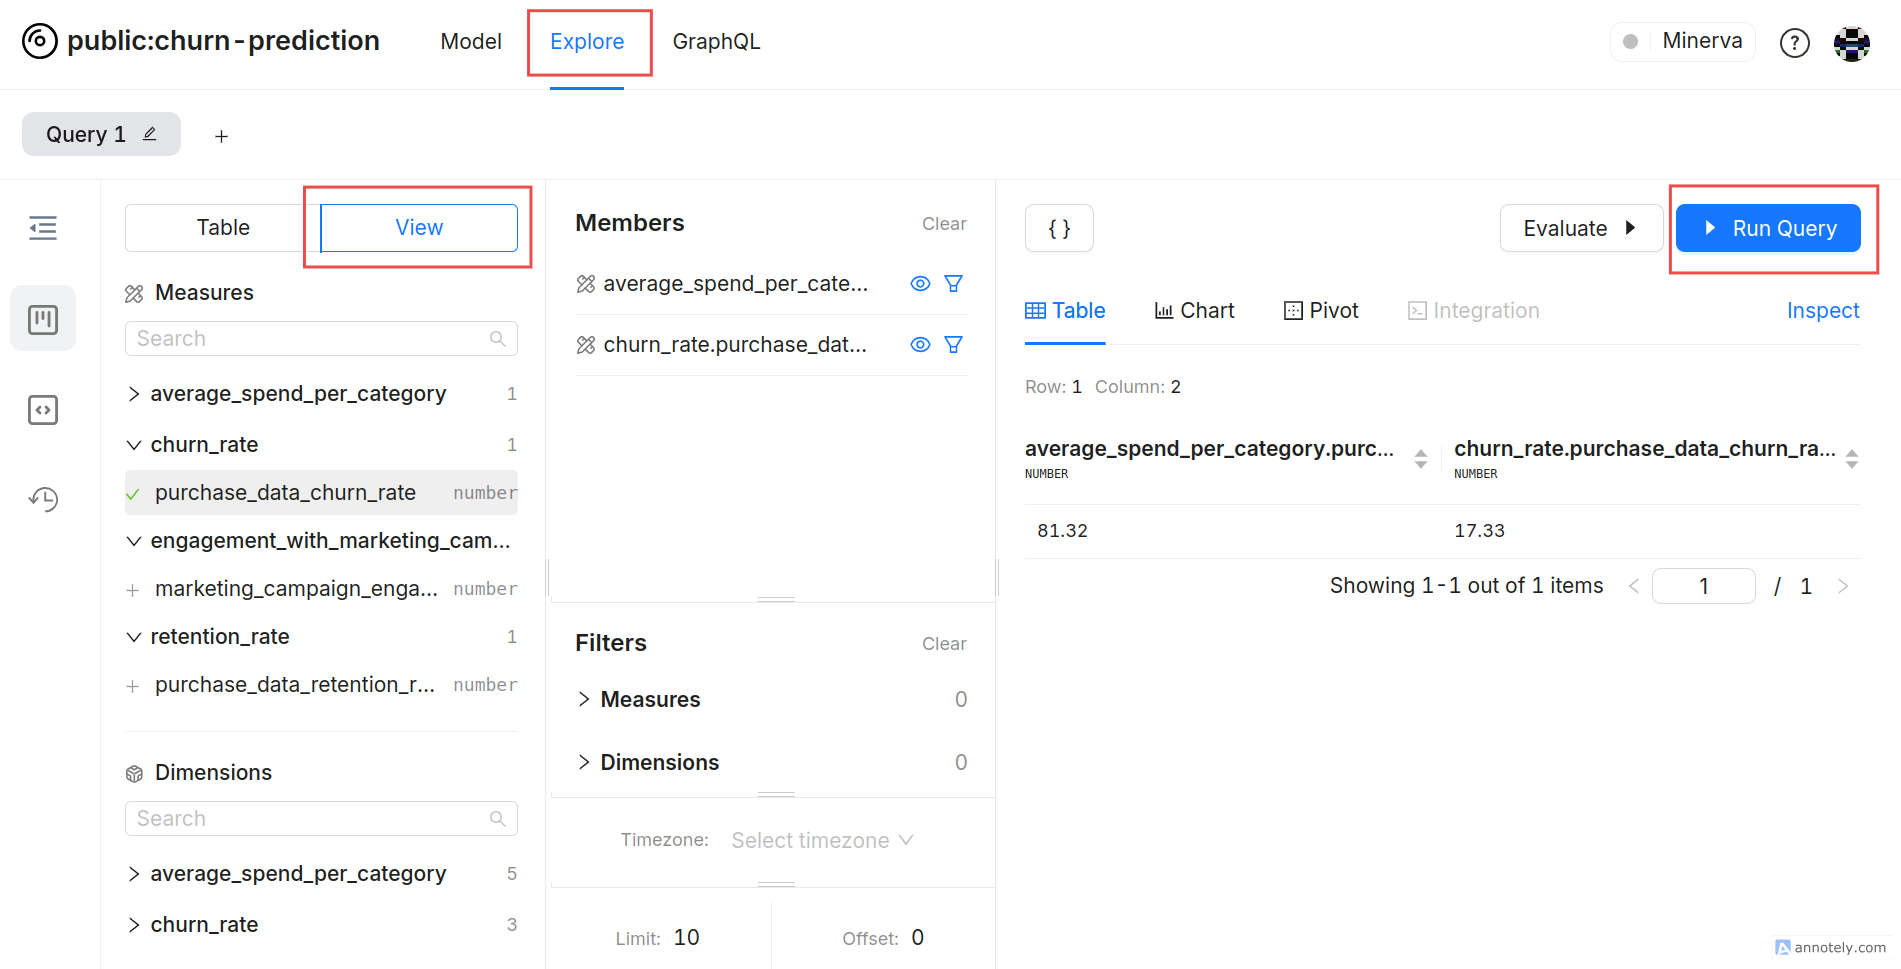
- In the Explore interface, click the View tab to query and access all associated views.
- Select a view from the list to display its available measures and dimensions in the dropdown menu.
- Choose the required measures and dimensions, then click the Run Query button to execute the query.
Iris Board in Metis
To explore the view via Iris Board, follow the same steps as above to navigate to the Lens Studio page.
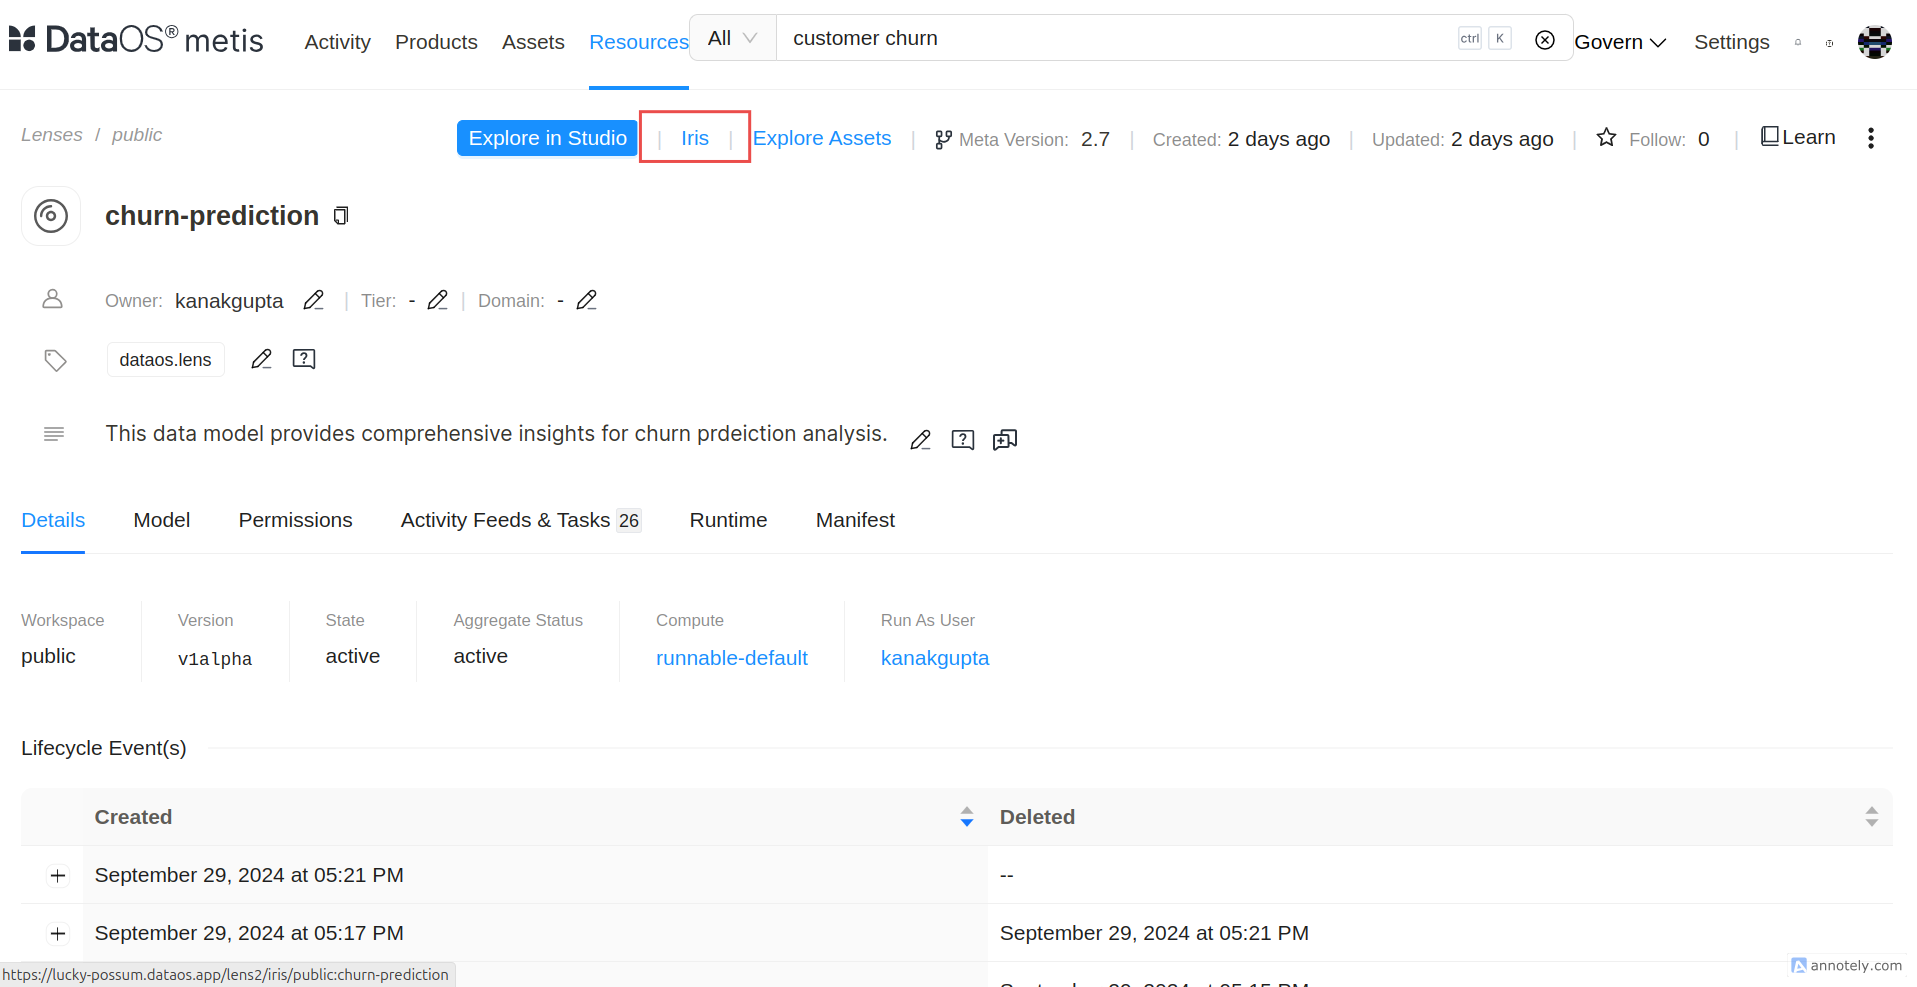
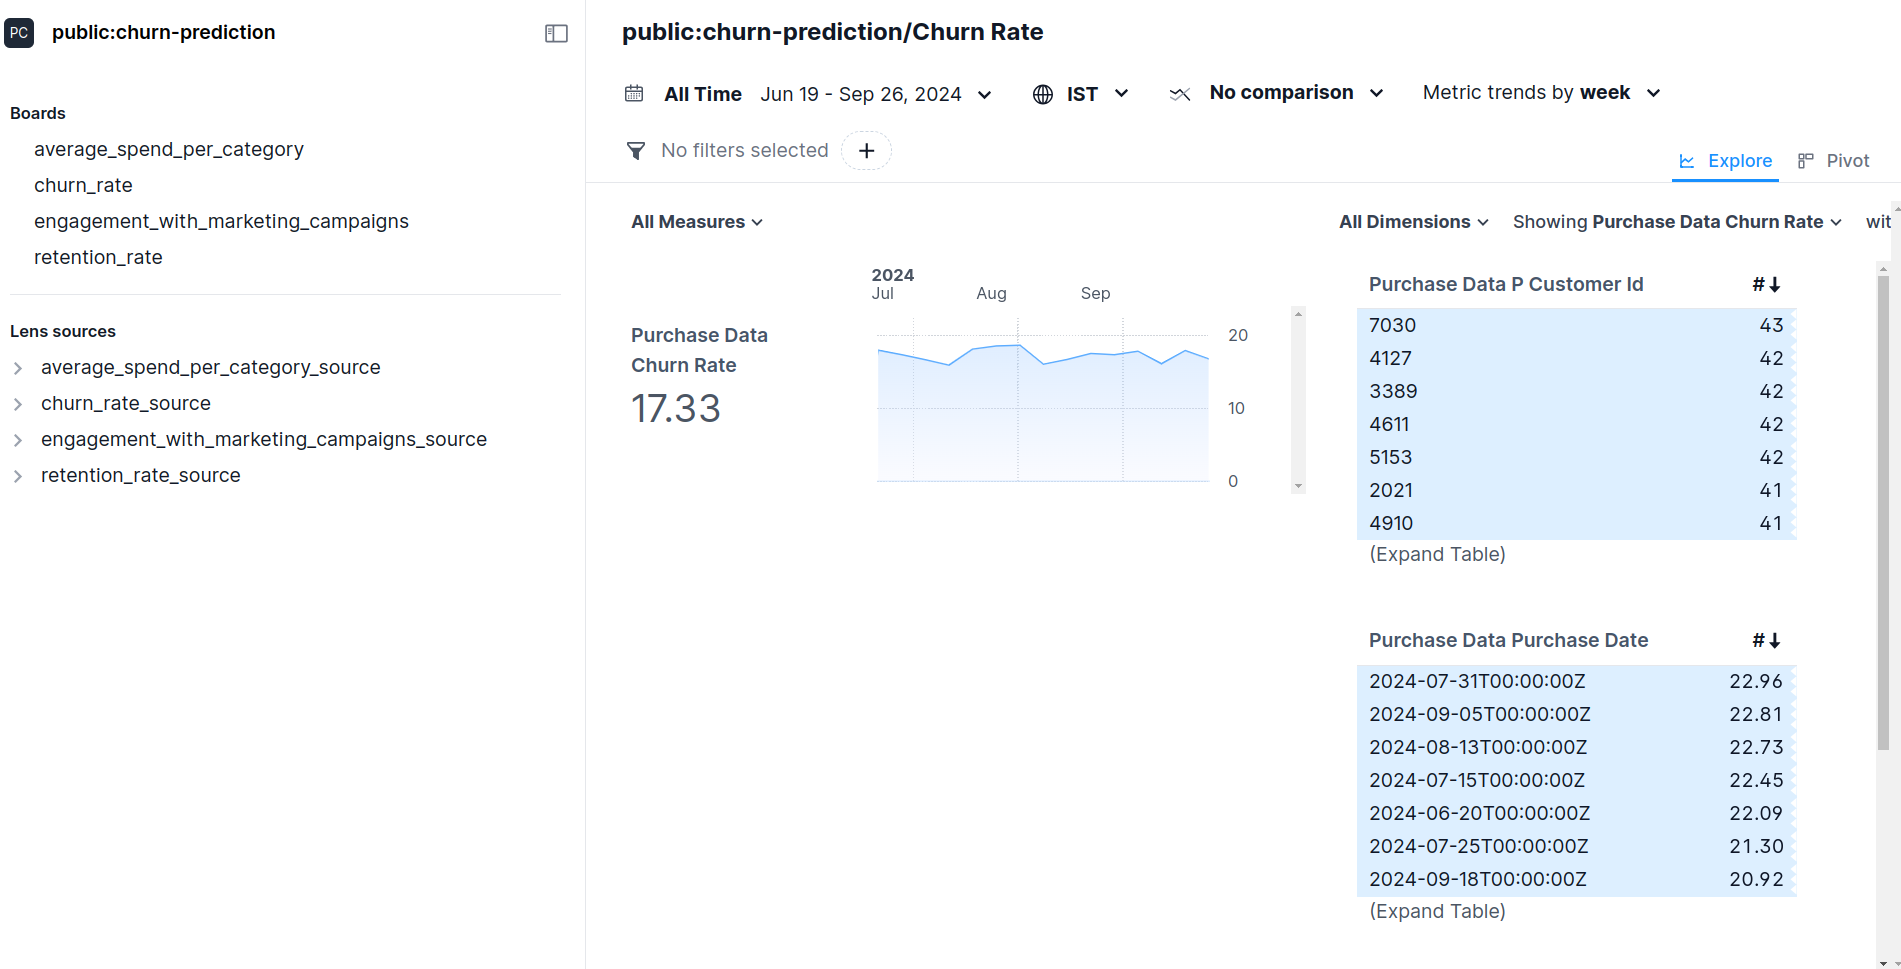
Once on the Lens Studio page, click the Iris button located beside the Explore button to explore the view via the Iris Board. An Iris board exploration page will be displayed, listing all the views.
Exploring Views on Data Products Hub
Follow these steps to explore views and metrics within the Data Products Hub (DPH).
Step 1: Access DataOS Home Page
- Open the DataOS Home Page in your browser.
- On the home page, click on the Data Products Hub application.
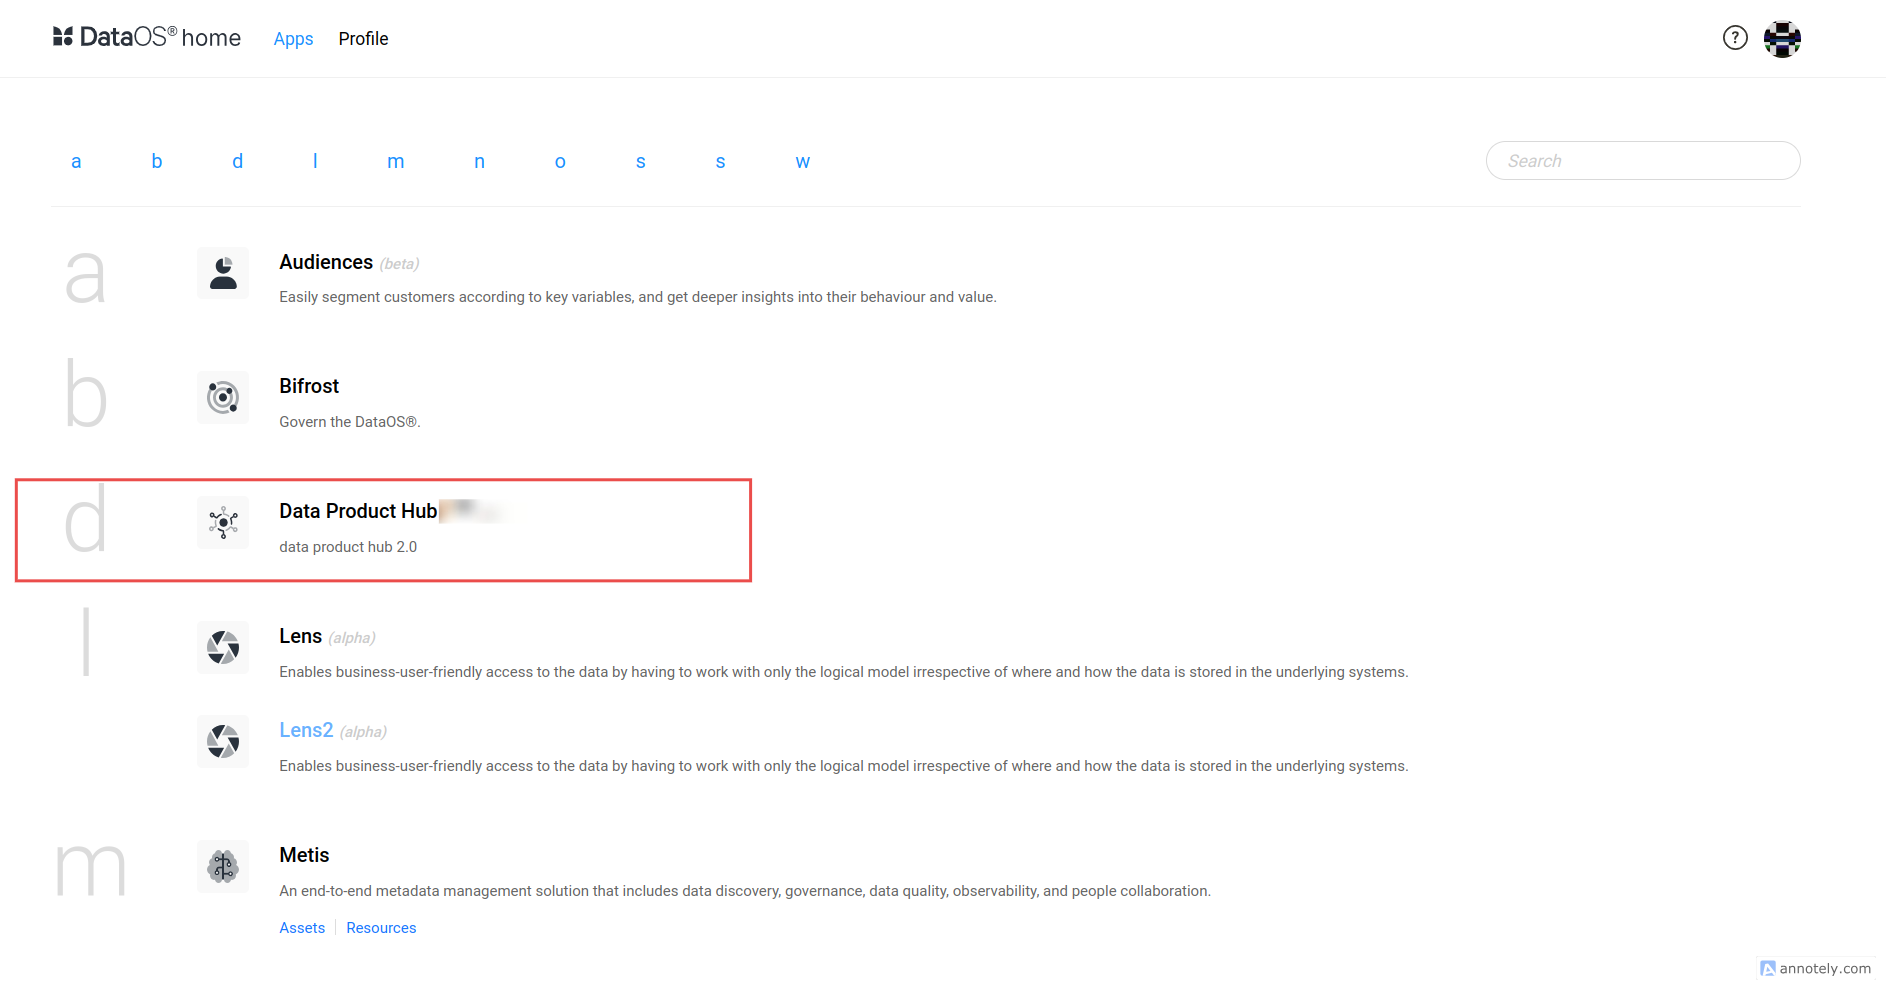
Step 2: Search for a Data Product
- Use the search bar in Data Products Hub 2.0 to find the desired data product. For example, search for Customer Churn Prediction.

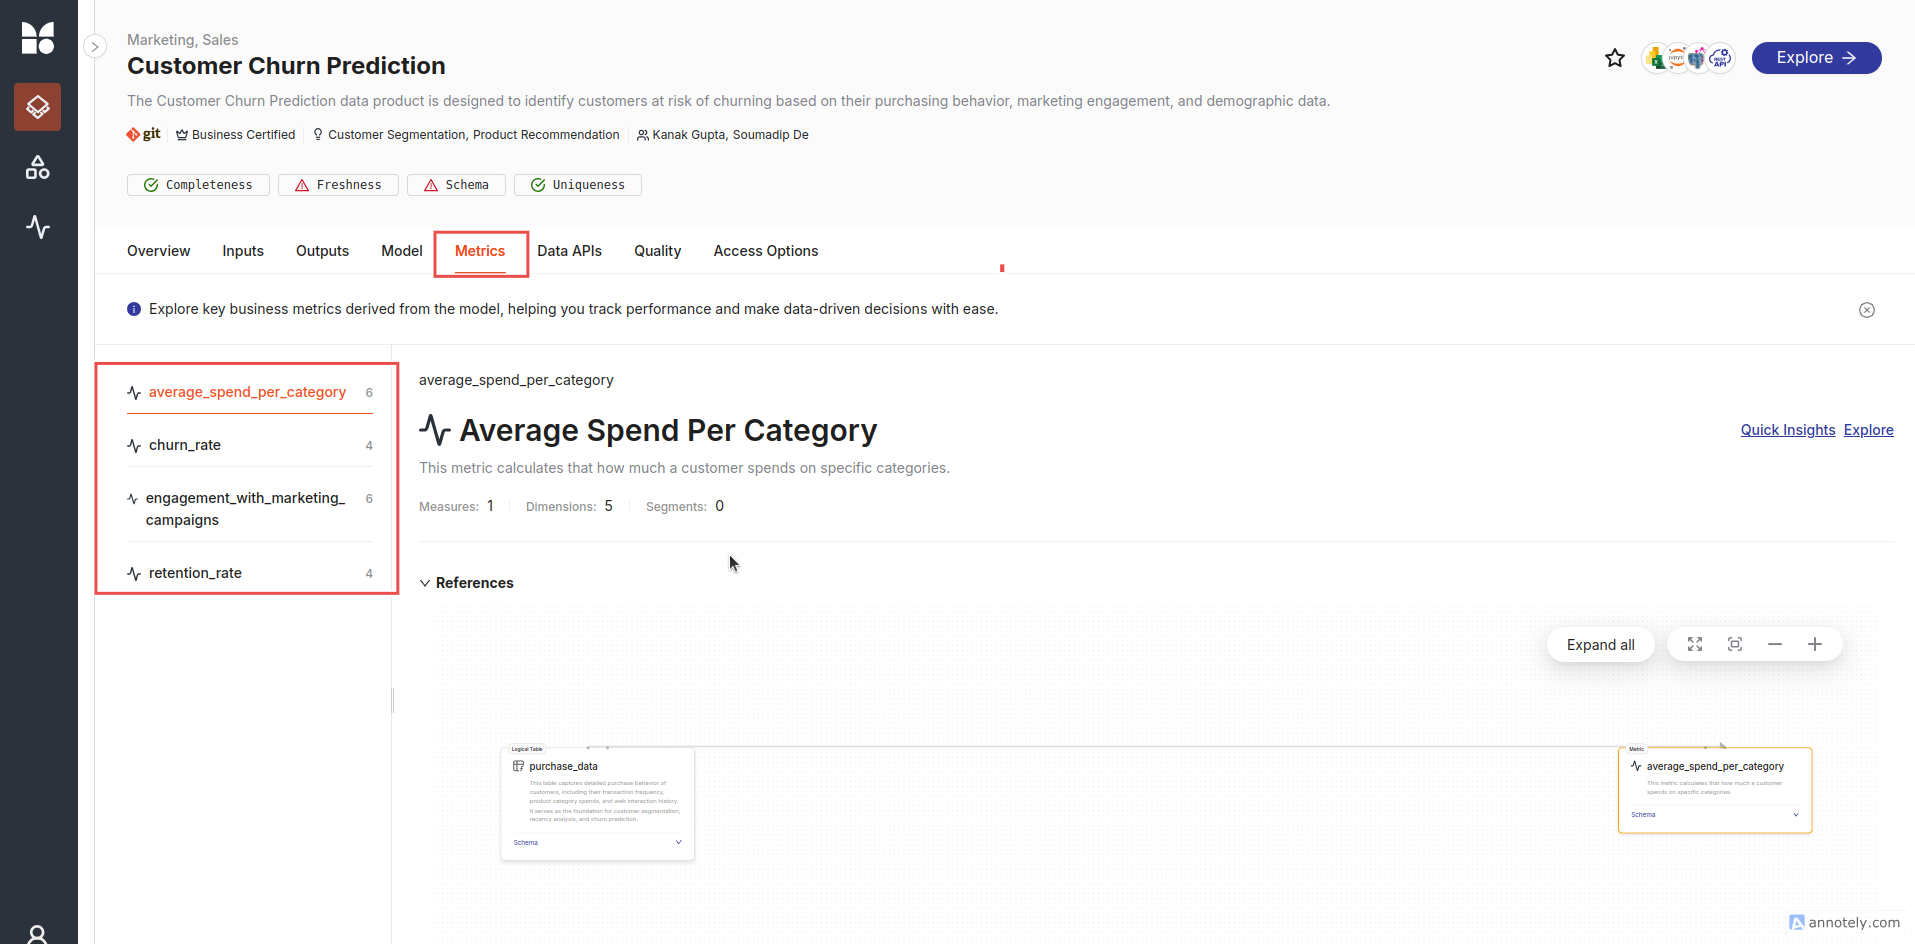
Step 3: Explore Metrics
- The Overview tab will load by default.
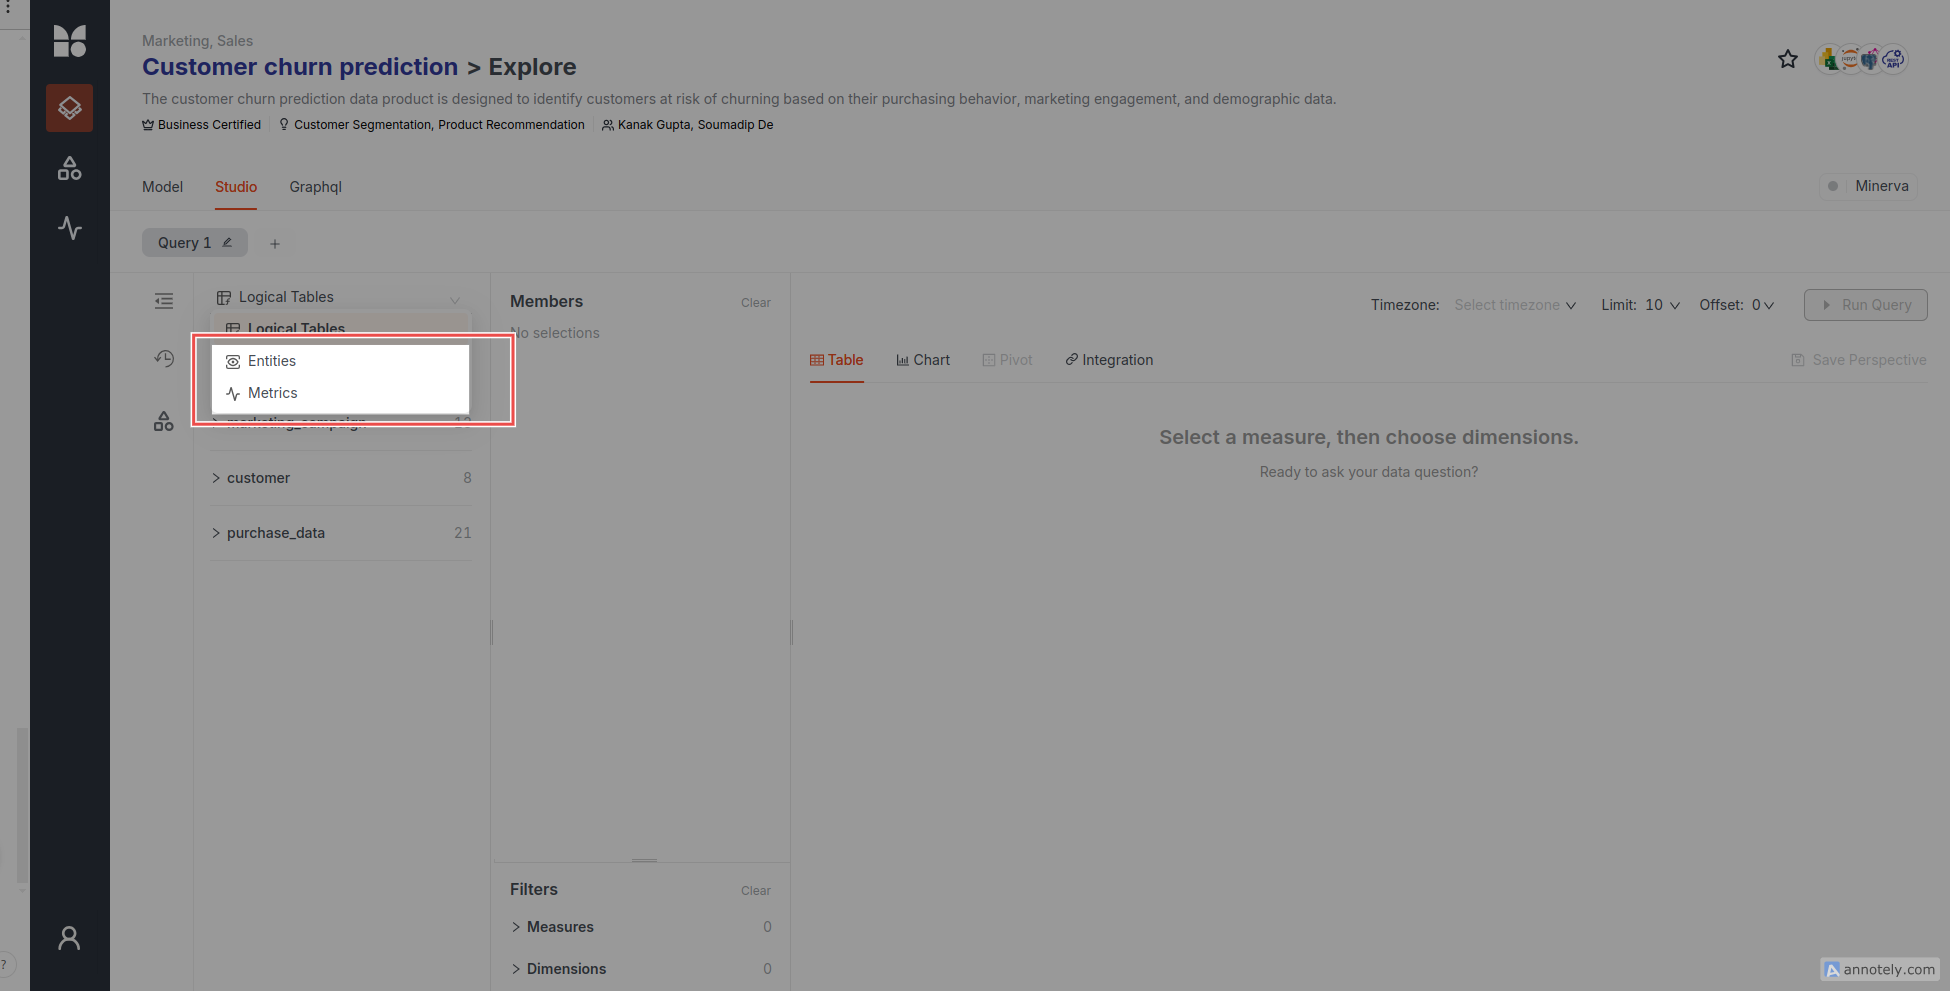
- Click on either Entitites or Metrics tab to view all available views for the selected data product.
- This section provides an overview of the metric-first approach and displays key metrics associated with the data product.
Step 4: View data lineage
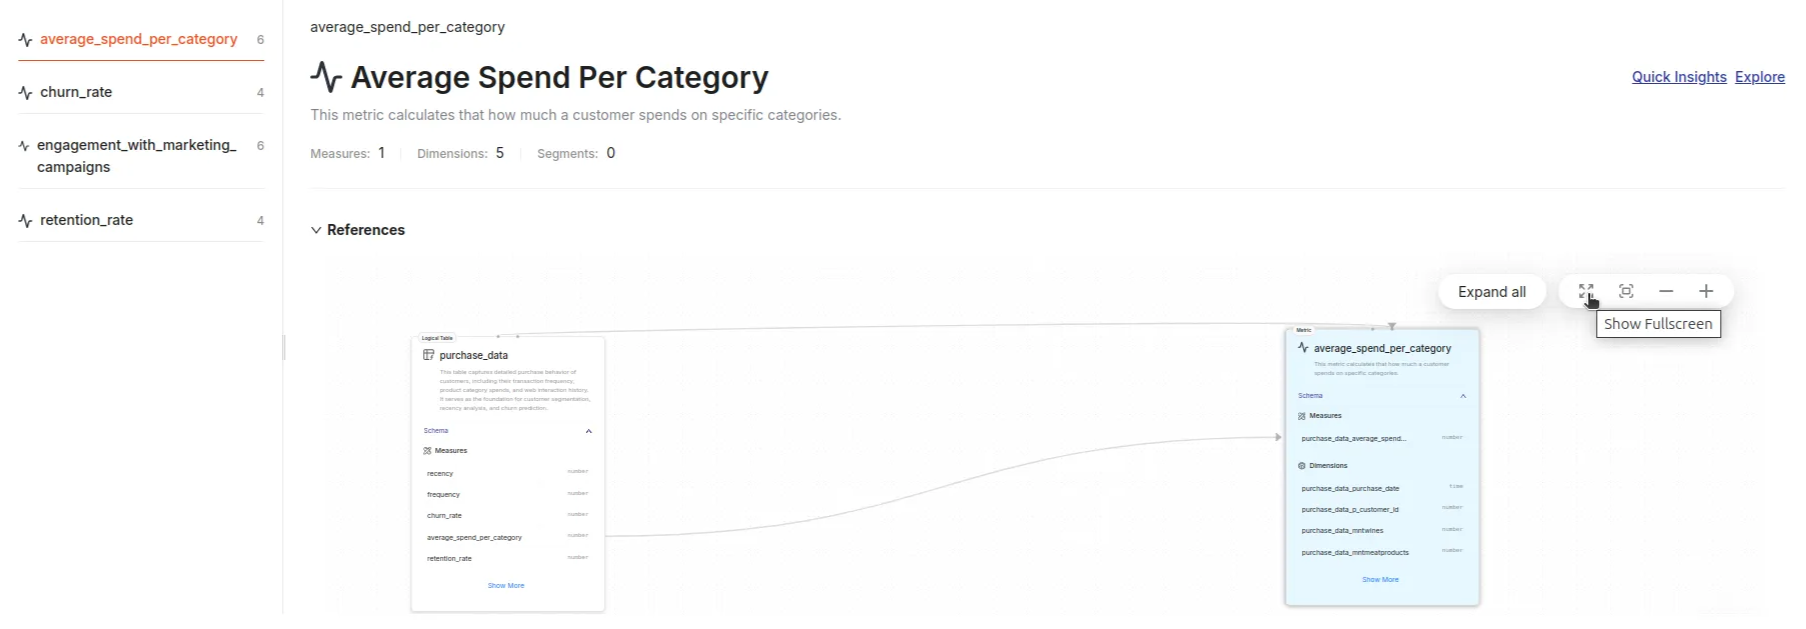
- You can trace the data source for each metric. For example, a metric for Customer Churn Prediction might be sourced from the purchase_data table.
- To explore data lineage, click on the drop-down arrow. This will show the origin of the metric, including the table and dimensions used in the calculation.
- The lineage view also helps you understand how the metric is calculated and which data sources contribute to it.
Step 5: Access the Iris board for Metric analysis
- Click on the Quick Insights link at the References section's top-right corner.
- This will take you directly to the Iris Board, where you can observe and analyze the metric view in more detail.
Step 6: Navigate to the DPH Studio
- Next to the Quick Insights button, click the Explore button.
- This will open the DPH Exploration Page, with the default tab set to Studio. Query your metrics here.
