Inspecting the Spark UI
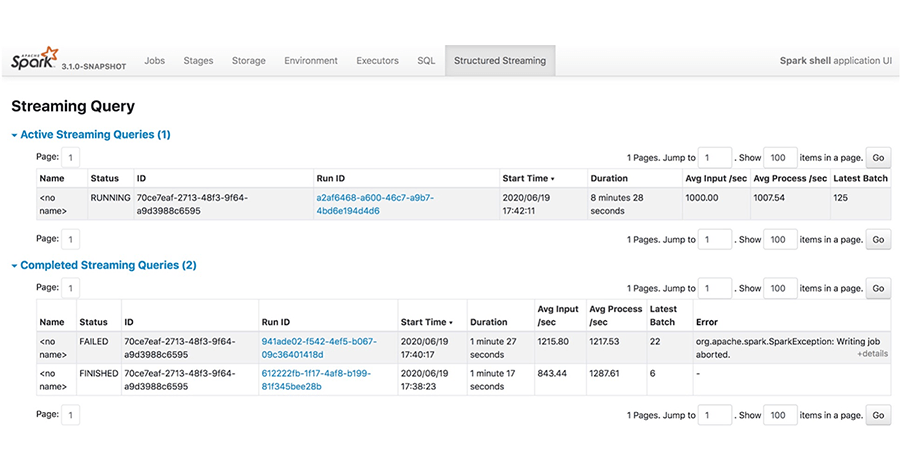
Spark provides an elaborate web UI that allows us to inspect various components of our Flare Jobs. It offers details on memory usage, jobs, stages, and tasks, as well as event timelines, logs, and various metrics and statistics that can give you insight into what transpires in your Flare Jobs, both at the Spark driver level and in individual executors.
Launching the Spark UI
Spark UI can be accessed by using the following command on the terminal
dataos-ctl develop port-forward -n <name-of-the-pod> -p <port-mapping-of-the-pod> #by default port mapping of the pod is 3000:3000
Example
To know more about each of the Spark UI Tabs and the information it contains visit the below link
Navigating through the Spark UI Tabs
Case Scenario
Now we are familiar with the various aspects of Spark UI, now let’s take a query and use the Spark UI to optimize it.
Case Scenario: Optimizing using Spark UI
Conclusion
The Spark UI provides a wealth of information that you can use for debugging and troubleshooting issues with your Spark applications. Additionally, it also provides access to both driver and executor stdout/stderr logs, where you might have logged debugging information. To know more about debugging visit the debugging page Link