How to create and manage a Pager?
This section provides a step-by-step guide on creating and managing Pager resources in DataOS. It covers prerequisites, manifest file creation, applying the Pager resource, and verifying alerts across different channels.
Pre-requisites
Before creating a Pager Resource, the following prerequisites must be met.
-
Ensure that the Monitor Resource is already configured and working as expected.
-
Verify that the appropriate permissions are available to create and manage a Pager Resource.
Once the prerequisites are satisfied, Pager Resource in DataOS can be created.
Step 1: Create a Pager manifest file
To create a Pager Resource, the first step is to create a Pager manifest file, template is given below:
# Resource meta section
name: ${{pager-identifier}}                   # mandatory
version: v1alpha                              # mandatory
type: pager                                   # mandatory
description: ${{pager-description}}           # mandatory

# Pager-specific section
pager:
  conditions:                                 # mandatory
    - valueJqFilter: .properties.name         # mandatory
      operator: equals                        # mandatory
      value: servicerunfailed                 # mandatory
    - valueJqFilter: .properties.severity
      operator: equals
      value: high

# Output
  output:                                     # mandatory
    email:
      emailTargets:                           # mandatory
        - ${{email-target1}}
        - ${{email-target2}}
      templateType: ${{email-template-type}}  # optional
      template: ${{email-template}}           # optional

    msTeams:
      webHookUrl: ${{ms-teams-webhook-url}}   # mandatory

    webHook:
      url: ${{webhook-url}}                   # mandatory
      verb: post                              # mandatory
      contentType: ${{webhook-content-type}}  # mandatory
      authorization:                          # optional
        token: ${{webhook-token}}                       # mandatory
        customHeader: ${{webhook-custom-header}}        # optional
      templateType: ${{webhook-template-type}}          # mandatory
      headers:                                          # optional
        'content-type': '${{webhook-content-type}}'     # mandatory
      bodyTemplate: |                                   # optional
        {
        "blocks": [
            {
            "type": "header",
            "text": {
                "type": "plain_text",
                "text": ":warning: Incident detected by, {{.Monitor.Name}}!"
            }
            },
            {
            "type": "section",
            "text": {
                "type": "mrkdwn",
                "text": "*Incident Type* - {{.Properties.Severity}} was observed at *Publish Time* - {{.CreateTime}}"
            }
            },
            {
            "type": "section",
            "text": {
                "type": "mrkdwn",
                "text": "{{.Monitor.Description}}"
            }
            }
        ]
        }
# Resource meta section
name: testalerts                   # mandatory
version: v1alpha                              # mandatory
type: pager                                   # mandatory
description: testing pager                    # mandatory

# Pager-specific section
pager:
  conditions:                                 # mandatory
    - valueJqFilter: .properties.severity
      operator: equals
      value: high

# Output
  output:                                     # mandatory
    email:
    emailTargets:                           # mandatory
      - iamgroot@tmdc.io
      - thisisthor@tmdc.io

    webHook:
      url: https://rubikdatasolutions.webhook.office.com/webhookb2/09239cd8-92a8-4d59-9621-9217305bf6ed34531ea65c/631bd149-c89d-4d3b-8979-8e364f62b419/V2GRmwzBgUEv2Ymj7BFO5KLbFJpINLg7dk5AlFT9fl2KM1                   # mandatory
      verb: post                              # mandatory
      contentType: application/json  # mandatory
      templateType: liquid          # optional
      bodyTemplate: |
        {
              "@type": "AdaptiveCard",
              "summary": "Service has Failed",
              "themeColor": "0076D7",
              "sections": [
                  {
                  "activityTitle": "Sending this alert,",
                  "activitySubtitle": "⚠️ Our system detected an issue with the service and was unable to complete the process as expected.",
                  "facts": [
                      {
                      "name": "service:",
                      {% assign id_parts = reportContext.resourceId | split: ':' %}
                      {% assign type = id_parts[0] %}
                      {% assign version = id_parts[1] %}
                      {% assign name = id_parts[2] %}
                      {% assign workspace = id_parts[3] %}
                      "value": "{{ name }}"
                      },
                      {
                      "name": "Failure Time:",
                      "value": "{{ createTime }}"
                      },
                      {
                      "name": "Severity:",
                      "value": "{{ properties.severity }}"
                      },
                      {
                      "name": "Run Details:",
                      "value": "[View Run Details](https://liberal-katydid.dataos.app/operations/user-space/resources/resource-runtime?name={{ name }}&type=service&workspace={{ workspace }})"
                      },
                      {
                      "name": "Logs:",
                      "value": "[View Logs](https://liberal-katydid.dataos.app/metis/resources/service/dataos.{{ workspace }}.{{ name }}/run_history)"
                      }
                  ]
                  },
                  {
                  "text": "We understand the importance of timely and accurate data processing, and our team is actively working to resolve the issue and get the pipeline back up and running as soon as possible.\n\nIf you have any questions or concerns, please reach out to us on our [support portal](https://support.yourcompany.com)."
                  },
                  {
                  "text": "Best regards, "
                  }
              ]
              }
For more information about the Pager manifest configurations, refer to the link below: Pager configuration
Step 2: Applying the Pager manifest file
Once you have created a Pager manifest, you can instantiate a Pager Resource-instance within the DataOS using the apply command on the DataOS command line interface. The command is as follows:
Replace the ${yaml-file-path} and ${workspace-name} with respective absolute or relative file path of the Pager manifest and the Workspace name in which the Resource is to be created.
Step 3: Verify Pager creation
To confirm that your Pager has been successfully created, you can verify it using two methods:
- Check Pagers in a workspace: Use the following command to list the Pagers created by you in a specific Workspace:
- Retrieve all Pagers in a workspace: To retrieve the list of all Pagers created in the Workspace, add the
-aflag to the command:
You can also access the details of any created Pager through the DataOS GUI in the Resource tab of the Operations App.
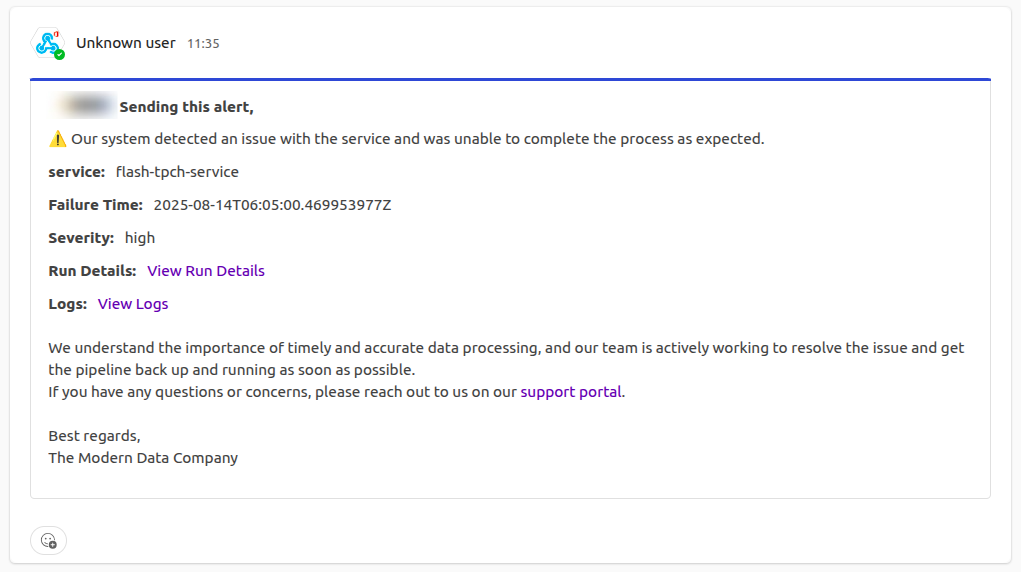
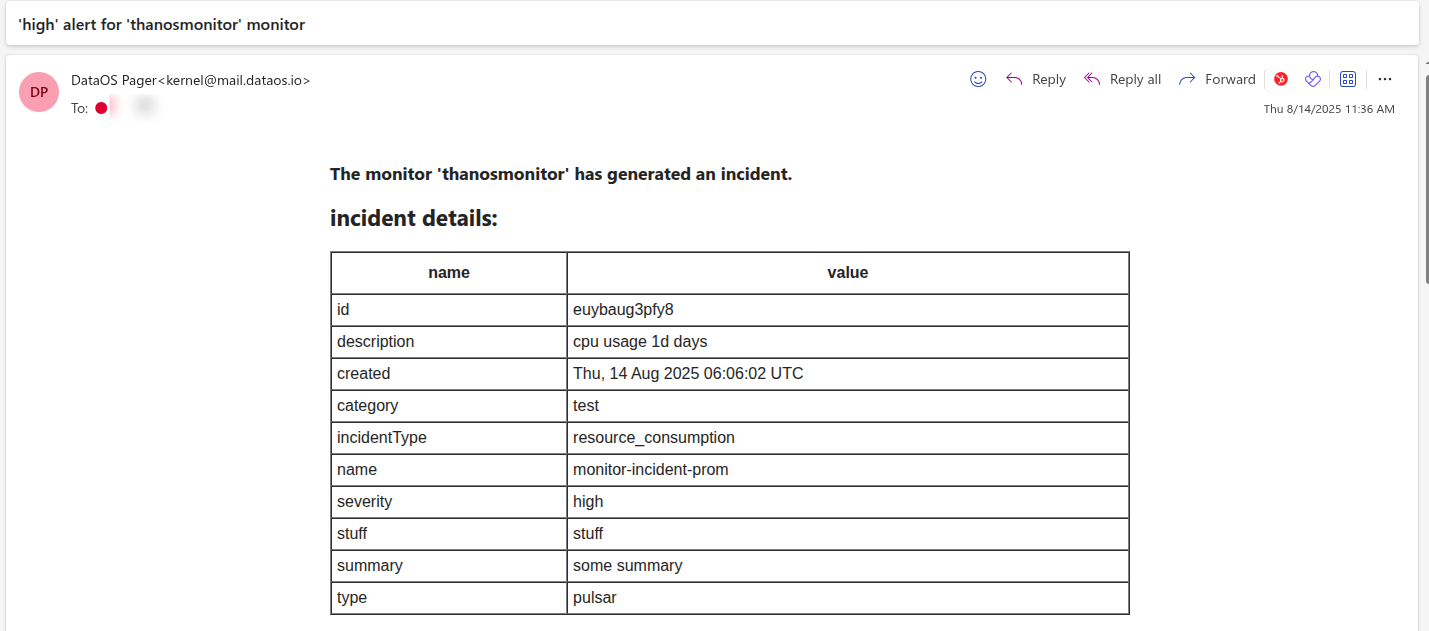
Get alerts!
Below are example images of how Pager alerts appear in different channels: