How to observe a Depot?
DataOS provides a comprehensive set of observability solutions, including the Operations app, Metis UI, Monitor, and Pager, to track the Depot. The Operations app offers real-time insights into performance and resource utilization, while the Monitor enables observation, and the Pager notifies whenever the incident condition is met by the Monitor. You can track the status of a Depot—whether it is active or deleted—using the Monitor Resource, DataOS CLI, and Metis UI. Additionally, you can configure Pager Resource to receive notifications if a Depot is deleted.
How to monitor the status and runtime of a Depot using Metis UI?
Users can track the status of a Depot, whether active or deleted, along with the total count of active and deleted Depot through the Metis UI.
-
Simply navigate to
Resources → Depotsto check the status of any Depot within the environment. Additionally, users can quickly find a specific Depot by searching for its name in the Metis UI search bar.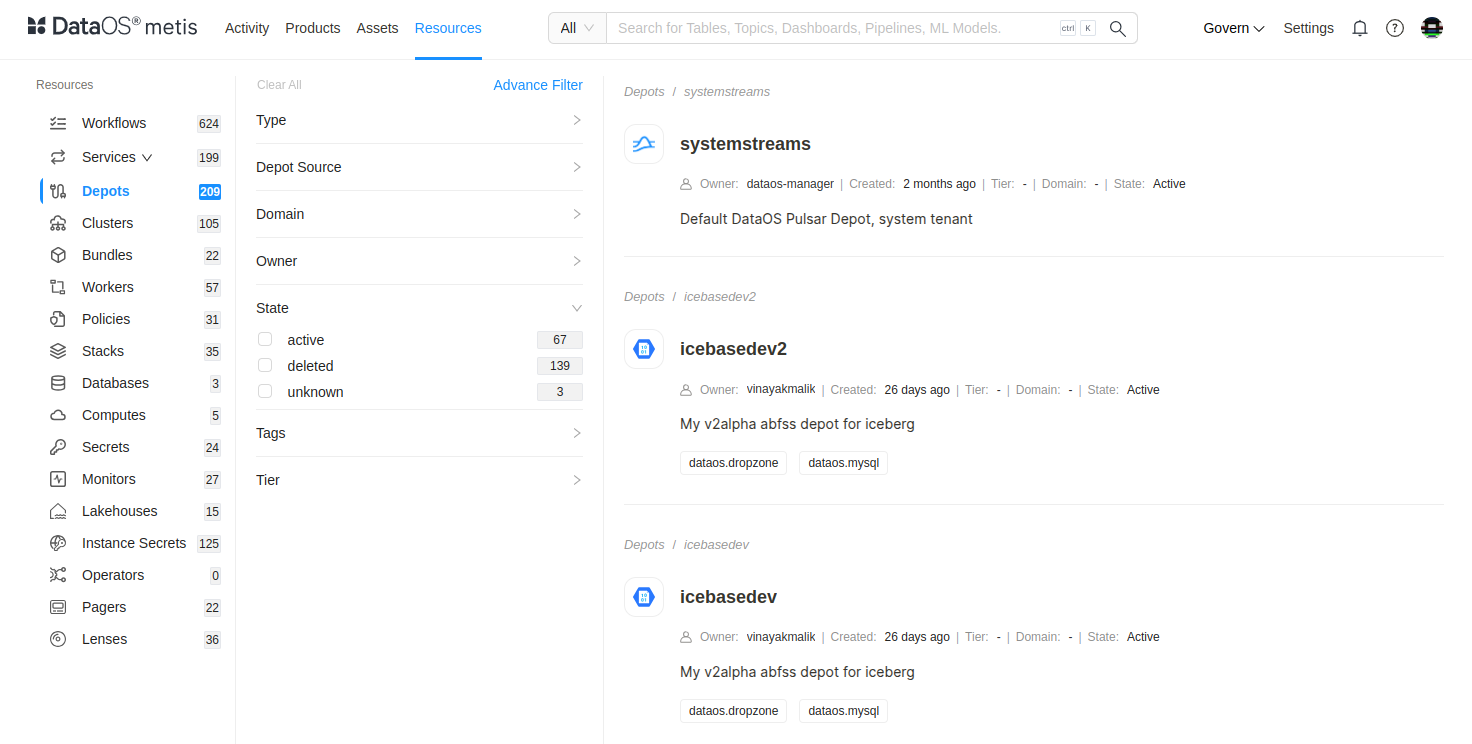
Metis UI -
When a user clicks on a specific Depot, they can also track the aggregated status along with the runtime, which applies only to certain types of Depots.
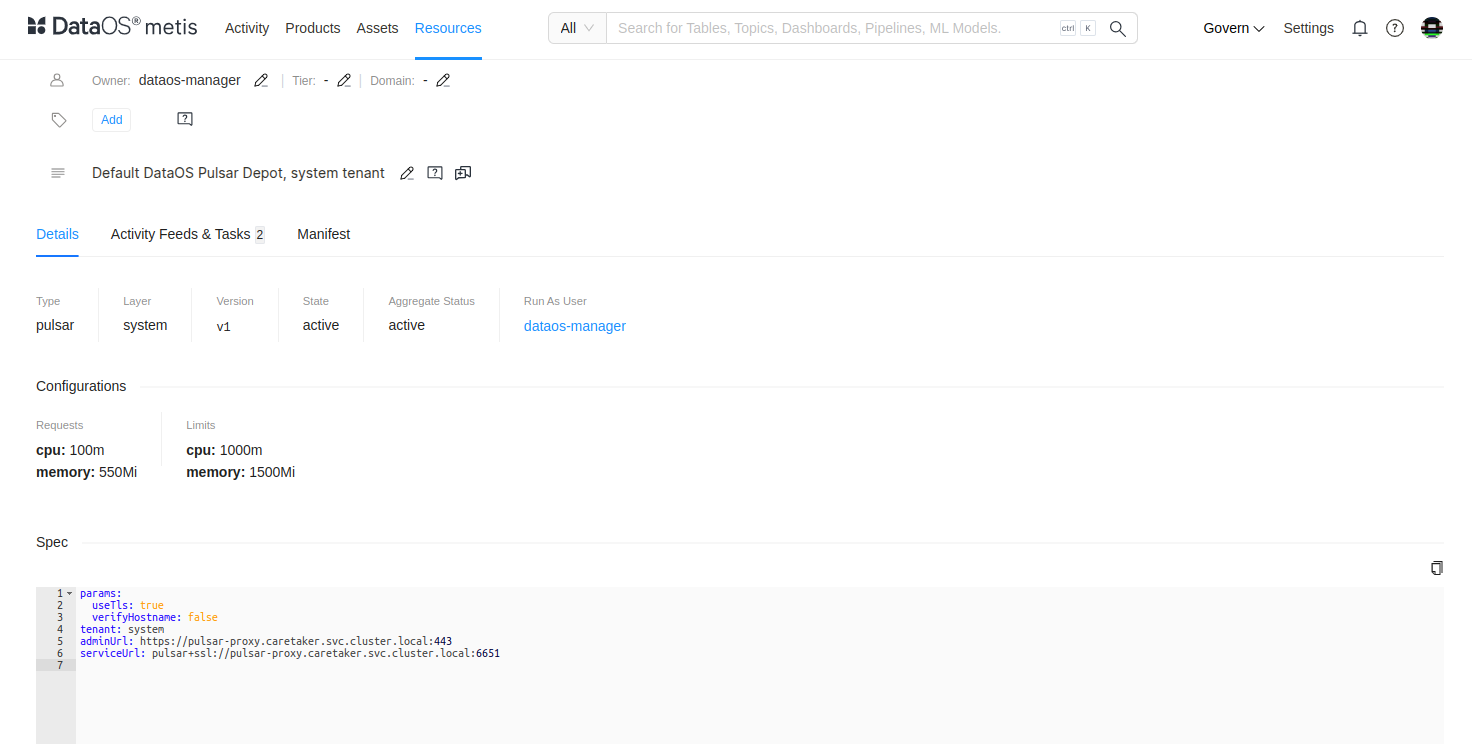
Metis UI
How to monitor the status and runtime of a Depot using DataOS CLI?
Users can check whether a Depot is active or deleted by running the command dataos-ctl resource get -t depot -n ${{depotname}} in the DataOS CLI. The output will appear as follows:
dataos-ctl get -t depot -n systemstreams
INFO[0000] 🔍 get...
INFO[0000] 🔍 get...complete

      NAME      | VERSION | TYPE  | WORKSPACE | STATUS | RUNTIME |     OWNER
----------------|---------|-------|-----------|--------|---------|-----------------
  systemstreams | v1      | depot |           | active |         | dataos-manager
How to get notified whenever the status of an Instance Secret changes?
Users can configure a Monitor Resource to define the conditions for triggering an alert. They can then set up a Pager Resource to specify the alert path and the text schema format in which the alert will be delivered. The alert path can be a webhook URL, email ID, or any other designated endpoint.
This section outlines the steps to create a Monitor Resource that triggers an incident when the state of a Depot changes from active to deleted. Make sure you have the permission to create a Monitor Resource.
Step 1: Create a manifest file for Monitor Resource
Begin by creating a manifest file that contains the configurations of the Monitor as shown below in template. Replace the Depot name with your actual Depot.
# Resource meta section
name: runtime-monitor
version: v1alpha
type: monitor
tags:
  - dataos:type:resource
  - dataos:layer:user
description: Attention! instance secret is deleted
layer: user
monitor:

# Monitor-specific section
  schedule: '*/2 - - - *'
  incident:
    name: depotincident
    severity: high
    incidentType: depotincident

  type: report_monitor
# Report Monitor specification
  report:
    source:
      dataOsInstance:
         path: /collated/api/v1/reports/resources/status?id=depot:v2alpha:bigquery-depot
    conditions:
      - valueComparison:
          observationType: state
          valueJqFilter: '.value'
          operator: equals
          value: deleted
Step 2: Validate the DataOS instance API path
Before applying the Monitor Resource file, it is recommended to check the response of the API endpoint.
Step 3: Apply the Monitor manifest file
After validating the API endpoint, the next step is to apply the Monitor manifest file by executing the code below.
step 4: Validate the Monitor
Validate or check the runtime of the Monitor by executing the below command.
dataos-ctl get runtime -t monitor -w public -n runtime-monitor1 -r
INFO[0000] 🔍 monitor...
INFO[0000] 🔍 monitor...complete

        NAME       | VERSION |  TYPE   | WORKSPACE |    OWNER
-------------------|---------|---------|-----------|--------------
runtime-monitor1 | v1alpha | monitor | public    | iamgroot

        NAME       | VERSION |  TYPE   | WORKSPACE |    OWNER
-------------------|---------|---------|-----------|--------------
runtime-monitor1 | v1alpha | monitor | public    | iamgroot


STATUS |            RUNTIME
---------|---------------------------------
active | next:2025-01-28T18:38:00+05:30


    RUN ID    |          STARTED          |         FINISHED          | RUN STATUS |                                                                     RESULT
---------------|---------------------------|---------------------------|------------|-------------------------------------------------------------------------------------------------------------------------------------------------
ebctzh4krmro | 2025-01-28T18:30:00+05:30 | 2025-01-28T18:30:00+05:30 | completed  | 🟧 monitor condition not met for monitor: 'runtime_monitor1_public'
---------------|---------------------------|---------------------------|------------|----------------------------------------------------------------------
ebctt1wkmsxv | 2025-01-28T18:28:00+05:30 | 2025-01-28T18:28:00+05:30 | completed  | 🟧 monitor condition not met for monitor: 'runtime_monitor1_public'
---------------|---------------------------|---------------------------|------------|----------------------------------------------------------------------
ebctmmokhz42 | 2025-01-28T18:26:00+05:30 | 2025-01-28T18:26:00+05:30 | completed  | 🟧 monitor condition not met for monitor: 'runtime_monitor1_public'
---------------|---------------------------|---------------------------|------------|----------------------------------------------------------------------
ebcuiqs8omis | 2025-01-28T18:36:00+05:30 | 2025-01-28T18:36:00+05:30 | completed  | 🟩 monitor condition met for monitor: 'runtime_monitor1_public', 'instance-secret:v1:modern-docker-secret', created incident id 'ebcuird1u680'
---------------|---------------------------|---------------------------|------------|-------------------------------------------------------------------------------------------------------------------------------------------------
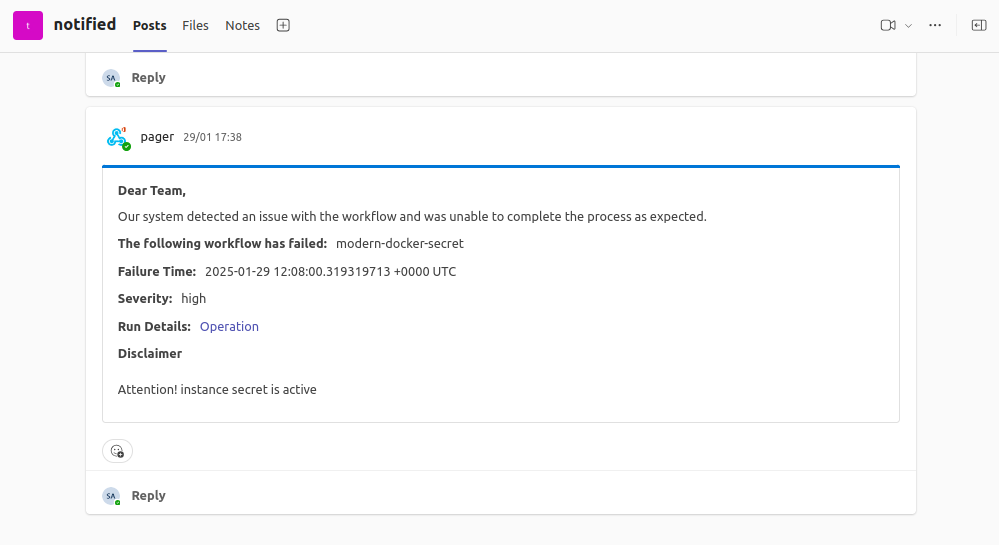
Now whenever the Monitor condition is met, it will trigger an incident.
How to create a Pager Resource to get notified whenever a Depot gets deleted?
Through Monitor whenever the condition is met it will trigger an incident, we will use that incident to get notified on the desired platform such as Microsoft Teams, Outlook, etc. by creating a Pager Resource. This section involves the steps to create a Pager Resource.
Step 1: Create a manifest file for Pager
Begin by creating a manifest file that contains the configurations of Pager as shown below in template. Replace the given values with your actual values and edit the notification template as required.
name: instancesecrpager
version: v1alpha
type: pager
tags:
  - dataos:type:resource
  - depot-failed-pager
description: This is for sending Alerts on Microsoft Teams Channel.
workspace: public
pager:
  conditions:
    - valueJqFilter: .properties.name
      operator: equals
      value: depotincident

  output:
    webHook:
      url: https://rubikdatasolutions.webhook.office.com/webhookb2/e6b48e18-bdb1-4ffc-98d5-cf4a3826lkh4@2e22bdde-3ec2-43f5-bf92-78e9f35a44fb/IncomingWebhook/d23792bec444445gg8bb7193145gg5he985/631bd149-c89d-4d3b-8979-8e364f62b419/V2ZJfUrl5d8I5xPhM80JyeE9LqKHU53gPsJQX9H8I2fOs1
      verb: post
      headers:
        'content-type': 'application/json'
      bodyTemplate: |
          {
            "@type": "MessageCard",
            "summary": "Depot is deleted",
            "themeColor": "0076D7",
            "sections": [
              {
                "activityTitle": "Dear Team,",
                "activitySubtitle": "Depot is deleted",
                "activityImage": "https://adaptivecards.io/content/cats/3.png",
                "facts": [
                  {
                    "name": "Following Depot is deleted",
                    "value": "{{ index (splitn ":" 4 .ReportContext.ResourceId) "_2" }}"
                  },
                  {
                    "name": "Failure Time:",
                    "value": "{{ .CreateTime }}"
                  },
                  {
                    "name": "Severity:",
                    "value": "{{ .Properties.severity }}"
                  },
                  {
                    "name": "Run Details:",
                    "value": "<a href=\"https://${dataos-fqdn}/operations/user-space/resources/resource-status?name={{ index (splitn ":" 4 .ReportContext.ResourceId) "_2" }}&type=depot\">Operation</a>"
                  },
                  {
                    "name": "Logs:",
                    "value": "<a href=\"https://${dataos-fqdn}/metis/resources/depot/dataos.public.{{ index (splitn ":" 4 .ReportContext.ResourceId) "_2" }}/run_history\">Metis</a>"
                  }
                ]
              },
              {
                "title": "Disclaimer",
                "text": "{{ .Monitor.Description }}"
              }
            ]
          }
Step 2: Apply the manifest file of the Pager Resource
After validating the API endpoint, the next step is to apply the Monitor manifest file by executing the code below.
Step 3: Get Notification!
You will get a notification on the team's channel whenever the conditions of the incident are met.
Operational monitoring
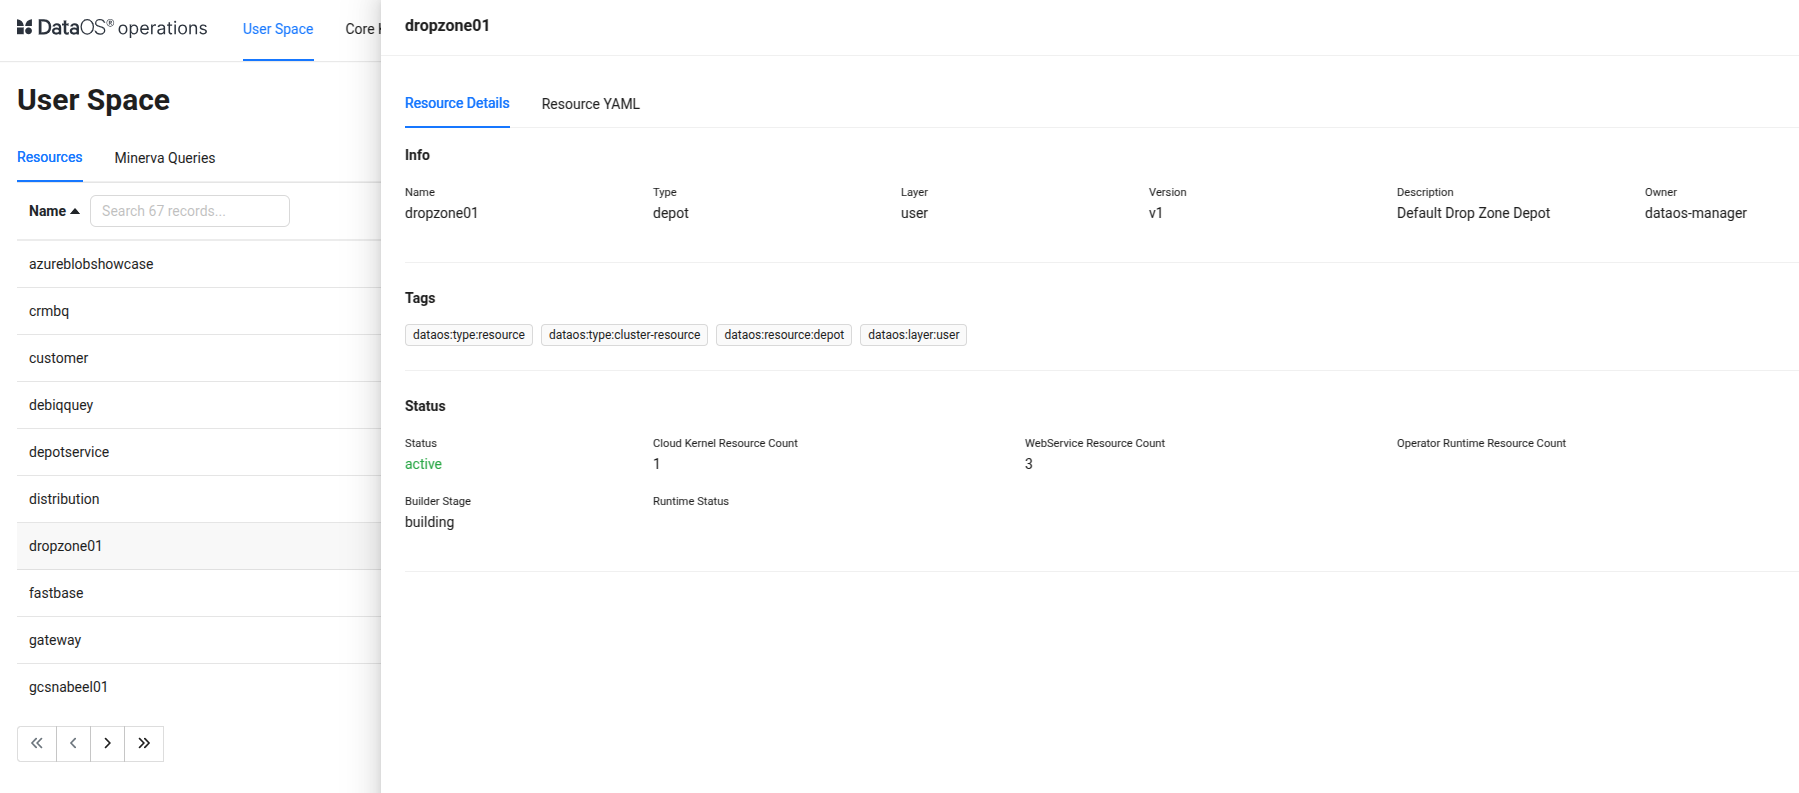
Using the Operations App, users can monitor the operational logs of a Depot. In addition to tracking its status, they can also view details such as the builder stage, Cloud Kernel Resource Count, WebService Resource Count, and, if applicable, the Operator Runtime Resource Count.
Follow the below steps to monitor a Depot on the Operations app:
-
Open the Operations app.
-
Navigate to the User Space tab and go to the Resources section.
-
Select Depot as the Resource type to filter all Depots in the environment.
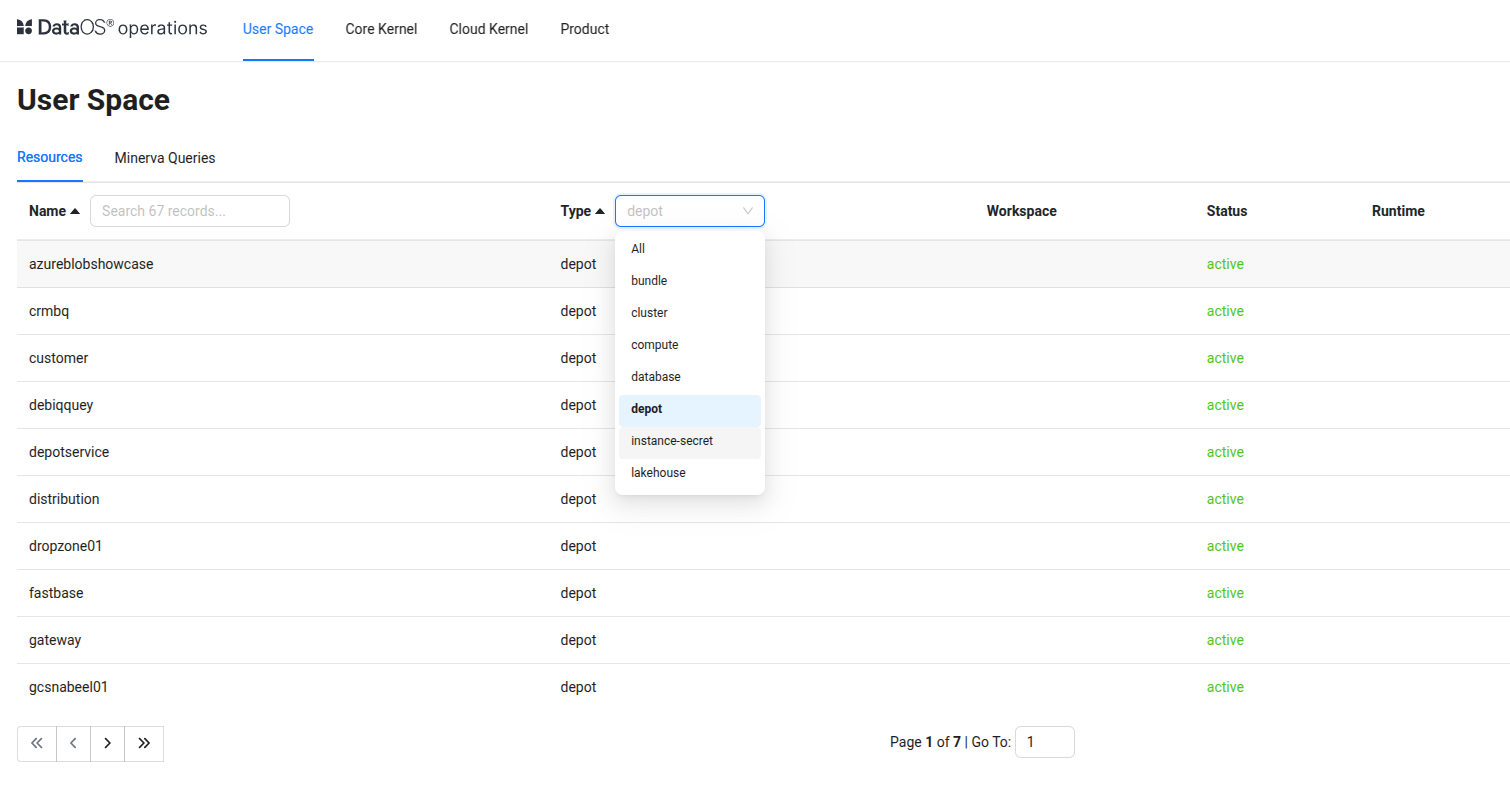
-
Search for or select the target Depot.
-
Monitor its status, including Cloud Kernel Resource Count, WebService Resource Count, Operator Runtime Resource Count, Builder Stage, and Runtime Status.
How to observe the pods of a Depot Service using the Operations app?
Follow the below steps to observe the pod logs of the Depot Service.
-
Go to the Core Kernel section in the Operations app.
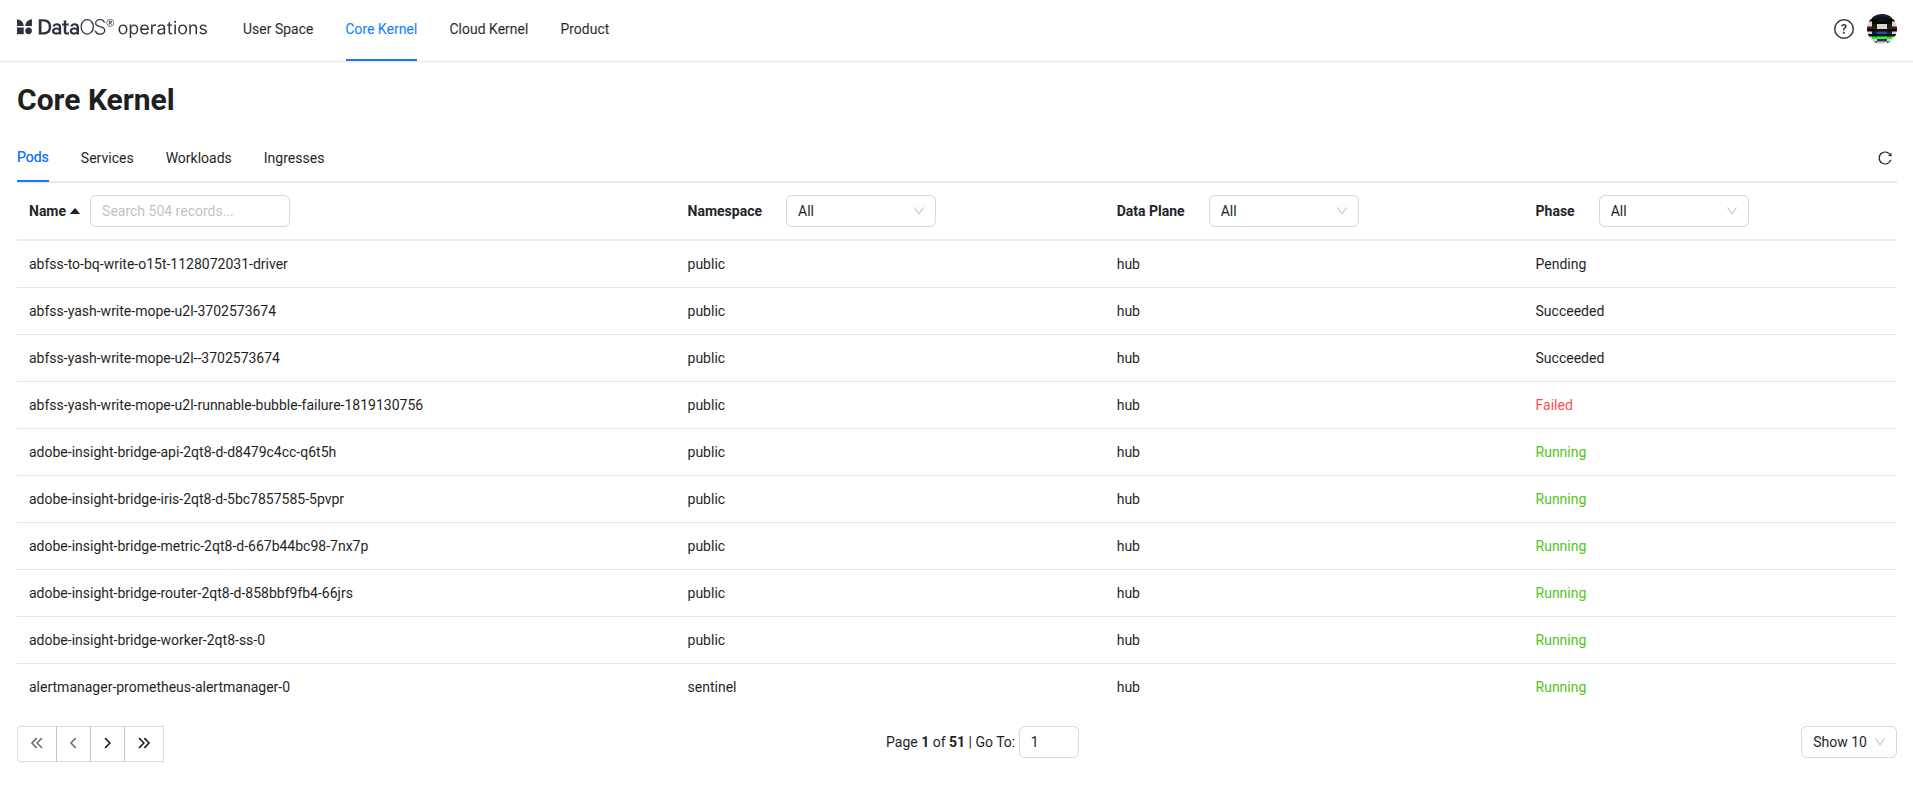
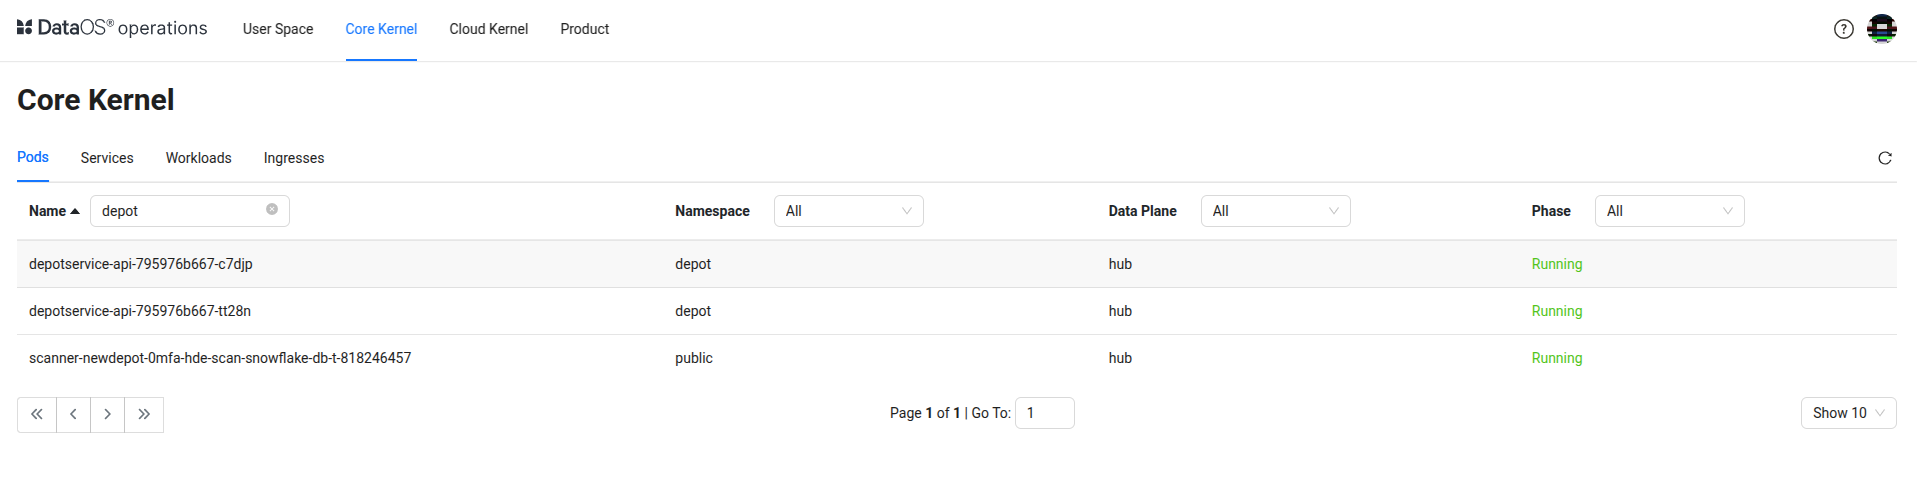
-
In the Pods tab, search for Depot to view all related pods.
-
Select a pod from the list.
-
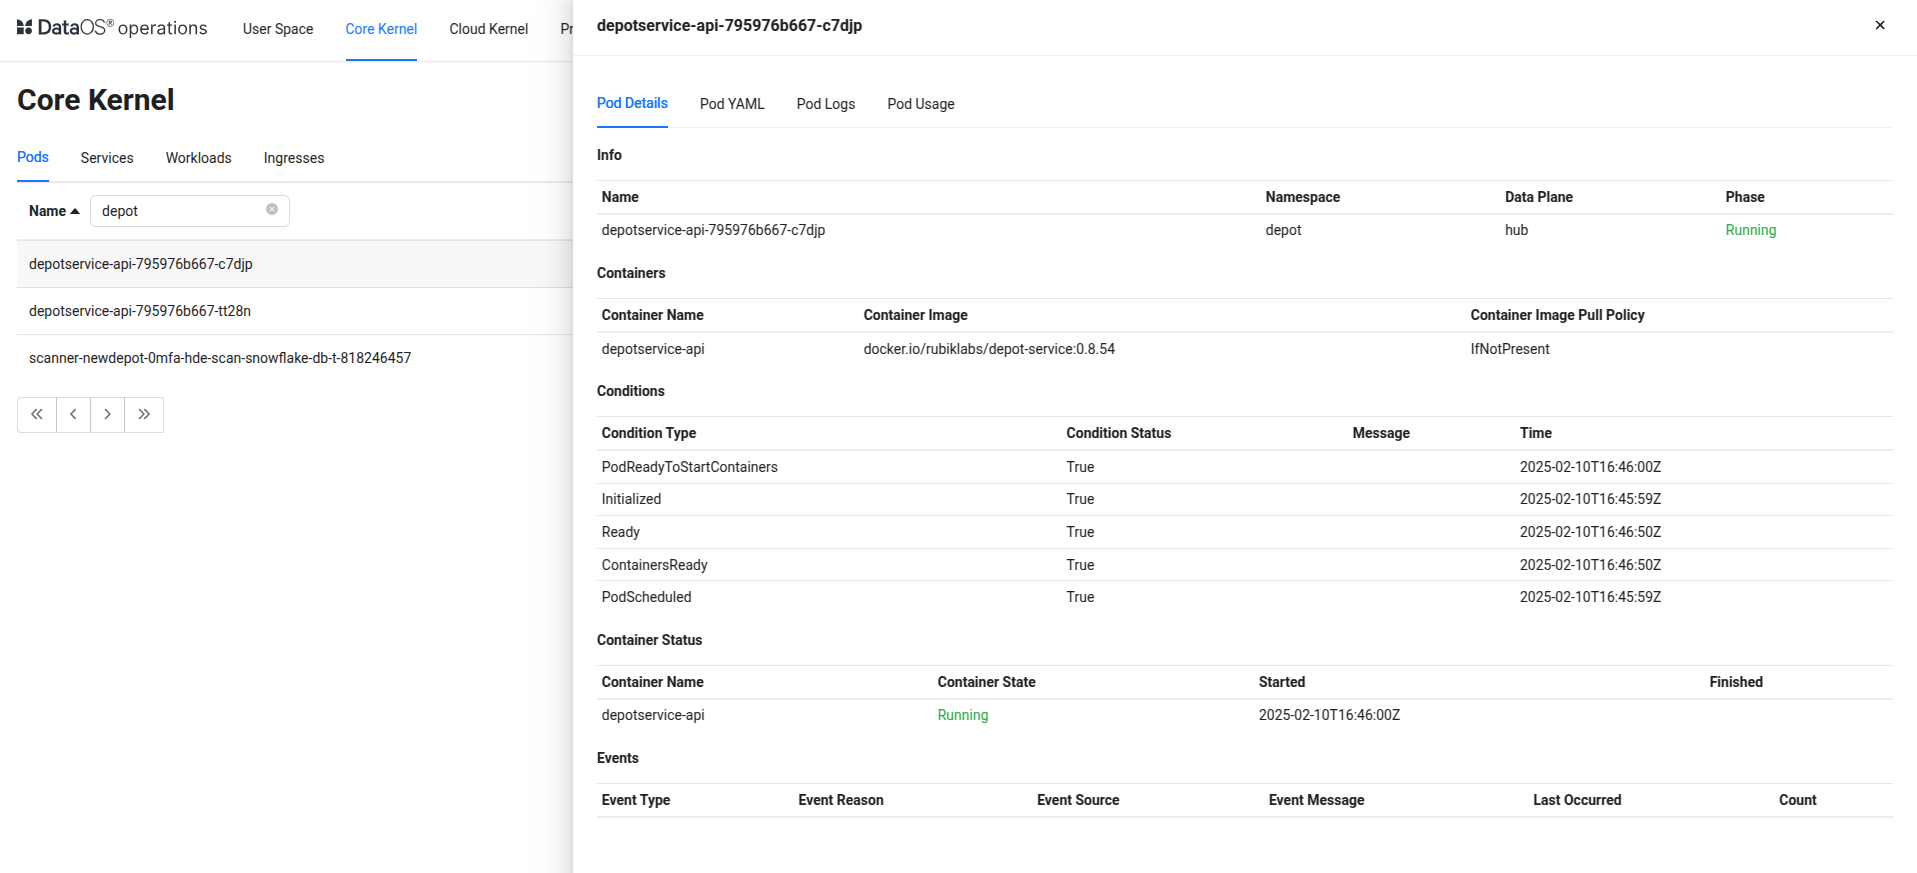
Clicking on the pod will open a right-side panel with four sections: Pod Details, Pod Logs, Pod YAML, and Pod Usage.
-
Pod details include:
-
Pod Details
- Name:
depotservice-api-795976b667-c7djp- Namespace:
depot- Data Plane:
hub- Phase:
Running(indicating the pod is active and functioning)
-
Containers
- Container Name:
depotservice-api- Container Image:
docker.io/rubiklabs/depot-service:0.8.54- Container Image Pull Policy:
IfNotPresent(ensures the image is only pulled if not already available locally)
-
Conditions
(Pod’s readiness and initialization status)
-
PodReadyToStartContainers:True -
Initialized: True -
Ready: True -
ContainersReady: True -
PodScheduled: True (All conditions beingTrueindicates the pod is successfully running and fully operational.)
-
-
Container Status
-
Container Name:-
depotservice-api -
Container State:-
Running -
Started At:-
2025-02-10T16:46:00Z -
Events- (This section would normally show logs related to the pod's lifecycle, errors, or warnings.)
-
-
-
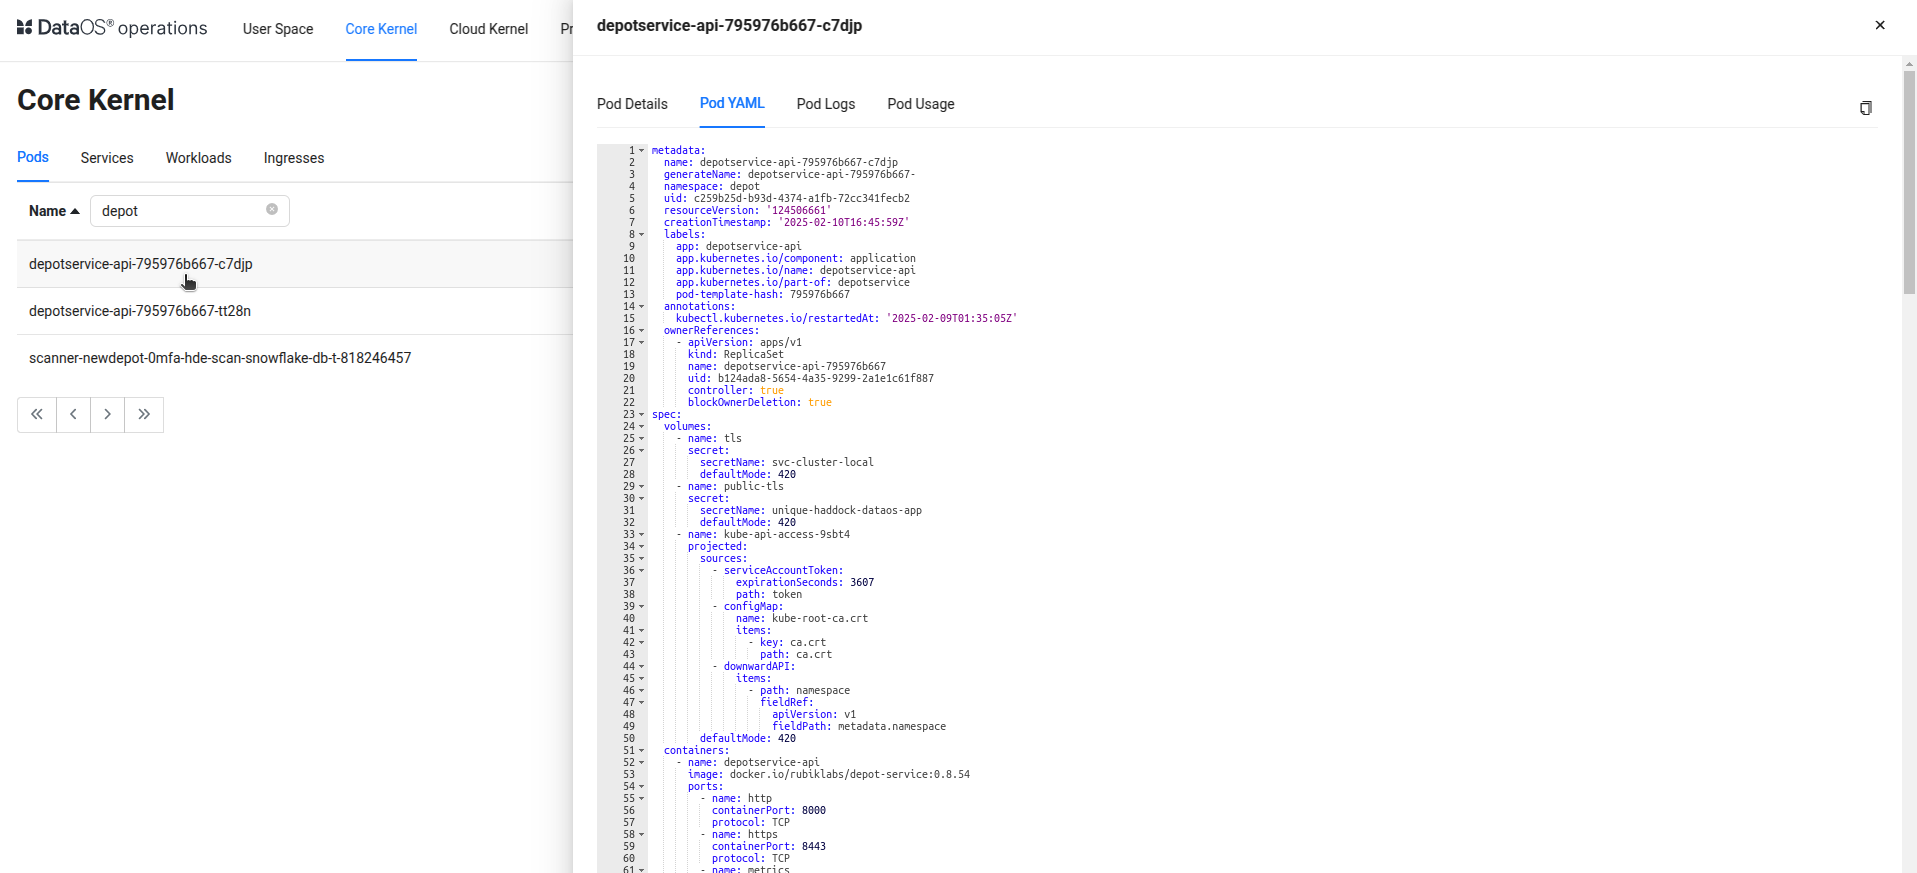
Pod YAML contains the manifest file of the Pod.
-
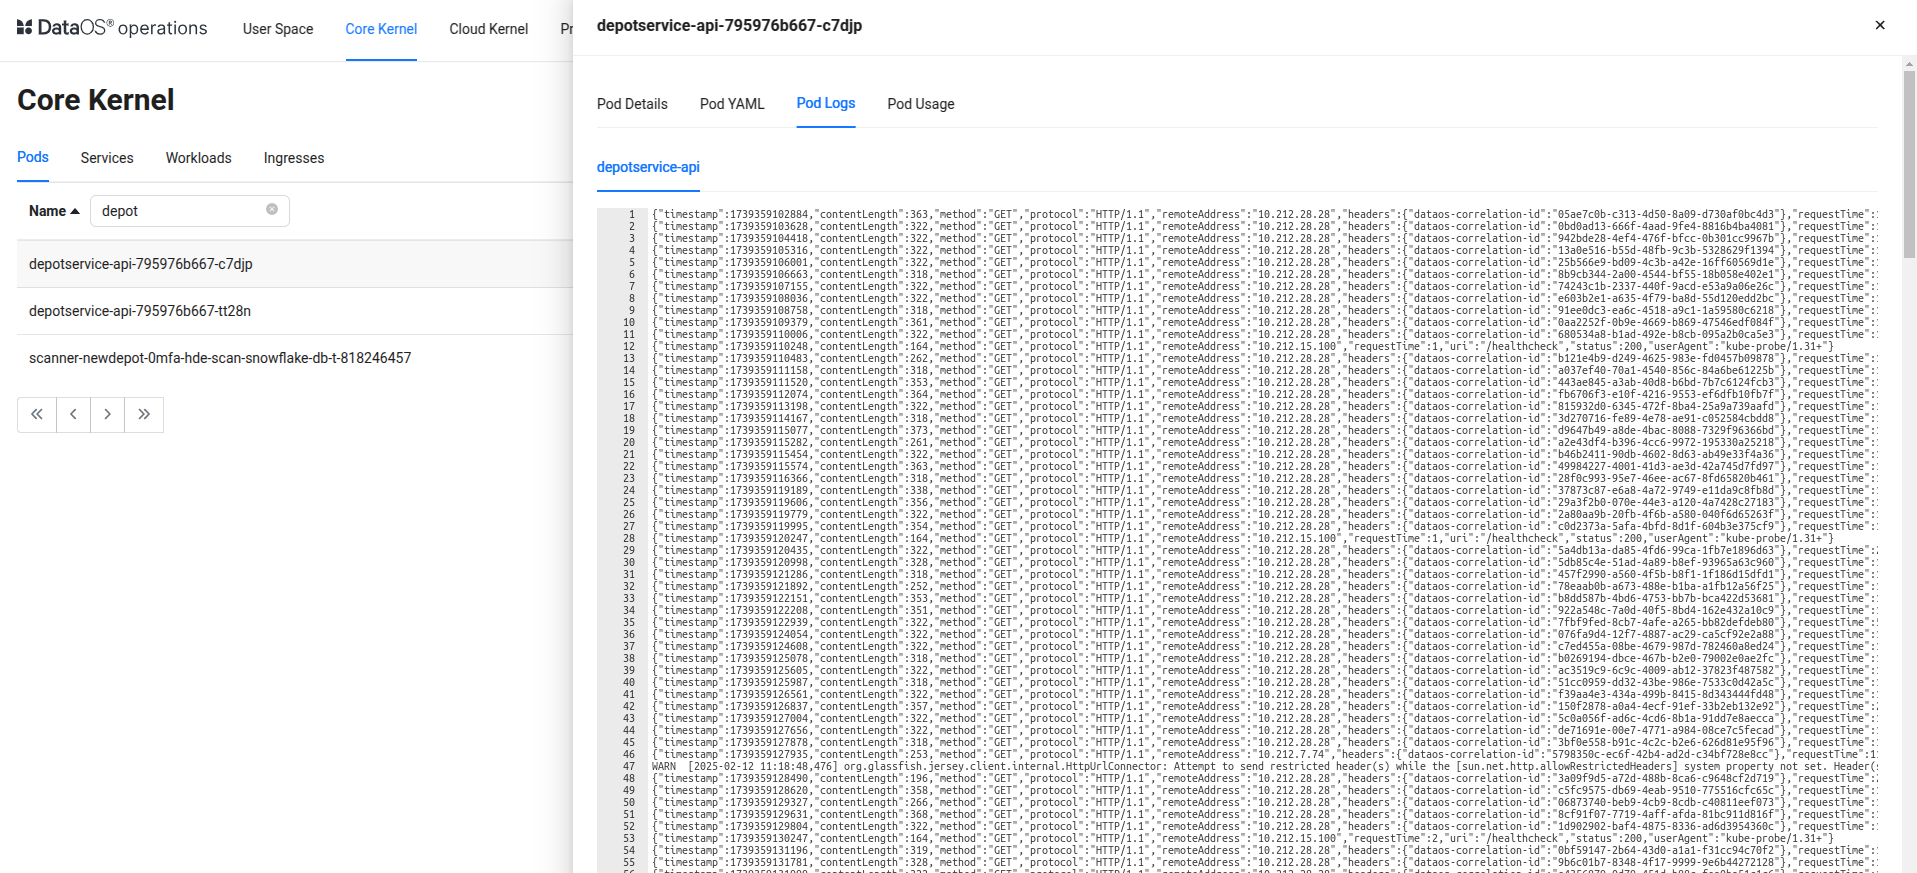
Pod Logs contains the logs related to the Pod.
-
The Pod Usage panel in DataOS Operations provides insights into the resource consumption of running pods within a namespace. It helps monitor CPU and memory utilization over time, ensuring optimal performance and resource allocation.
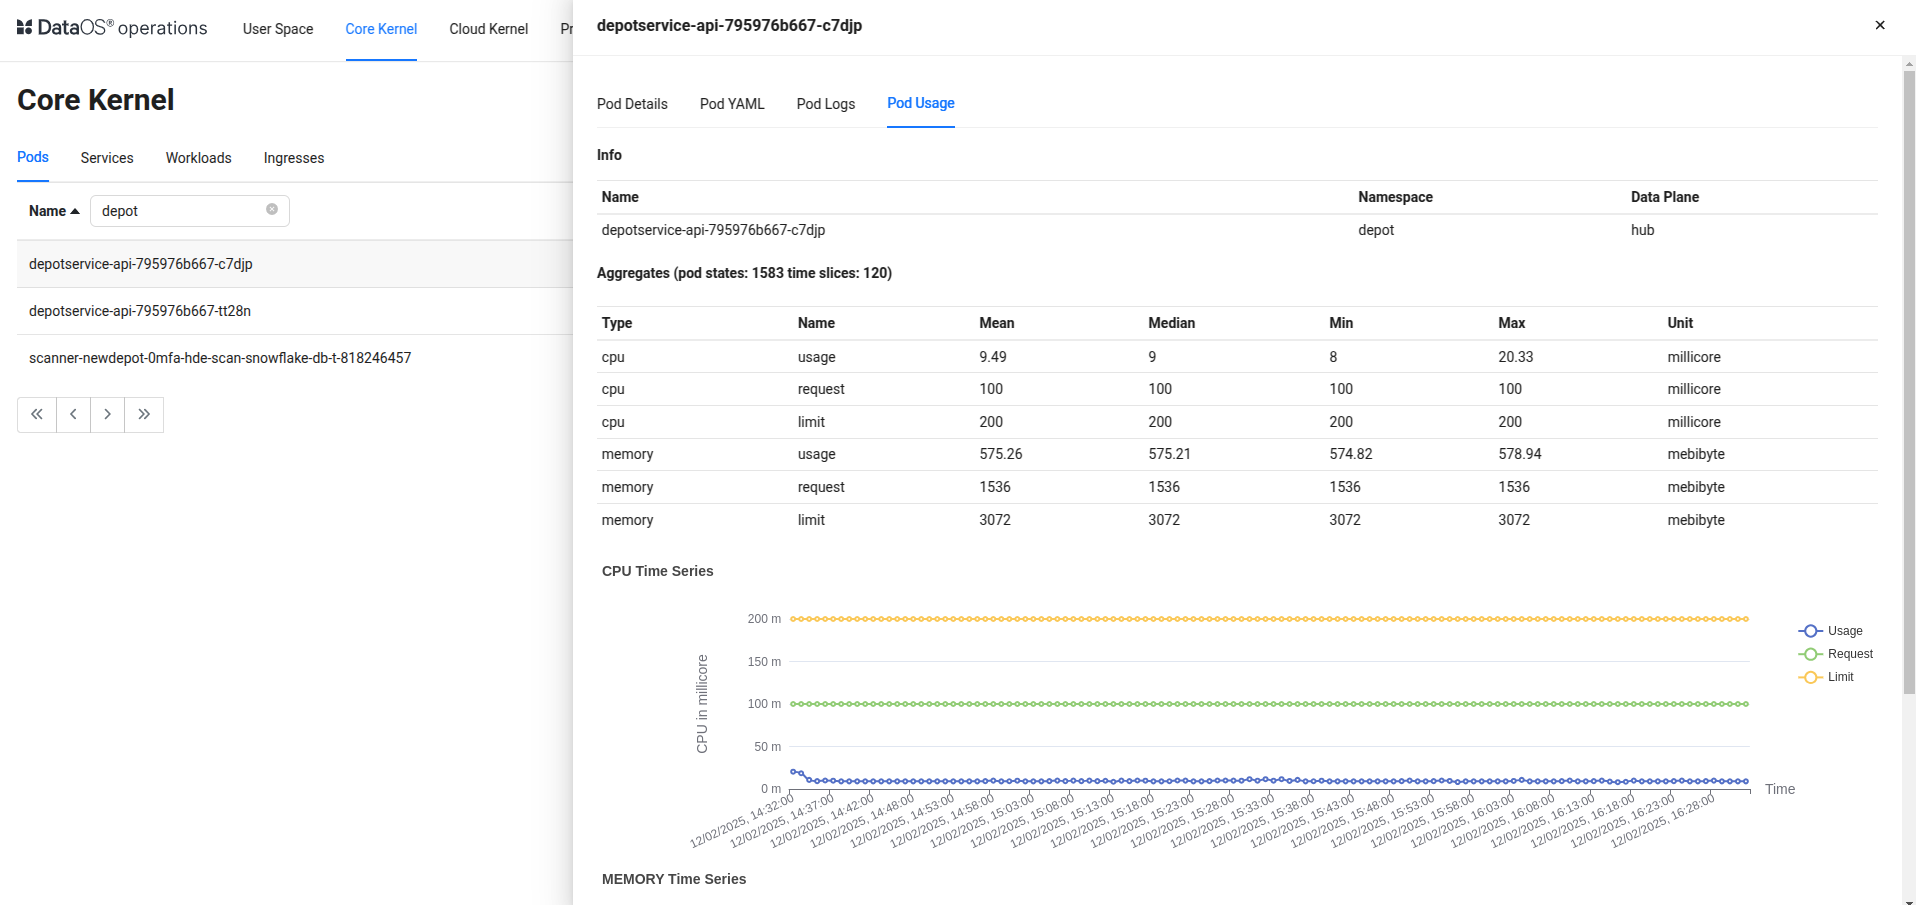
CPU Usage
CPU metrics indicate the pod’s processing power consumption. The panel displays real-time and historical CPU usage, comparing it against requested and maximum allowed limits. This helps assess whether a pod is underutilized or nearing resource constraints.
Memory Usage
Memory metrics show how much RAM a pod consumes relative to its allocated quota. The data highlights trends in memory utilization, ensuring that pods have sufficient resources while avoiding unnecessary over-provisioning.
Performance Insights
This dashboard helps maintain system stability and efficiency by providing clear visibility into resource consumption trends.
-
Efficient Resource Management: The panel ensures that pods are operating within assigned CPU and memory limits.
-
Trend Analysis: Time series graphs visualize usage patterns, helping identify spikes, bottlenecks, or inefficiencies.
-
Optimization & Scaling: Monitoring usage trends enables better resource allocation and scaling decisions.